. 2024 Oct;56(10):2144-2157.
doi: 10.1038/s41588-024-01891-8. Epub 2024 Aug 21.

Organismal metabolism regulates the expansion of oncogenic PIK3CA mutant clones in normal esophagus

Affiliations

Organismal metabolism regulates the expansion of oncogenic PIK3CA mutant clones in normal esophagus

Albert Herms et al. Nat Genet. 2024 Oct.

Abstract

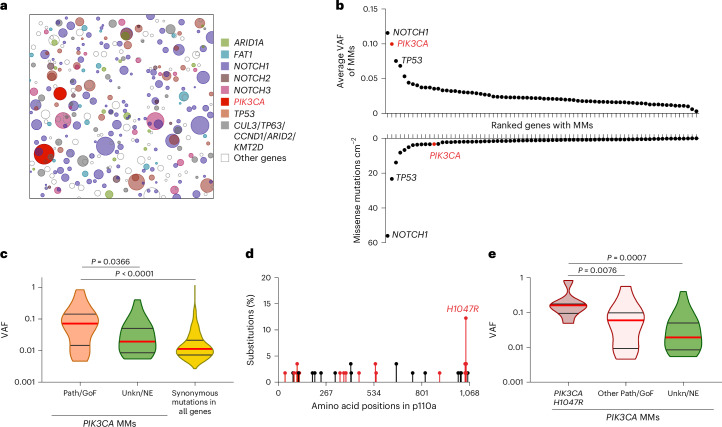
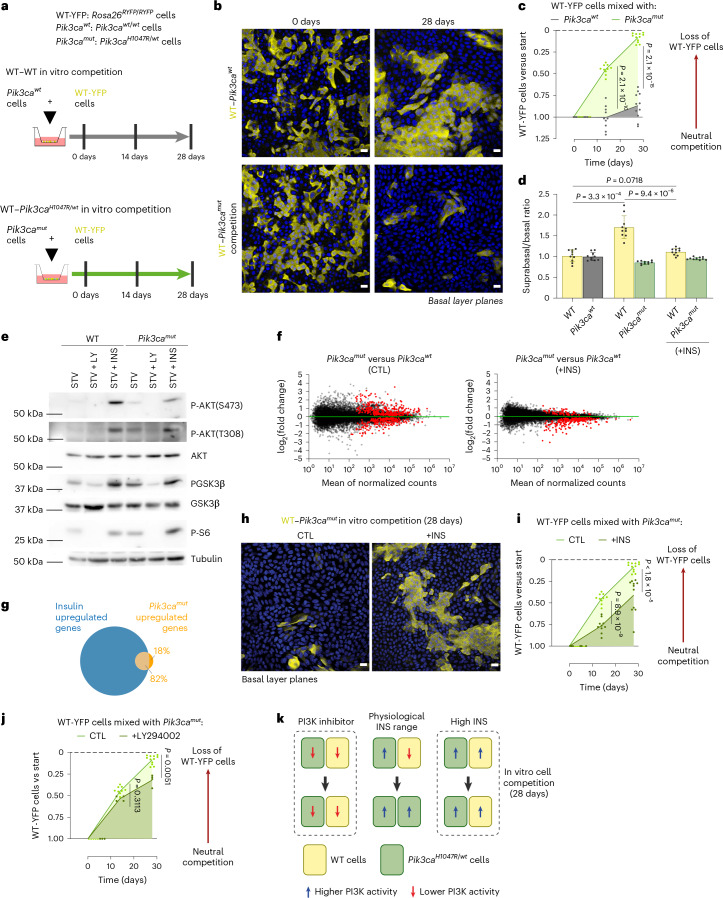
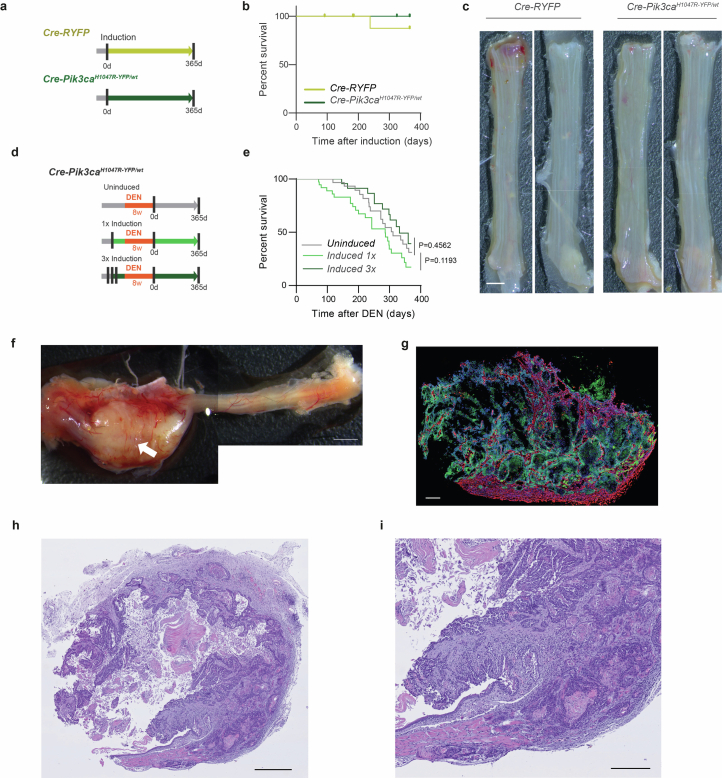
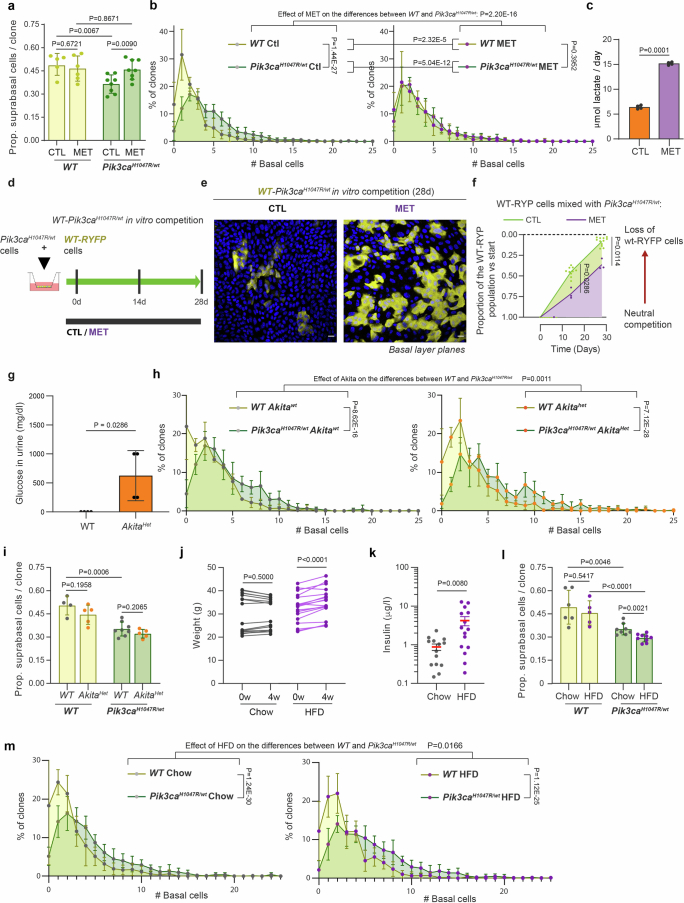
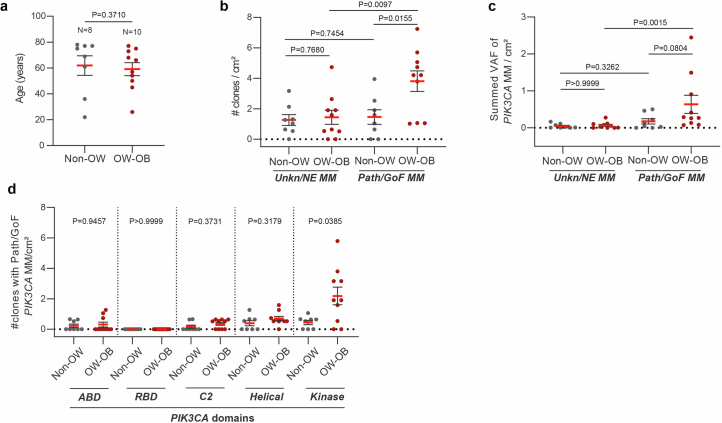
Oncogenic PIK3CA mutations generate large clones in aging human esophagus. Here we investigate the behavior of Pik3ca mutant clones in the normal esophageal epithelium of transgenic mice. Expression of a heterozygous Pik3caH1047R mutation drives clonal expansion by tilting cell fate toward proliferation. CRISPR screening and inhibitor treatment of primary esophageal keratinocytes confirmed the PI3K-mTOR pathway increased mutant cell competitive fitness. The antidiabetic drug metformin reduced mutant cell advantage in vivo and in vitro. Conversely, metabolic conditions such as type 1 diabetes or diet-induced obesity enhanced the competitive fitness of Pik3caH1047R cells. Consistently, we found a higher density of PIK3CA gain-of-function mutations in the esophagus of individuals with high body mass index compared with those with normal weight. We conclude that the metabolic environment selectively influences the evolution of the normal epithelial mutational landscape. Clinically feasible interventions to even out signaling imbalances between wild-type and mutant cells may limit the expansion of oncogenic mutants in normal tissues.


Conflict of interest statement

B.C. is an employee of Altos Labs (Cambridge, UK). B.V. is a consultant for iOnctura (Geneva, Switzerland), Venthera (Palo Alto, CA, United States), Olema Pharmaceuticals (San Francisco, CA, United States) and Pharming (Leiden, The Netherlands). The other authors declare no competing interests.

Figures

Fig. 1
Fig. 1. PIK3CA mutant clones in human esophageal epithelium.
a, Schematic representation of mutant clones in an average 1 cm2 of normal esophageal epithelium from a 48–51-year-old male donor from ref. . To generate the figure, a number of samples from the donor are randomly selected and the mutant clones detected are represented as circles and randomly distributed in space. b, The average VAF (top graph) and frequency (bottom graph) of missense mutations (MMs) detected more than once per gene, arranged from largest to smallest. PIK3CA highlighted in red. n = 844 samples from 9 donors. c, The distribution of PIK3CA MMs classified into pathogenic/gain of function (Path/GoF) or unknown/no effect (Unkn/NE) (Methods). VAF distribution of synonymous mutations in all genes is also shown. Medians (red) and quartiles (gray lines) are represented. Two-tailed Mann–Whitney test. n = 23, 26 and 603 mutant clones, respectively, from 9 donors. d, The frequency of MM codons in the p110α protein. Path/GoF mutations are shown in red. n = 41 mutant clones from 9 donors. e, A comparison of the VAF distribution of PIK3CAH1047R with other PIK3CA MMs classified as Path/GoF or Unkn/NE. Medians (red) and quartiles (gray lines) are represented. Two-tailed Mann–Whitney test. n = 8, 15 and 26 mutant clones, respectively, from 9 donors. Source data
Fig. 2
Fig. 2. Heterozygous Pik3caH1047R expression increases esophageal tumorigenesis.
a, Protocol 1: Cre-Pik3caH1047R-YFP/wt mice were induced one or three times with Cre-inducing drugs (Methods) and treated with DEN for 8 weeks starting 4 weeks post-induction. Uninduced mice were used as controls. Tissues were collected before exceeding the permitted humane endpoint or at 1 year after DEN. b, Typical DEN-treated esophagus opened and flattened epithelial side up showing four tumors (yellow arrows). Scale bar, 2 mm. c, The number of macroscopic esophageal tumors in DEN-treated mice, uninduced or induced one or three times before DEN treatment. Two-tailed Mann–Whitney test versus uninduced (n = 33, 35 and 23 animals, respectively). The red lines indicate average values. d, Protocol 2. Cre-Pik3caH1047R-YFP/wt mice were treated with DEN for 8 weeks followed by Cre induction. A subgroup of animals was then treated with the tumor promoter sorafenib (SOR) for 6 weeks. Tissues were collected before exceeding the permitted humane endpoint (Methods) or 1 year post-DEN treatment. Control groups received all treatments but were uninduced. e,f, The number (e) and size (f) of macroscopic esophageal tumors. Two-tailed Mann–Whitney test (n = 33, 13, 7 and 13 mice, as they appear in the graph). The red lines indicate average values. g, The frequency of MMs for the indicated driver genes detected in human ESCCs from data collected from the TCGA and ICGC databases. Esophageal cancer (EC) driver genes were selected using the Intogen tool (https://www.intogen.org/search). Only driver genes with MM frequency >2% are shown. Source data
Fig. 3
Fig. 3. A bias in Pik3caH1047/wt cell fate drives mutant clone growth.
a, Protocol: Cre-RYFP and Cre-Pik3caH1047R-YFP/wt mice were induced, and wild-type and mutant clones were imaged at the time points shown. b, Total (basal + first suprabasal layer cells; left) and basal (right) cells per clone over time. Only clones with at least one basal cell were included. The dot indicates the average size of clones in each mouse. The lines and shaded areas represent the best-fitting model of clone size distributions and plausible intervals (Supplementary Note). Lines, mean ± s.e.m. Two-tailed unpaired t-test versus wild type (WT) (mice and clone numbers per time point indicated in a). c, Representative top-down confocal images of basal layer of wild-type (top) and Pik3caH1047R/wt mutant (bottom) clones at indicated time points. Clones, green; DAPI, blue. Scale bars, 20 μm. d, Heatmaps of clone size frequency; the number of basal and first suprabasal cells is shown for Cre-RYFP and Cre-Pik3caH1047R-YFP/wt animals. The black dots and dashed lines show the geometric median clone size. The graphs in the bottom row show differences between Cre-Pik3caH1047R-YFP/wt and Cre-RYFP animals for each time point. Two-tailed 2D Kolmogorov–Smirnov test. e,f, Confocal image (e) and quantifications (f) of EdU+ cells (red) in wild-type or Pik3caH1047R-/wt mutant areas (green) from the basal layer of Cre-Pik3caH1047R-YFP/wt esophagus, 3 months post-induction. EdU was injected 1 h before tissue collection. DAPI is blue. Scale bar, 20 μm. Each dot corresponds to an animal, two-tailed ratio paired t-test (52,898 cells from 3 animals, including 3,514 Pik3caH1047R/wt cells). The bars indicate mean ± s.d. g,h, The proportion of suprabasal cells (g) and clones with no basal cells (h) in wild-type (Cre-YFP) or Pik3caH1047R/wt mutant clones at the indicated time points post-induction, from data in d. Each dot corresponds to one animal; the lines connect mean values. Two tailed unpaired t-test. i, Schematic illustration of WT and Pik3caH1047R/wt cell behavior in esophageal epithelium. Model predictions for the proportions of cell division outcomes for each genotype. Pik3caH1047R/wt cells produce an excess of progenitor over differentiating cells per average cell division, driving clonal expansion even with the rate of mutant cell division being the same as WT cells. Source data
Fig. 4
Fig. 4. Differential PI3K pathway activation modulates the competitive advantage of Pik3caH1047R/wt cells.
a, Protocol: Rosa26flYFP/flYFP (WT-RYFP) or Pik3caH1047R/wt (Pik3camut) cells were mixed with uninduced Pik3cawt/wt cells (Pik3cawt), from the same animal, cultured at confluence and analyzed at 14 and 28 days (Extended Data Fig. 4c). b, A typical confocal basal layer section of mixed culture. WT-RYFP cells, yellow; DAPI, blue. Scale bar, 20 μm. c, Proportion of WT-RYFP cells versus t = 0. d, The suprabasal:basal cell ratio at 14 days. +INS, treated with 5 μg ml−1 insulin. In c and d, n = 10–11 cultures from individual animals per condition. Two-tailed unpaired t-test. Mean ± s.d. e, Uninduced or induced cells were cultured overnight in starvation medium (STV) and then cultured for 1 h in STV, or STV plus LY294002 50 µM, or STV with insulin 5 µg ml−1, then lysed. Western blots for P-AKT(S473), P-AKT(T), AKT, P-GSK3β, GSK3β, P-S6, S6 and α-tubulin are shown, representative of three biological replicates. f, M, log ratio and A, mean average (MA) plots of RNA sequencing (RNA-seq) of induced Pik3caH1047R/wt and uninduced Pik3cawt/wt (WT) cultures comparing CTL and +INS treatments; red, differentially expressed transcripts (Wald test corrected for multiple testing, adjusted P < 0.05). g, Venn diagram of genes upregulated in Pik3caH1047R/wt cells also upregulated by insulin treatment of wild-type cells. h, A representative basal layer section of WT and Pik3caH1047R/wt mixed cultures after 28 days +INS or CTL. WT-RYFP cells, yellow; DAPI, blue. Scale bar, 20 μm. i, The proportion of WT-RYFP cells in mixed culture with Pik3caH1047R/wt cells, versus t = 0. +INS, treatment with 5 μg ml−1 insulin. Each dot represents a primary culture from an animal, lines connect means. n = 10–11 cultures from individual animals. Two-tailed paired t-test. j, The proportion of WT-RYFP cells mixed with Pik3caH1047R/wt cells, versus t = 0. Cells treated either in minimal medium or 0.5 µM LY294002. Each dot represents a primary culture from an animal; the lines connect means. n = 4–16 primary cultures from individual animals, per condition. Two-tailed paired t-test. k, Cell competition and PI3K activation. Increased PI3K pathway activity gives Pik3caH1047R/wt cells a competitive advantage over wild-type cells at physiological insulin levels. Leveling-up or leveling-down PI3K activity between Pik3caH1047R/wt mutant and wild-type cells with supraphysiological insulin (high INS) or PI3K inhibitor, respectively, reduces mutant competitive advantage. Source data
Fig. 5
Fig. 5. CRISPR screen of genes regulating wild-type and mutant fitness.
a, Protocol: primary cultures from Pik3caH1047R/wt Rosa26Cas9/wt mice were induced (Pik3camut/wt) or uninduced (wild type, WT) and infected with a lentiviral gRNA library targeting PI3K–mTOR-related genes. The 0-week time point was assessed, and the remaining cells were cultured in minimal medium (CTL) or minimal medium with 5 μg ml−1 insulin (INS) for 3 weeks. The relative abundance of gRNA between the 3- and 0-week time points is expressed as log2(fold change) (LFC). The volcano plot shows the enrichment score and log2(fold change) of genes screened in WT cells in CTL medium. Significantly depleted or enriched gRNAs (false discovery rate (FDR) <0.1 and >10% fold change) are blue or orange, respectively, and unchanged gRNAs are gray. n = 2 biological replicates, 10 gRNA per gene. b, CRISPR screening results in WT (left) or Pik3caH1047R/wt (right) in CTL medium showing PI3K pathway and downstream genes including transcription factors (TF). Bold red: gRNAs that are significantly enriched or depleted (FDR <0.1 and >10% fold change difference). Pathway activation and inhibition is indicated by green and red arrows, respectively. The yellow boxes indicate the enzyme isoform most expressed in esophageal primary cells. ce, Plots showing the correlation between average log2(fold change) of gRNA targeting indicated genes in the following cells and conditions: Pik3caH1047R/wt cells (y axis) versus WT cells (x axis) in control (CTL) condition (the panels indicate gene sets of PI3K pathway genes (top) and mTOR pathway genes (bottom)) (c); WT cells in CTL (x axis) versus INS (y axis) conditions (the panels indicate gene sets corresponding to PI3K pathway genes (left) and mTOR pathway genes (right)) (d); INS condition comparing Pik3caH1047R/wt cells (y axis) versus WT cells (x axis) (the panels indicate gene sets corresponding to PI3K pathway genes (left) and mTOR pathway genes (right)) (e). In ce, the yellow and green areas of each graph indicate the higher absolute log2(fold change) in x-axis or y-axis condition, respectively. Linear regression (black) with slope and coefficient of determination R2. Identity line, orange. The error bars indicate the s.d. of n = 2–3 screen replicates. Source data
Fig. 6
Fig. 6. Metabolic conditions alter Pik3caH1047R/wt competitive advantage.
a, Protocol: Cre-RYFP control and Cre-Pik3caH1047R-YFP/wt mice were induced and treated with/without metformin (MET). Clones with at least one basal cell were analyzed at 28 days. b, Left and middle: heatmaps showing the frequency of basal and first suprabasal layer cells in clones; dots and dashed lines indicate geometric median clone size. Right: heatmaps showing differences between treatment and control in Cre-RYFP (top) or Cre-Pik3caH1047R-YFP/wt (bottom) animals. Two-tailed 2D Kolmogorov–Smirnov test. c, Average basal clone sizes for each strain and treatment. The bars are mean ± s.d. Two-tailed unpaired t-test. n = 431–917 clones from 5–10 animals per condition. d, Protocol: Cre-RYFP and Cre-Pik3caH1047R-YFP/wt mice in Akitawt (control) or AkitaHet (diabetic) backgrounds were induced after diabetes development in AkitaHet animals and tissues collected 28 days post-induction. e, Left and middle: heatmaps showing the frequency of basal and first suprabasal in clones from d. The dots and dashed lines indicate geometric median. Right: heatmaps showing the differences between each treatment and control in Cre-RYFP (top) or Cre-Pik3caH1047R-YFP/wt (bottom) mice. n = 518–589 clones from 4–8 animals per condition. Two-tailed 2D Kolmogorov–Smirnov test. f, Average basal clone sizes for each strain and treatment from d. The dots indicate the average clone size of a mouse. The bars indicate the s.d. (n = 4–8 mice). Two-tailed unpaired t-test. g, Protocol: Cre-RYFP and Cre-Pik3caH1047R-YFP/wt mice were induced, fed a chow or HFD, and tissues collected 28 days post-induction. h, Left and middle: heatmaps of frequency of basal and first suprabasal layer cells in clones from g. The dots and dashed lines indicate geometric median clone size. Right: heatmaps showing differences between treatment and control in Cre-RYFP (top) or Cre-Pik3caH1047R-YFP/wt (bottom) animals. n = 472–914 clones from 5–9 animals per condition. Two-tailed 2D Kolmogorov–Smirnov test. i, Average basal clone sizes for each strain and treatment from g. The dots indicate the average clone size of a mouse. The bars are s.d. (n = 5–9 mice). Two-tailed unpaired t-test. j, The effects of MET, Akita and HFD on mutant cell advantage. In a control situation, mutant clones show advantage that is reduced by MET treatment and increased in AkitaHet background or under HFD. Source data
Fig. 7
Fig. 7. Higher density of Pik3ca MMs in overweight humans.
Human donors were classified into overweight, OW–OB (n = 10, BMI ≥25 kg m−2) and non-OW (n = 8, BMI <25 kg m−2). PIK3CA MMs were classified as Path/GoF and Unkn/NE (Methods) and analyzed separately in OW–OB and non-OW donors. a, The number of clones per centimeter squared carrying PIK3CA MM Path/GoF (top) or Unkn/NE (bottom) plotted against donor age. Each dot represents a donor. Simple linear regression for OW–OB and non-OW donors is shown. Tukey’s test. b, Representative patchwork plots. Each panel is a representation of PIK3CA mutant clones in an average 8 cm2 area of esophagus from non-OW (top) or OW-OB (bottom) donors. To generate each figure, a sample of biopsies from all donors >60 years of age was randomly selected from each weight category amounting to 8 cm2 of tissue. All PIK3CA mutant clones are represented as circles and randomly distributed in space. Source data
Fig. 8
Fig. 8. Interventions that alter the competitive fitness of oncogenic PIK3CA mutant clones.
Top: overactivation of the PI3K–mTOR pathway increases the competitive fitness of Pik3caH1047R/wt mutant over wild-type cells, by reducing mutant cell differentiation, which drives clonal expansion. Middle: interventions that level out the differential activation of the PI3K–mTOR axis and cell fitness between wild-type and mutant cells neutralize the competitive advantage of the mutants. Bottom: on the contrary, metabolic conditions such as type 1 diabetes and overweight would further increase the cellular differences in the PI3K–mTOR axis between both cell types, resulting in a further increase in the competitive fitness of the mutant over wild-type cells.
Extended Data Fig. 1
Extended Data Fig. 1. Generation of mice expressing a Pik3caH1047Rmutation.
a, Schematic of the conditional targeted Pik3ca allele. Pik3ca exon 20 was flanked by loxP sites (triangles). The duplicate region of exon 20 encodes the H1047R mutation, a self-cleaving T2A peptide and an enhanced Yellow Fluorescent Protein (EYFP), followed by a nuclear localization signal (NLS). Wild-type p110α protein is expressed until Cre mediated recombination, after which the allele co-expresses p110αH1047R mutant protein and EYFP-NLS. Cre recombination was mediated by crossing the conditional mutant strain with AhCreERT mice which express the Cre recombinase upon induction with β-naphthoflavone (BNF) and tamoxifen (TAM). b, Typical top-down confocal image of esophageal epithelial whole-mount from an AhcreERTPik3caH1047R/wt mouse, 3 months post-induction. Optical section through basal cell layer is shown. Pik3caH1047R/wt clones, showing nuclear EYFP (green) indicated by white arrows. Nuclei are stained with DAPI (blue). Clones are delimited by dashed white lines. Scale bar, 20 μm. c, Immunoblots of protein expression of p110α, GFP and AKT (total and, phosphorylated Ser473 (top) or Thr308 (bottom)) in NIH3T3 cells transfected with empty vector, or vector carrying wild-type p110α, p110αH1047R or p110αH1047R -P2A-GFP. Cells were starved for 24 h and lysed. Images are representative of 3 separate experiments. d-f, Signaling in induced mutant cells. Protocol (d): primary esophageal keratinocytes from Pik3caH1047R/wt mice were infected either with null-adenovirus (uninduced Pik3cawt/wt controls) or Cre-adenovirus (induced Pik3caH1047R/wt). Cells were treated in medium containing either 0.1% serum and no added growth factors (Starved, STV), 20% serum and growth factors (FCS) or FCS and the PI3K inhibitor LY294002 (50 µM), lysed and the pAKT(Ser473)/Total-AKT (e) and p-PRAS40/Total-PRAS40 (f) analyzed by immune capillary electrophoresis. Two-tailed ratio paired t-test. n = 4 paired (Ad-Null and Ad-Cre infected) biological replicates (mice) per condition (paired samples are linked by lines). Each dot is a biological replicate culture, lines link uninduced and induced cultures derived from the same mouse. Source data
Extended Data Fig. 2
Extended Data Fig. 2. Heterozygous Pik3caH1047Rexpression and mouse esophageal tumorigenesis.
a-c. Protocol (a) and survival (b) of AhCreERTRosa26flEYFP/wt (Cre-RYFP) and AhcreERTPik3caH1047R-YFP/wt (Cre-Pik3caH1047R-YFP/wt) mice induced and followed up to one-year post-induction. c Normal appearance of typical esophagi from a after longitudinal opening and flattening out. d-e, Carcinogenesis study. d. Protocol: Cre-Pik3caH1047R-YFP/wt mice were induced 1 or 3 times and treated with diethylnitrosamine (DEN) for 8 weeks starting 4 weeks post-induction. Uninduced mice were used as controls. Tissues were collected before exceeding the permitted humane endpoint or at 1 year after DEN. e. Survival curves of animals on protocol in d. Log-rank (Mantel-Cox) test. f-i, Pik3caH1047R-YFP/wt induced ESCC. Image in (f) shows unopened esophagus containing an ESCC (arrow) generated by DEN of an induced Cre-Pik3caH1047R-YFP/wt mouse. (g) Immunofluorescence of a section of the tumor in (f) showing DAPI (blue), Pik3caH1047R/wt (green) and Vimentin (red). Images in (h) and (i) depict Hematoxylin-Eosin staining of sections from the tumor in (f). Scale bars, 2 mm (f), 200 µm (g), 500 µm (h), 250 µm (i). Source data
Extended Data Fig. 3
Extended Data Fig. 3. Mechanism of Pik3caH1047R-YFP/wt clonal expansion.
a, Multicolor lineage tracing in Pik3caH1047R-YFP/wtRosa26confetti/wtAhCreERT (Cre-Pik3caH1047R-YFP/wt-Confetti) animals. After recombination, one of four reporters is expressed. In some clones the Pik3ca locus is also recombined. b, Possible color combinations following immunostaining for GFP to detect Pik3caH1047R-YFP/wt. Only RFP+ in wild-type or Pik3caH1047R/wt clones can be distinguished. c, Top-down confocal image of Cre-Pik3caH1047R-YFP/wt -Confetti epithelium 84 days post-induction, showing RFP+ Pik3cawt/wt and YFP+/RFP+ Pik3caH1047R/wt clone. DAPI is blue. Scale bar, 20 μm. d, Heatmaps of number of basal and first suprabasal layer cells in RFP+ clones in Cre-Pik3caH1047R-YFP/wt-Confetti animals. Black dots and dashed lines show geometric median. Number of clones analyzed is shown, animal numbers are in brackets. Lower panels, differences between Pik3cawt/wt and Pik3caH1047R/wt clones. Two-tailed 2D Kolmogorov-Smirnov test. e, Average basal cells per clone from d, in clones with >1 basal cell. Dots indicate the average clone size per mouse. Black lines indicate mean±s.e.m. Lines represent the best fitting model shown in Fig. 3, shaded areas plausible intervals. f, Basal cell density in Pik3caH1047R/wt mutant clones and size-equivalent wild-type areas in esophagus of Cre-Pik3caH1047R-YFP/wt mice, 6 months post-induction. Red lines, mean ± S.D. Two tailed unpaired t-test (n = 63 areas per group, from 5 animals). g, Confocal images showing Caspase 3 (red), Pik3caH1047R/wt cells, green, and DAPI, blue staining in basal layer of a Cre-Pik3caH1047R-YFP/wt mouse, 1-month post-high dose induction (Methods). Images representative of 4 mice. Left panel, UV irradiated positive control sample. The middle and right panels are images from the same tissue showing apoptotic cell (red arrow) and Pik3caH1047R/wt clone (green arrow). Scale bars, 20 μm. Architecture h and dynamics i of mouse esophageal epithelium. h, The lowest basal layer contains proliferating progenitor cells and post-mitotic differentiating cells, which will migrate upwards through the suprabasal layers until they are shed. i, Progenitor divisions may generate two differentiating cells, two progenitor cells or one of each type. The probabilities of each outcome are balanced, producing equal numbers of progenitor and differentiating cells across the epithelium, maintaining tissue homeostasis. Tilting cell fate towards proliferation, produces excess mutant progenitors resulting in clone growth. Source data
Extended Data Fig. 4
Extended Data Fig. 4. Mutant versus wild-type cell competition in culture.
a-b, Generation of induced WT-RYFP (a) and uninduced/induced Pik3caH1047R/wt (b) epithelioid cultures. Primary esophageal keratinocytes from uninduced Rosa26RYFP/RYFP (a) or uninduced Pik3caH1047R-YFP/wt animals (b) were incubated with Cre-expressing adenovirus (Ad-Cre) or null adenovirus (Ad-Null). Right panels, representative images of Ad-Cre or Ad-Null treated cultures stained for YFP (yellow) and DAPI (nuclei, blue). Scale bars, 20 μm. c, In vitro cell competition protocol. Pik3caH1047R/wt and Pik3cawt/wt keratinocytes from b, are mixed with WT-RYFP cells from a, and maintained at confluence. Proportion of WT-RYFP cells is quantified by flow cytometry, gating strategy is shown. The proportion of WT-RYFP cells after treatment was normalized to the initial WT-RYFP cell proportion. Scale bars, 20 μm. d, GSEA histograms of PI3K/Akt/mTOR (top) and mTOR signaling (bottom) Hallmark gene sets comparing RNA-seq data from control (CTL) and 5 μg/ml insulin (+INS) treated wild-type cells from the same animals. The nominal p-value, the normalized enrichment score (NES) and the false discovery rate (FDR) q-value are indicated. n = 4 independent replicates per condition from one animal each. e-g, Experimental scheme (top panel) and quantification by flow cytometry (bottom panel) of the proportion of WT-RYFP cells mixed with Pik3caH1047R/wt cells at the end of the experiment versus the start of each experiment. e, Cells were treated either in minimal FAD medium or treated with 10 ng/ml EGF, 2 ng/ml Insulin (physiological) or 5 μg/ml Insulin (supraphysiological) for one month. Each dot represents a biological replicate (n = 4-16 primary cultures from individual animals, per condition). f, Cells were cultured for 28 days in minimal medium (CTL), 28 days in minimal medium with 5 μg/ml insulin (INS), or 14 days in minimal medium with 5 μg/ml insulin followed by 14 days in minimal medium. Each dot represents a biological replicate (n = 4 primary cultures from individual animals, per condition). g, Cells were treated either in minimal FAD medium minus/plus Rapamycin 500 nM for 14 days. Each dot represents a biological replicate (n = 4-8 primary cultures from different animals, per condition). Red lines indicate mean values. Two-tailed paired t-test. Source data
Extended Data Fig. 5
Extended Data Fig. 5. CRISPR screening of targets affecting mutant cell fitness.
a-b, CRISPR screening in uninduced (Pik3cawt/wt, WT) cells in minimal medium (CTL). a, Correlation between normalized read counts for the sequenced library and the average normalized read counts at Time 0. Orange line, linear regression between samples with the Pearson’s coefficient and two-tailed p-value of the correlation. b, Violin plots of distribution of average log2 fold change between Time 3 and Time 0 for each gRNA. n = 2 biological replicates, 10 gRNA per gene. c, Heatmaps of average log2 (fold change per gene of gRNA abundance after 3 weeks versus Time 0. Genes are grouped by pathway. Heatmaps show the enrichment of gRNAs targeting each gene at 3 weeks over 0 weeks in either minimal medium (CTL) or minimal medium supplemented with 5 μg/ml Insulin (INS), and either uninduced (WT) or induced (Pik3ca*/wt) cells from Rosa26Cas9/wt Pik3caH1047R/wt mice. Each column is a biological replicate. n = 2-3 biological replicates, 10 gRNA per gene. Source data
Extended Data Fig. 6
Extended Data Fig. 6. Pik3caH1047R/wt cells activate Hif1α pathway and glycolysis.
a-b, RNA-seq analysis comparing Pik3cawt/wt (WT, uninduced) and Pik3caH1047R/wt mutant cultures from the same animal, in minimal medium. Heatmap shows altered transcripts (adjusted p < 0.05). n = 4 mice per group, paired induced-uninduced samples. Wald test corrected for multiple testing. c-f, Gene set enrichment analysis histograms of PI3K/Akt/mTOR (c), mTOR (d) Hypoxia (e) and myc targets (f) signaling Hallmark gene sets in WT and mutant cultures. Nominal p-value, normalized enrichment score (NES) and false discovery rate (FDR) q-value are indicated. g, KEGG pathway enrichment analysis for up-regulated genes in mutant vs WT (p-value adjusted for multiple hypotheses testing using the Benjamini-Hochberg method<0.01). Intensity indicates pathway enrichment. h, Proportion of HIF1α target genes significantly up-regulated (adjusted p-value (as in g)<0.01) in mutant vs WT. i, Transcripts per million (TPM) relative to WT CTL condition of Hif1a and Vegfa in Pik3cawt/wt and Pik3caH1047R/wt cells in control (CTL) versus cultures treated with 5 μg/ml insulin (INS). n = 4 biological replicates per condition. Red lines, median values. Wald test corrected for multiple testing. j, Uninduced (Pik3cawt/wt) and induced (Pik3caH1047R/wt) cells were cultured in starvation media (STV) +/− PI3K inhibitor LY294002 (0.5 µM), and HIF1α/α-Tubulin analyzed by immune capillary electrophoresis. HIF1α/α-Tubulin ratio versus the average of the WT STV shown. Two-tailed ratio paired t-test. n = 5 paired biological replicates per condition (lines link paired samples). k, GSEA histogram of Glycolysis Hallmark gene set comparing induced Pik3caH1047R/wt and WT cells in minimal medium. n = 4 biological replicates per condition. Statistics as in c-f. l, Heatmaps comparing WT and Pik3caH1047R/wt cultures in CTL and INS conditions. Two-tailed Wald test corrected for multiple testing comparing WT and Pik3caH1047R/wt CTL conditions. ***p < 0.001, n.s.= not significant. m, GSEA histograms of Glycolysis Hallmark set comparing control (CTL) and 5 μg/ml insulin (+INS) treated wild-type cells. n = 4 biological replicates per condition. Statistics as in c-f. n, Basal OCR to ECAR ratios of WT and Pik3caH1047R/wt cultures in CTL or INS conditions. Dots, average per animal (n = 4 mice). OCR/ECAR ratios are mean ± SD. Two-tailed paired t-test. Source data
Extended Data Fig. 7
Extended Data Fig. 7. Fitness of Pik3caH1047R/wt cells depends on Hif1α.
a-d, Protocol (a): Pik3cawt/wt (wild-type) or Pik3caH1047R/wt mutant cells expressing shRNA against Hif1a (shHif1a) or control shRNA (shNT) were mixed with WT-RYFP and cultured for 28 days in minimal medium. b, Hif1α mRNA levels in shHif1a or shNT cells. Each dot is a culture from a different mouse (n = 4 mice). Red lines, median values. Two tailed paired t-test. c, Representative confocal images showing basal layer of an epithelioid culture generated as in a. n = 3 biological replicates. WT-RYFP cells, yellow, DAPI, blue. Scale bar, 20 μm. d, Proportion of WT-RYFP cells at 28 days versus day 0. Each dot is a culture from a different animal. n = 3-7 cultures per condition. Two-tailed paired t-test. e-f, In vitro cell competition of WT-RYFP mixed with Pik3caH1047R/wt cells or uninduced controls from the same mice. Cultures were then treated with HIF1α inhibitor PX-478 (10 µM) or vehicle for 28 days. (f). Each dot is mean of a culture from a different animal (n = 5-11). Bars are SD. Two tailed unpaired t-test. Source data
Extended Data Fig. 8
Extended Data Fig. 8. Metabolic changes downstream of Pik3caH1047R/wt expression.
a-b, Proportion of WT-RYFP cells in mixed cultures with Pik3caH1047R/wt cells, after 15 days in minimal media normalized to baseline value. +/–Gluc indicates culture with/without glucose and 2-DG indicates culture with 5 mM 2-deoxyglucose. Each dot is a culture from a different animal, lines are mean values. n = 4 cultures per condition. c-e, In vitro cell competition assay. c, Protocol: Confluent mixed cultures of WT-RYFP and induced Pik3caH1047R/wt cells with/without DCA 25 mM for 28 days in minimal medium. d, Representative confocal images of basal cell layer of cultures from c, WT-RYFP cells, yellow, DAPI, blue. Scale bar, 20 μm. e, Flow cytometric analysis from mixed cultures in c. Each dot is a culture from a different mouse and lines connect mean values (n = 7-15 cultures). Two-tailed paired t-test. f, Protocol: Cre-RYFP control and Cre-Pik3caH1047R-YFP/wt mice were induced and treated with DCA. Clones with >1 basal cell sizes were analyzed at 28 days. Mice and clone numbers are shown. g, Heatmaps showing the differences between each treatment versus control in Cre-RYFP (upper panels) or Cre-Pik3caH1047R-YFP/wt (lower panels) mice from f. Two-tailed 2D Kolmogorov-Smirnov test. h-i, Average basal clone sizes h and proportion of first suprabasal layer cells i for each strain and treatment from f. Data includes clones with at least one basal cell. Bars are SD. Two-tailed unpaired t-test. j, Wild-type and Pik3caH1047R mutant basal cell clone size distributions from untreated or DCA-treated Cre-RYFP and Cre-Pik3caH1047R-YFP/wt mice, respectively, 28 days post- induction. n = 311-799 clones from 5-8 animals per condition. Dots indicate mean and lines standard deviation. Two-tailed Kolmogorov-Smirnov test and Contrast ART-C Post-hoc test of differences of differences between distributions. k. Proportion of WT-RYFP cells in mixed cultures with Pik3caH1047R/wt cells, at 15 days normalized to baseline value. Cells were culture in minimal media (CTL) or with Betulin (6 µg/ml), CB839 (10 µM), TOFA (30 µM) or TVB-2640 (0.1 µM). Each dot represents a culture from a different animal, lines correspond to mean values. n = 4 cultures from individual animals per condition. Two tailed paired t-test. Source data
Extended Data Fig. 9
Extended Data Fig. 9. Metabolic conditions alter the Pik3caH1047R/wt fitness in vivo.
a-b, Cre-RYFP and Cre-Pik3caH1047R-YFP/wt mice were induced and treated with or without metformin (MET). First suprabasal layer cells per clone (a) and basal clone size distributions (b) analyzed at 28 days. Dots indicate mean and lines S.D. in b. Two-tailed unpaired t-test for suprabasal cells per clone. Two-tailed Kolmogorov-Smirnov test to compare wild-type and mutant basal clone distributions. Contrast ART-C Post-hoc test of differences of differences between distributions. n = 431-917 clones from 5-10 animals per condition. c, Lactate secretion in wild-type cells in minimal medium in control conditions (CTL) or with 2.5 mM MET. Bars indicate mean. Two-tailed paired t-test. d-f, In vitro competition assay. d, Protocol: Confluent cultures of WT-RYFP and Pik3caH1047R/wt cells in minimal medium with/without MET for 28 days. e, Representative confocal image of basal layer of culture from d. WT-RYFP cells, yellow, DAPI, blue. Scale bar, 20 μm. f, Flow cytometric analysis of cultures in d. Each dot represents a biological replicate, lines connect mean values (n = 3–12). Two-tailed paired t-test. g, Urine glucose levels in mice from Fig. 6d. Two-tailed Mann-Whitney test. n = 4 mice per group. Mean ± SD. h, Basal cells per clone in Fig. 6d. Dots and bars indicate mean and S.D. Two-tailed Kolmogorov-Smirnov and Contrast ART-C Post-hoc tests. i, Average proportion of suprabasal cells per clone for each strain and treatment from Fig. 6d, only the first suprabasal cell layer was counted. Each dot corresponds to one animal. Bars are mean ± SD. n = 431-917 clones from 5-10 animals per condition. Two-tailed unpaired t-test. j, Body weight measured at weeks 0 and 4 post diets. Each dot corresponds to one animal, lines link weights from same animal (n = 10-16 mice). Two-tailed paired t-test. k, Blood insulin levels at the end of experiment in j. Error bars are mean±s.e.m. Two-tailed unpaired t-test. l, Average proportion of suprabasal cells per clone for each strain and treatment from Fig. 6g, only first suprabasal cells were counted. Each dot corresponds to one animal. Bars are mean ± S.D. Two-tailed unpaired t-test. m, Distribution of basal cells per clone from Fig. 6g. Dots and bars indicate mean and S.D. Two-tailed Kolmogorov-Smirnov and Contrast ART-C Post-hoc tests. Source data
Extended Data Fig. 10
Extended Data Fig. 10. Higher density of Pik3ca missense mutations in overweight humans.
a, Age distribution of all human donors, including donors from Fig. 1. Lines are mean±s.e.m. Two-tailed unpaired t-test. b-d, Human donors were classified into OW-OB (n = 10, BMI ≥ 25 kg m2) and non-OW (n = 8, BMI < 25 kg m2). PIK3CA missense mutations (MM) were classified as Path/GoF and Unkn/NE (see Methods) and analyzed separately in OW-OB and Non-OW groups. Each dot represents a donor. b, Number of PIK3CA missense mutant clones detected/cm2 in the specified groups. Bars are mean±s.e.m. Two-tailed unpaired t-test. c, Summed variant allele frequency (VAF) of all Path/GoF or Unkn/NE PIK3CA missense mutations per cm2 for each donor. Lines are mean±s.e.m. Two-tailed Mann-Whitney test. d, Number of clones/cm2 carrying Path/GoF PIK3CA missense mutations in each p110α domain. Bars are mean±s.e.m. Two-tailed Mann-Whitney test. Source data

References

    1. Martincorena, I. et al. Somatic mutant clones colonize the human esophagus with age. Science362, 911–917 (2018). - PMC - PubMed
    1. Martincorena, I. et al. Tumor evolution. High burden and pervasive positive selection of somatic mutations in normal human skin. Science348, 880–886 (2015). - PMC - PubMed
    1. Blokzijl, F. et al. Tissue-specific mutation accumulation in human adult stem cells during life. Nature538, 260–264 (2016). - PMC - PubMed
    1. Yokoyama, A. et al. Age-related remodelling of oesophageal epithelia by mutated cancer drivers. Nature565, 312–317 (2019). - PubMed
    1. Lee-Six, H. et al. Population dynamics of normal human blood inferred from somatic mutations. Nature561, 473–478 (2018). - PMC - PubMed