. 2024 Aug 21;25(1):136.
doi: 10.1186/s10194-024-01837-9.

Brain-wide mapping of c-Fos expression in nitroglycerin-induced models of migraine

Affiliations

Brain-wide mapping of c-Fos expression in nitroglycerin-induced models of migraine

Shaobo Xiao et al. J Headache Pain. .

Abstract

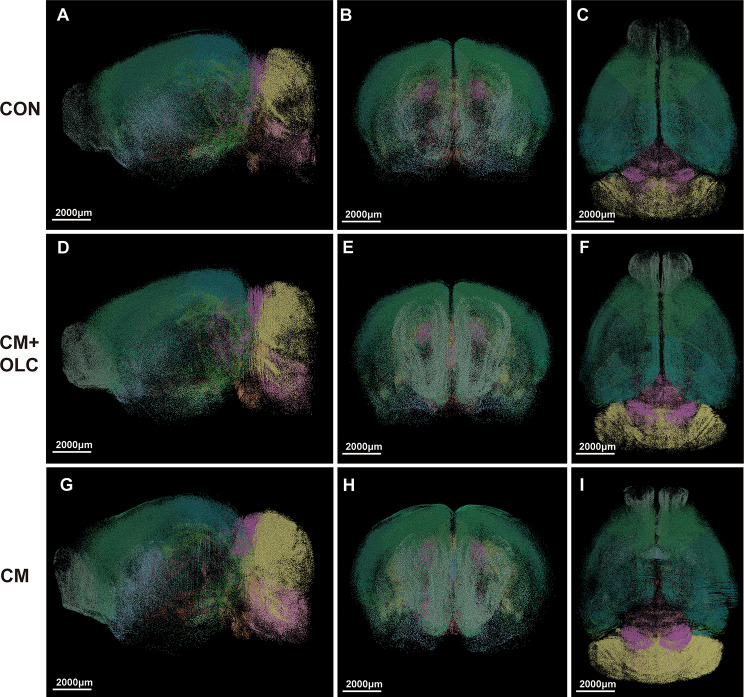
Background: Migraine is a neurological disorder characterized by complex, widespread, and sudden attacks with an unclear pathogenesis, particularly in chronic migraine (CM). Specific brain regions, including the insula, amygdala, thalamus, and cingulate, medial prefrontal, and anterior cingulate cortex, are commonly activated by pain stimuli in patients with CM and animal models. This study employs fluorescence microscopy optical sectioning tomography (fMOST) technology and AAV-PHP.eB whole-brain expression to map activation patterns of brain regions in CM mice, thus enhancing the understanding of CM pathogenesis and suggesting potential treatment targets.

Methods: By repeatedly administering nitroglycerin (NTG) to induce migraine-like pain in mice, a chronic migraine model (CMM) was established. Olcegepant (OLC) was then used as treatment and its effects on mechanical pain hypersensitivity and brain region activation were observed. All mice underwent mechanical withdrawal threshold, light-aversive, and elevated plus maze tests. Viral injections were administered to the mice one month prior to modelling, and brain samples were collected 2 h after the final NTG/vehicle control injection for whole-brain imaging using fMOST.

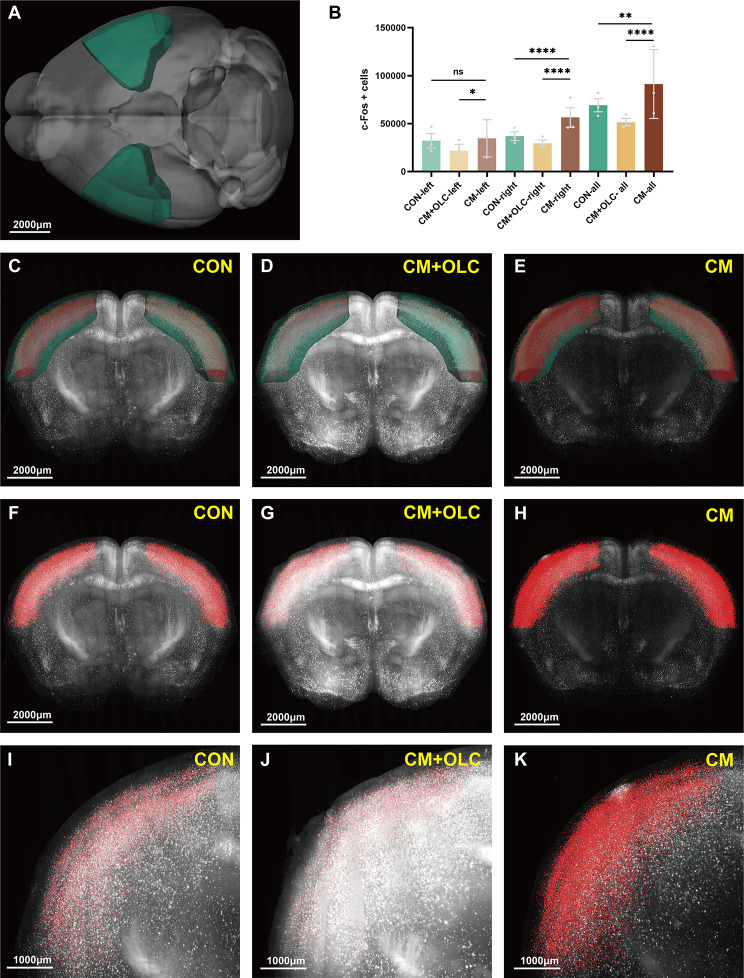
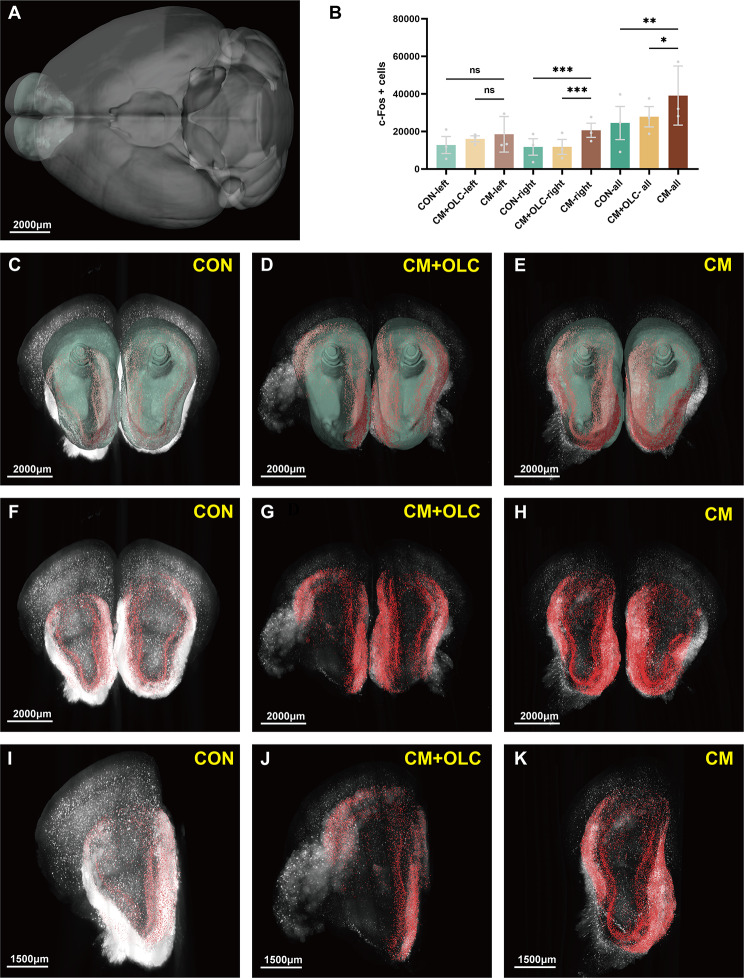
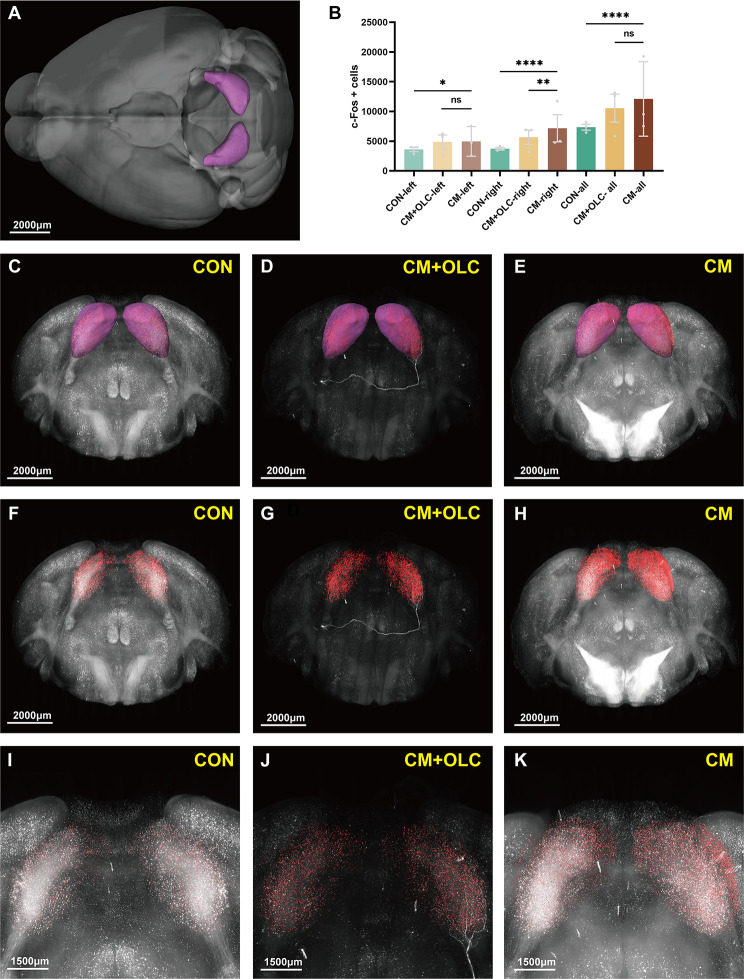
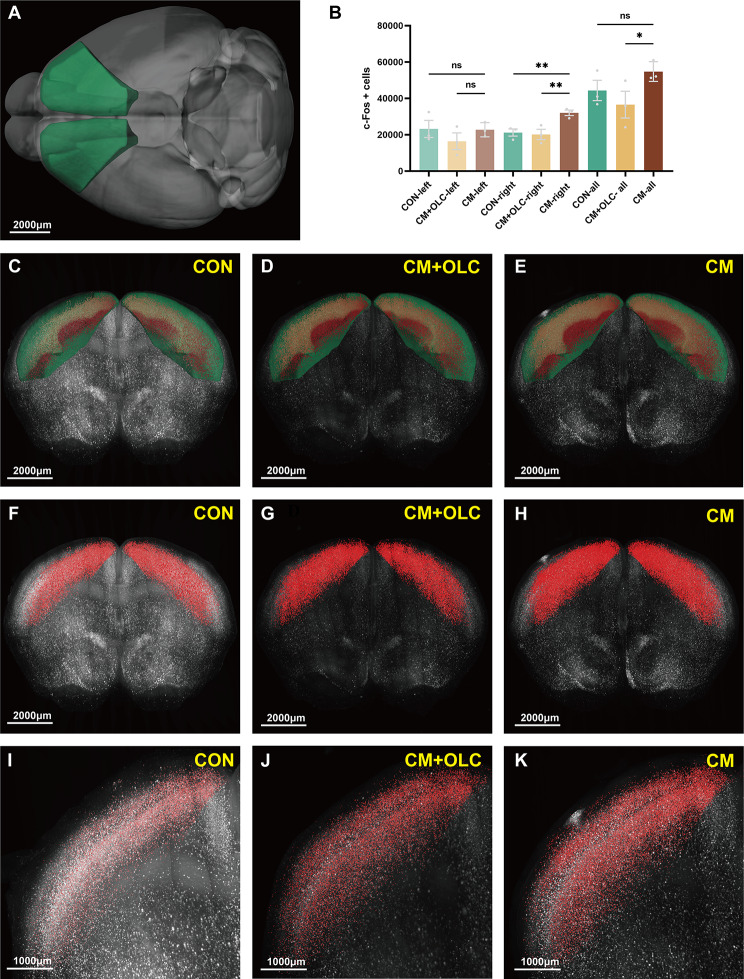
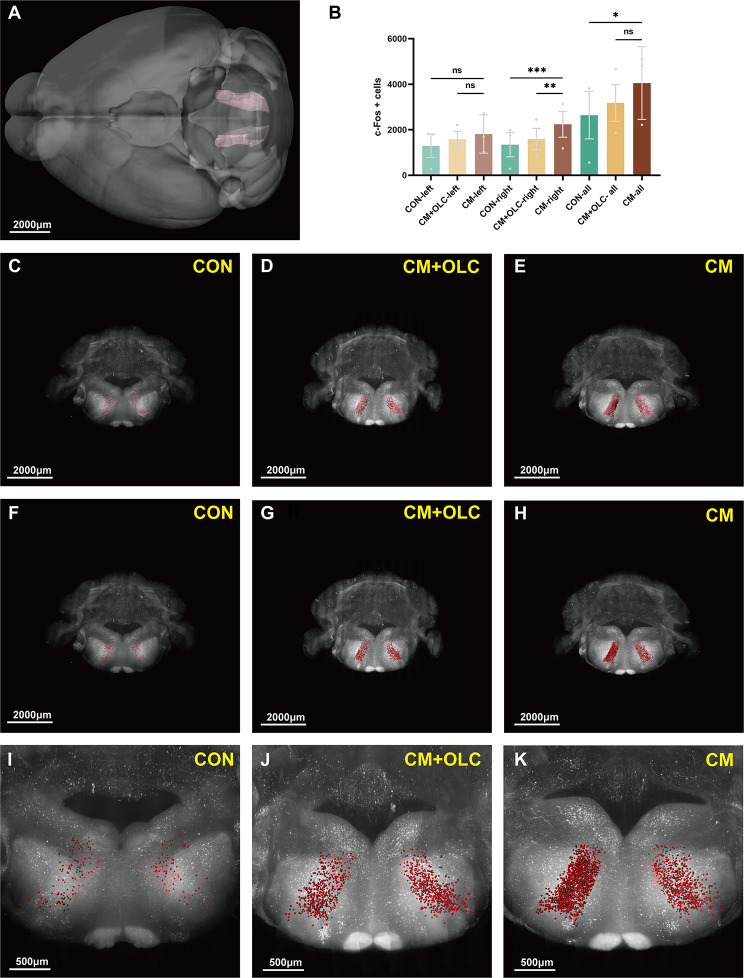
Results: In the NTG-induced CMM, mechanical pain threshold decreased, photophobia, and anxiety-like behavior were observed, and OLC was found to improve these manifestations. fMOST whole-brain imaging results suggest that the isocortex-cerebral cortex plate region, including somatomotor areas (MO), somatosensory areas (SS), and main olfactory bulb (MOB), appears to be the most sensitive area of activation in CM (P < 0.05). Other brain regions such as the inferior colliculus (IC) and intermediate reticular nucleus (IRN) were also exhibited significant activation (P < 0.05). The improvement in migraine-like symptoms observed with OLC treatment may be related to its effects on these brain regions, particularly SS, MO, ansiform lobule (AN), IC, spinal nucleus of the trigeminal, caudal part (Sp5c), IRN, and parvicellular reticular nucleus (PARN) (P < 0.05).

Conclusions: fMOST whole-brain imaging reveals c-Fos + cells in numerous brain regions. OLC improves migraine-like symptoms by modulating brain activity in some brain regions. This study demonstrates the activation of the specific brain areas in NTG-induced CMM and suggests some regions as a potential treatment mechanism according to OLC.

Keywords: C-fos; Calcitonin gene-related peptide; Chronic migraine; Fluorescence micro-optical sectioning tomography; Neural circuits; Olcegepant.


Conflict of interest statement

The authors declare no competing interests.

Figures

Fig. 1
Fig. 1
Experimental protocol and groups. (Created with BioRender.com)
Fig. 2
Fig. 2
Behavioral tests. A-C The basal mechanical pain thresholds of the hind paw and periorbital area during the injection of NTG. The data are presented as the mean ± SEM. Two-way repeated-measures ANOVA with post hoc comparison. (n = 10 per group, CM vs. CON, *p < 0.05, **p < 0.01, ***p < 0.001, ****p < 0.0001; CM vs. CM + OLC, #p < 0.05, ##p < 0.01, ###p < 0.001, ####p < 0.0001) D-I Elevated Plus Maze test. Time in open arms(F), time in closed arms(G), open arm entries(H), and closed arm entries(H) were counted. J-M Light‑aversive test. Time in light(K) and transitions(L) were analyzed statistically. The data are presented as the mean ± SEM. One-way ANOVA with the Bonferroni post hoc test. (n = 10 per group, ns: no significant difference, *p < 0.05, **p < 0.01, ***p < 0.001, ****p < 0.0001) (Created with BioRender.com)
Fig. 3
Fig. 3
The images of c-Fos mapping from a representative animal in each of the three groups (CON, CM + OLC, CM). (A, D, G) Sagittal plane; (B, E, H) Coronal plane; (C, F, I) Horizontal plane. Scale bar, 2000 μm
Fig. 4
Fig. 4
The top 25 brain regions with more than 2000 c-Fos + expressing cells in three groups. (A) CON group; (B) CM + OLC group; (C) CM group. Scale bar, 2000 μm. (n = 3)
Fig. 5
Fig. 5
The number of c-Fos + expressing cells in the somatosensory areas (SS). (A, C, D, E) SS was located at the isocortex. Green marks the SS according to Allen Mouse Brain Common Coordinate Framework V3. (B, F, G, H) The number of c-Fos + cells in the SS of the CM group was more than that of the CON group or the CM + OLC group. Red marks the c-Fos + cells. (I, J, K) The enlarged view from (F, G, H). Scale bar: (A–H) 2000 μm, (I, J, K) 1000 μm. Two-tailed unpaired Student’s t-test. Error bars indicate SEM. (n = 3 per group, *p < 0.05, **p < 0.01, ***p < 0.001, ****p < 0.0001)
Fig. 6
Fig. 6
The number of c-Fos + expressing cells in the main olfactory bulb (MOB). (A, C, D, E) MOB was located at the isocortex. Green marks the MOB according to Allen Mouse Brain Common Coordinate Framework V3. (B, F, G, H) The number of c-Fos + cells in the MOB of the CM group was more than that of the CON group or the CM + OLC group. Red marks the c-Fos + cells. (I, J, K) The enlarged view from (F, G, H). Scale bar: (A–H) 2000 μm, (I, J, K) 1500 μm. Two-tailed unpaired Student’s t-test. Error bars indicate SEM. (n = 3 per group, *p < 0.05, **p < 0.01, ***p < 0.001, ****p < 0.0001)
Fig. 7
Fig. 7
The number of c-Fos + expressing cells in the inferior colliculus (IC). (A, C, D, E) IC was located at the midbrain, sensory related (MB-sen). Pink marks the IC according to Allen Mouse Brain Common Coordinate Framework V3. (B, F, G, H) The number of c-Fos + cells in the IC of the CM group was more than that of the CON group or the CM + OLC group. Red marks the c-Fos + cells. (I, J, K) The enlarged view from (F, G, H). Scale bar: (A–H) 2000 μm, (I, J, K) 1500 μm. Two-tailed unpaired Student’s t-test. Error bars indicate SEM. (n = 3 per group, *p < 0.05, **p < 0.01, ***p < 0.001, ****p < 0.0001)
Fig. 8
Fig. 8
The number of c-Fos + expressing cells in the somatomotor area (MO). (A, C, D, E) MO was located at the isocortex. Green marks the MO according to Allen Mouse Brain Common Coordinate Framework V3. (B, F, G, H) The number of c-Fos + cells in the MO of the CM group was more than that of the CON group or the CM + OLC group. Red marks the c-Fos + cells. (I, J, K) The enlarged view from (F, G, H). Scale bar: (A–H) 2000 μm, (I, J, K) 1000 μm. Two-tailed unpaired Student’s t-test. Error bars indicate SEM. (n = 3 per group, *p < 0.05, **p < 0.01, ***p < 0.001, ****p < 0.0001)
Fig. 9
Fig. 9
The number of c-Fos + expressing cells in the intermediate reticular nucleus (IRN). (A, C, D, E) IRN was located at the medulla, motor related (MY-mot). Pink marks the IRN according to Allen Mouse Brain Common Coordinate Framework V3. (B, F, G, H) The number of c-Fos + cells in the IRN of the CM group was more than that of the CON group or the CM + OLC group. Red marks the c-Fos + cells. (I, J, K) The enlarged view from (F, G, H). Scale bar: (A–H) 2000 μm, (I, J, K) 500 μm. Two-tailed unpaired Student’s t-test. Error bars indicate SEM. (n = 3 per group, *p < 0.05, **p < 0.01, ***p < 0.001, ****p < 0.0001)

References

    1. Jensen R, Stovner LJ (2008) Epidemiology and comorbidity of headache. Lancet Neurol 7(4):354–361. 10.1016/S1474-4422(08)70062-0 - PubMed
    1. May A, Schulte LH (2016) Chronic migraine: risk factors, mechanisms and treatment. Nat Rev Neurol 12(8):455–464. 10.1038/nrneurol.2016.93 - PubMed
    1. Lee MJ, Park BY, Cho S, Kim ST, Park H, Chung CS (2019) Increased connectivity of pain matrix in chronic migraine: a resting-state functional MRI study. J Headache Pain 20(1):29. 10.1186/s10194-019-0986-z - PMC - PubMed
    1. Wu S, Ren X, Zhu C, Wang W, Zhang K, Li Z et al (2022) A c-Fos activation map in nitroglycerin/levcromakalim-induced models of migraine. J Headache Pain 23(1):128. 10.1186/s10194-022-01496-8 - PMC - PubMed
    1. Al-Karagholi MA, Ghanizada H, Nielsen CAW, Hougaard A, Ashina M (2021) Opening of ATP sensitive potassium channels causes migraine attacks with aura. Brain 144(8):2322–2332. 10.1093/brain/awab136 - PubMed

MeSH terms

LinkOut - more resources