

Novel metabolic and lipidomic biomarkers of sarcopenia
- PMID: 39169398
- PMCID: PMC11446726
- DOI: 10.1002/jcsm.13567
Novel metabolic and lipidomic biomarkers of sarcopenia
Abstract
Background: The pathophysiology of sarcopenia is complex and multifactorial and has not been fully elucidated. The impact of resistance training and nutritional support (RTNS) on metabolomics and lipodomics in older adults with sarcopenia remains uncertain. This study aimed to explore potential biomarkers of sarcopenia and clinical indicators of RTNS in older sarcopenic adults.
Methods: Older individuals diagnosed with sarcopenia through routine health checkups at a community hospital were recruited for a 12-week randomized controlled trial focusing on RTNS. Plasma metabolomic and lipidomic profiles of 45 patients with sarcopenia and 47 matched controls were analysed using 1H-nuclear magnetic resonance (1H-NMR) and liquid chromatography-mass spectrometer (LC-MS).
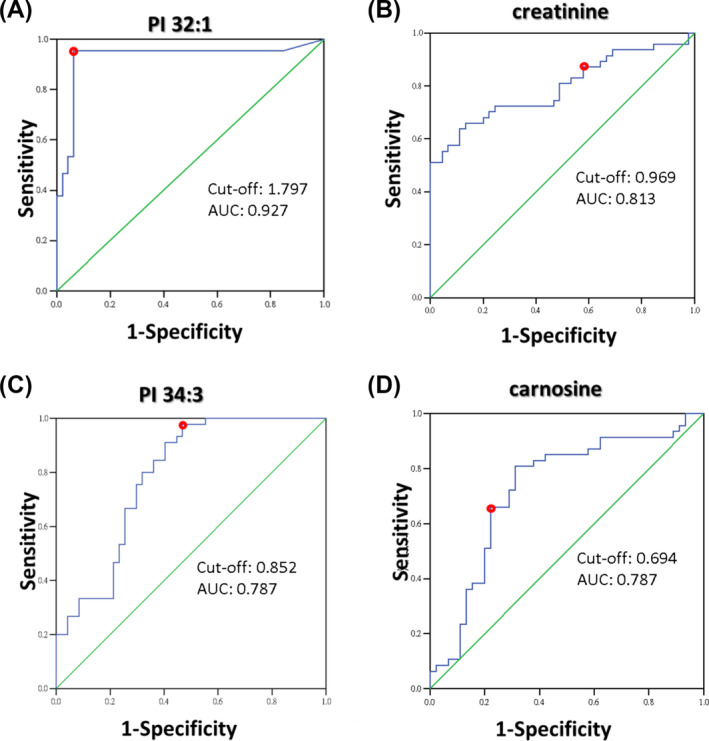
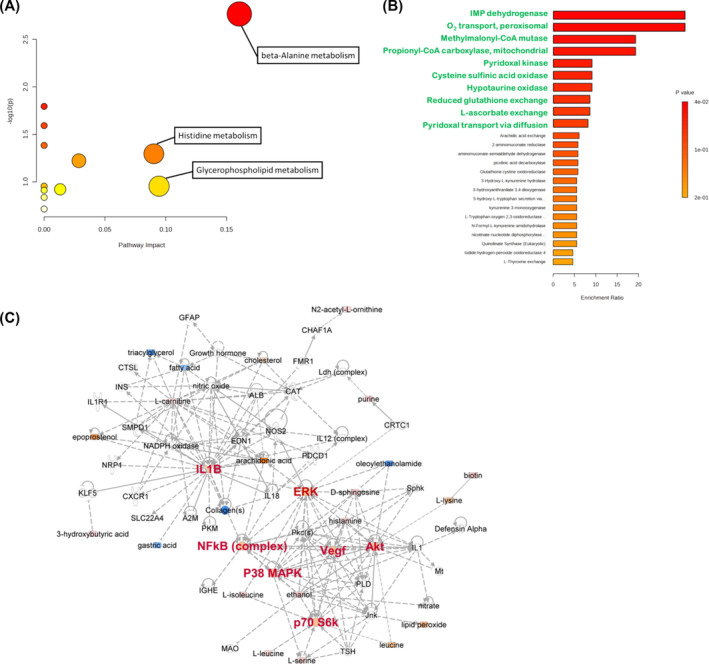
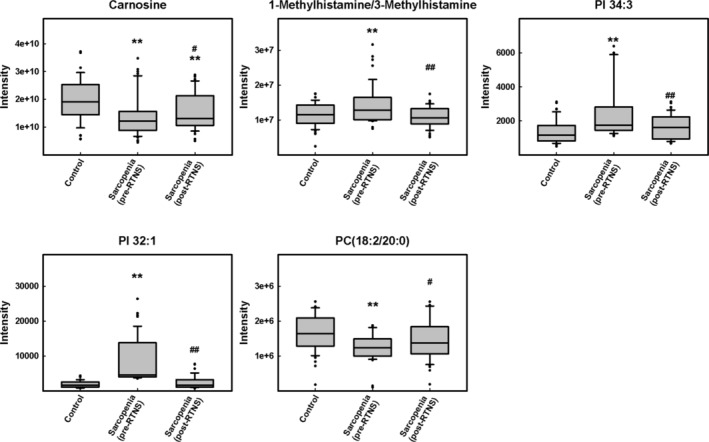
Results: At baseline, the patient and control groups had similar age, sex, and height distribution. The patient group had significantly lower weight, BMI, grip strength, gait speed, skeletal muscle index, lean mass of both the upper and lower limbs, and lower limb bone mass. There was a significant difference in 12 metabolites between the control and patient groups. They are isoleucine (patient/control fold change [FC] = 0.86 ± 0.04, P = 0.0005), carnitine (FC = 1.05 ± 0.01, P = 0.0110), 1-methylhistamine/3-methylhistamine (FC = 1.24 ± 0.14, P = 0.0039), creatinine (FC = 0.71 ± 0.04, P < 0.0001), carnosine (FC = 0.71 ± 0.04, P = 0.0007), ureidopropionic acid (FC = 0.61 ± 0.10, P = 0.0107), uric acid (FC = 0.88 ± 0.03, P = 0.0083), PC (18:2/20:0) (FC = 0.69 ± 0.03, P = 0.0010), PC (20:2/18:0) (FC = 0.70 ± 0.06, P = 0.0014), PC (18:1/20:1) (FC = 0.74 ± 0.05, P = 0.0015), PI 32:1 (FC = 4.72 ± 0.17, P = 0.0006), and PI 34:3 (FC = 1.88 ± 0.13, P = 0.0003). Among them, carnitine, 1-methylhistamine/3-methylhistamine, creatinine, ureidopropionic acid, uric acid, PI 32:1, and PI 34:3 were first identified. Notably, PI 32:1 had highest diagnostic accuracy (0.938) for sarcopenia. 1-Methylhistamine/3-methylhistamine, carnosine, PC (18:2/20:0), PI 32:1, and PI 34:3 levels were not different from the control group after RTNS. These metabolites are involved in amino acid metabolism, lipid metabolism, and the PI3K-AKT/mTOR signalling pathway through the ingenuity pathway analysis.
Conclusions: These findings provide information on metabolic changes, lipid perturbations, and the role of RTNS in patients with sarcopenia. They reveal new insights into its pathological mechanisms and potential therapies.
Keywords: Biomarker; Lipidome; Metabolome; Nutrition; Resistance training; Sarcopenia.
© 2024 The Author(s). Journal of Cachexia, Sarcopenia and Muscle published by Wiley Periodicals LLC.
Conflict of interest statement
The authors have disclosed no potential conflicts of interest.
Figures
References
-
- De Buyser SL, Petrovic M, Taes YE, Toye KR, Kaufman JM, Lapauw B, et al. Validation of the FNIH sarcopenia criteria and SOF frailty index as predictors of long‐term mortality in ambulatory older men. Age Ageing 2016;45:602–608. - PubMed
-
- Kim M, Kim H. Accuracy of segmental multi‐frequency bioelectrical impedance analysis for assessing whole‐body and appendicular fat mass and lean soft tissue mass in frail women aged 75 years and older. Eur J Clin Nutr 2013;67:395–400. - PubMed
MeSH terms
Substances
Grants and funding
- 108-2321-B-001-028-MY2/National Science and Technology Council of Taiwan
- 110-2314-B-002-060-MY3/National Science and Technology Council of Taiwan
- 111-2321-B-001-009/National Science and Technology Council of Taiwan
- 112-2321-B-001-009/National Science and Technology Council of Taiwan
- 112 T002/National Taiwan University Hospital Bei-Hu Branch
LinkOut - more resources
Full Text Sources
Research Materials
Miscellaneous
