. 2024 Nov 6;32(11):3879-3894.
doi: 10.1016/j.ymthe.2024.08.019. Epub 2024 Aug 22.

Targeting ROS-sensing Nrf2 potentiates anti-tumor immunity of intratumoral CD8+ T and CAR-T cells

Affiliations

Targeting ROS-sensing Nrf2 potentiates anti-tumor immunity of intratumoral CD8+ T and CAR-T cells

Yuna Jo et al. Mol Ther. .

Abstract

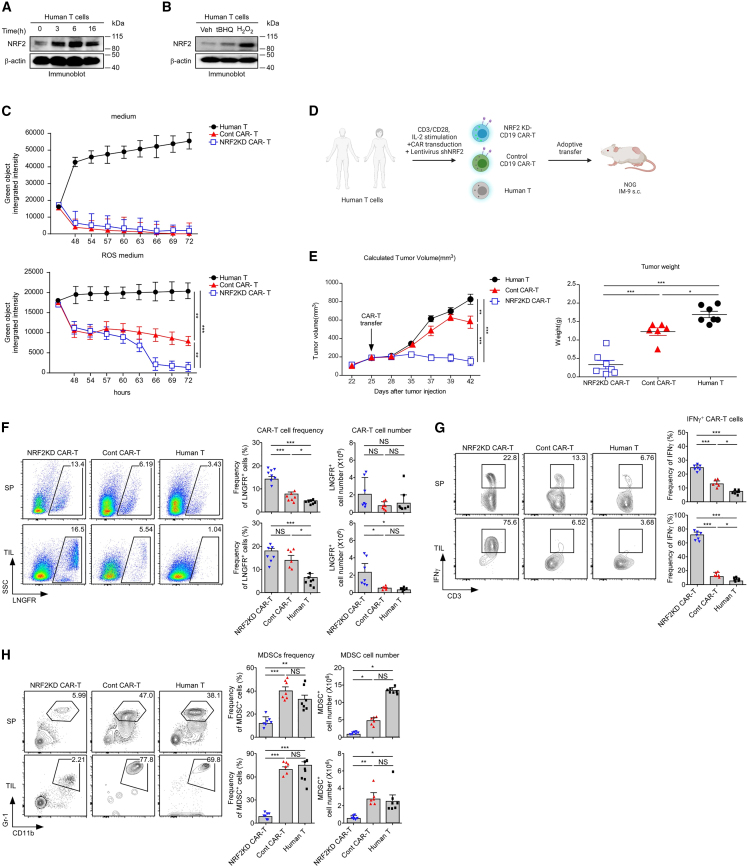
Cytotoxic T lymphocytes (CTLs) play a crucial role in cancer rejection. However, CTLs encounter dysfunction and exhaustion in the immunosuppressive tumor microenvironment (TME). Although the reactive oxygen species (ROS)-rich TME attenuates CTL function, the underlying molecular mechanism remains poorly understood. The nuclear factor erythroid 2-related 2 (Nrf2) is the ROS-responsible factor implicated in increasing susceptibility to cancer progression. Therefore, we examined how Nrf2 is involved in anti-tumor responses of CD8+ T and chimeric antigen receptor (CAR) T cells in the ROS-rich TME. Here, we demonstrated that tumor growth in Nrf2-/- mice was significantly controlled and was reversed by T cell depletion and further confirmed that Nrf2 deficiency in T cells promotes anti-tumor responses using an adoptive transfer model of antigen-specific CD8+ T cells. Nrf2-deficient CTLs are resistant to ROS, and their effector functions are sustained in the TME. Furthermore, Nrf2 knockdown in human CAR-T cells enhanced the survival and function of intratumoral CAR-T cells in a solid tumor xenograft model and effectively controlled tumor growth. ROS-sensing Nrf2 inhibits the anti-tumor T cell responses, indicating that Nrf2 may be a potential target for T cell immunotherapy strategies against solid tumors.

Keywords: CAR T cells; Nrf2; T cell immunotherapy; anti-tumor immune responses; reactive oxygen species; tumor microenvironment.


Conflict of interest statement

Declaration of interests C.H. received funding from NeoImmuneTech, Inc. D.C., S.-K.I., and B.H.L. are currently employed by NeoImmuneTech, Inc.

Figures

None
Graphical abstract
Figure 1
Figure 1
Nrf2 deficiency enhances anti-tumor activity in vivo (A) Nrf1, Nrf2, and Nrf3 mRNA expression in T cells, B cells, and DN cells in TILs and in draining lymph node T (dLN T) and LN T cells from tumor-bearing mice. WT LN T cells are included as a control. The results represent the summary of three independent experiments (n ≥ 4 mice/group). The fold change of mRNA expression is 2−ΔΔCt × 1,000 (ΔΔCt = ΔCt of the target gene − ΔCt of the reference gene). (B and C) Nrf2−/−, WT, and Nrf2Tg mice are injected s.c. with B16F10 melanoma cells (three independent experiments, n ≥ 4 mice/group), EL4 lymphoma cells (four independent experiments, n ≥ 4 mice/group), MC38 colon carcinoma cells (two independent experiments, n ≥ 4 mice/group), or TC-1 lung carcinoma cells (one independent experiments n ≥ 4 mice/group). (B) Tumor growth is monitored every 2–3 days. (C) Tumor weight is measured at the end of the experiments. (D) Tumor growth and weight comparison between Nrf2−/− and WT mice (n ≥ 4 mice/group) following s.c. injection of EL4 cells. Mice receive intraperitoneal injections of either α-CD3 (top) or α-B220 (bottom) antibodies or isotype control IgG once every 5 days. Results represent the summary of error of the mean of three independent experiments (∗p < 0.05, ∗∗p < 0.01, ∗∗∗p < 0.001, ∗∗∗∗p < 0.0001; NS, not significant). (E) RT-qPCR analysis of inflammatory cytokine genes in TIL T cells, dLN T cells, and LN T cells from the WT and Nrf2−/− mice injected s.c. with B16F10 cells (n = 14, mice/group). The expression of the target genes is normalized to that of Rpl13. Data show the means ± SEM of four independent experiments (∗p < 0.05, ∗∗p < 0.01, ∗∗∗p < 0.001, ∗∗∗∗p < 0.0001). (F) IFNγ and IL-17 expression in TIL T and dLN T cells from Nrf2−/−, WT, and Nrf2Tg tumor-bearing mice. TIL T and dLN T cells were stimulated with PMA/ionomycin and assessed for IFNγ and IL-17 expression by intracellular staining. The IFNγ vs. IL-17 profile is representative of five independent experiments (left). The bar graph represents the percentage of IFNγ-producing T cells (right). Error bars depict the mean ± SEM of five independent experiments (∗p < 0.05, ∗∗p < 0.01, ∗∗∗p < 0.001).
Figure 2
Figure 2
Nrf2-deficient CD8+ T cells display enhanced anti-tumor responses (A) Nrf2 effect on antigen-specific CD8+ T cell responses. CD8+ LN T cells from Nrf2−/−OT-I, OT-I, and Nrf2TgOT-I cells are stimulated for 16 h with OVA257–264 and assessed for IFNγ and GzmB expression by intracellular staining. IFNγ and GzmB profiles are representative of six independent experiments (left). The bar graph represents the percentage of IFNγ- or GzmB-producing OT-I cells (right, mean ± SEM). (B) Schematic of the experimental setup of Nrf2−/−OT-I, OT-I, and Nrf2TgOT-I generation and transfer to B16-OVA- or E.G7-OVA-bearing mice. (C and D) CD8+ LN T cells from Nrf2−/−OT-I, OT-I, and Nrf2TgOT-I cells are stimulated for 2 days with OVA257–264. Stimulated OT-I cells were adoptively transferred into tumor-bearing mice 10 days after subcutaneous (s.c.) challenge of B16-OVA (three independent experiments, n ≥ 4 mice/group) or E.G7-OVA (four independent experiments, n ≥ 4 mice/group). (C) Tumor volume is measured every 2–3 days. (D) Tumor weight is measured at the end of the experiment (mean ± SEM). (E) TIL T cells, dLN T, and LN T cells are isolated 23 days after B16-OVA challenge and stimulated with OVA257–264 for 16 h. IFNγ and GzmB expression are analyzed in donor OT-I cells using intracellular staining. Contour plots are representative of three independent experiments (n ≥ 4 mice/group, left). The bar graph represents the summary of three independent experiments (n ≥ 4 mice/group, means ± SEM). ∗p < 0.05, ∗∗p < 0.01, ∗∗∗p < 0.001. (F) Donor OT-I cells are traced in blood collected 1, 4, and 7 days after adoptive transfer. Contour plots are representative of three independent experiments (n ≥ 5 mice/group, left). Expansion kinetics of donor OT-I cells are shown by line graph, which is representative of three independent experiments (n = 5 mice/group, mean ± SEM). ∗p < 0.05, ∗∗p < 0.01, ∗∗∗p < 0.001, ∗∗∗∗p < 0.001. (G) Maintenance of donor OT-I cells in the spleen 23 days after B16-OVA challenge. Shown are CD8 versus CD45.2 profiles of CD4TCRβ+-gated splenocytes (top) and CD44 versus CD122 profiles of donor OT-I cells (bottom). Contour plots are representative of two independent experiments (n ≥ 5 mice/group, left). The bar graph presents the summary of two independent experiments (n ≥ 5 mice/group, mean ± SEM, right). (H) Splenocytes isolated 23 days after B16-OVA challenge are stimulated with PMA/ionomycin, and IFNγ and GzmB expression was assessed in donor OT-I cells using intracellular staining. Histograms are representative of three independent experiments (n ≥ 5 mice/group, left). The bar graph presents the summary of three independent experiments (n ≥ 5 mice/group, mean ± SEM, right). (I) Percentages of Gr-1hiCD11bhi MDSC subsets and the population of CD11c+ DCs in the spleen are analyzed gated on TCRβB220 cells and gated on Gr-1 cells, respectively. Contour plots are representative of two independent experiments (n ≥ 5 mice/group, left). The bar graph presents the summary of three independent experiments (n ≥ 5 mice/group, mean ± SEM, right). All data shown represent the summary of the error of the mean of independent experiments (∗p < 0.05, ∗∗p < 0.01, ∗∗∗p < 0.001, ∗∗∗∗p < 0.0001).
Figure 3
Figure 3
The ROS-Nrf2 axis regulates CD8+ T cell responses (A) Nrf2 is induced by ROS in a dose-dependent manner. After WT CD8+ T cells are stimulated with H2O2 for 16 h, Nrf2 mRNA (left) and protein (right) levels are analyzed by RT-qPCR and western blot assay, respectively. The results summarize four individual experiments. (B) WT and Nrf2−/− LN T cells are incubated with the indicated concentration of H2O2 for 16 h. The cell viability is determined using Annexin V staining. The graph shows a summary of three independent experiments. (C) CFSE-labeled WT and Nrf2−/− LN T cells are stimulated with α-CD3/α-CD28. CFSE dilution is analyzed at the indicated time points. The results summarize three independent experiments. (D) LN T cells are stimulated with the indicated concentration of α-CD3 for 16 h. Surface expression of TCRβ, IL-7Rα, and CD69 in activated T cells is determined using FACS staining. Histograms are representative of three independent experiments. (E) NRF2 expression and TCR signaling pathways in differentially activated T cells are analyzed by immunoblotting. The blot is representative of five independent experiments. GAPDH is used as the loading control. (F) The expression of Nrf2 and its target genes in differentially activated CD8+ T cells is evaluated using RT-qPCR. Data show the means ± SEM of five independent experiments (∗p < 0.05, ∗∗p < 0.01). (G) LN T cells are stimulated with α-CD3 (0.1 μg/mL) for the indicated times, and the kinetics of NRF2 expression are analyzed by immunoblotting (top). β-Actin is used as the loading control. The blot is representative of three independent experiments. The bar graph presents the summary of three independent experiments (mean ± SEM, bottom, ∗∗∗∗p < 0.0001). The expression of NRF2 is normalized to that of β-actin. (H) Experimental scheme of the H2O2-primed T cell activity (top). WT and Nrf2−/− naive T cells are incubated with 600 nM H2O2 for 12 h, and then H2O2-primed T cells are stimulated with α-CD3/α-CD28 (0.1 μg/mL) for 16 h. Intracellular IFNγ is analyzed (bottom). The bar graph presents the summary of six independent experiments (relative IFNγ production = TCR(+)H2O2(−) or TCR(+)H2O2(+)/TCR(−)H2O2(−), mean ± SEM, right). (I) TCR signaling in H2O2-primed T cells upon TCR stimulation. Immunoblot analysis of total and phosphorylated Zap70, LAT, and TCRζ in WT and Nrf2−/− T cells stimulated under the indicated condition. β-Actin is used as the loading control. The blot is representative of four independent experiments. (J) Experimental scheme of the activated T cell activity under H2O2 treatment (top). Naive T cells from WT, Nrf2−/−, and Nrf2Tg mice are stimulated with α-CD3/α-CD28 (0.1 μg/mL) for 16 h, and then activated T cells are incubated with 600 nM H2O2 for 12 h and assessed for IFNγ expression by intracellular staining (bottom). The bar graph of IFNγ and GzmB production summarizes five independent experiments (right, mean ± SEM). ∗p < 0.05, ∗∗p < 0.01, ∗∗∗p < 0.001.
Figure 4
Figure 4
Gene expression and chromatin accessibility profiles in TI Nrf2−/−OT-I cells (A) Schematic of the experimental setup of TI CD8+ T cell generation and bioinformatics analysis. (B) Heatmap of genes with opposing expression changes between Nrf2−/−OT-I and WTOT-I T cells. (C) Volume plots of genes differentially expressed in Nrf2−/−OT-I versus WTOT-I T cells. Differentially expressed genes (adjusted p < 0.05, fold change [log2 scale] ≥ 1 or ≤ −1) are highlighted; selected genes are labeled. Fold change values (log2 scale) of genes differentially expressed in Nrf2−/−OT-I T cells relative to WTOT-I T cells are compared to those of the corresponding values in cells ectopically expressing Nrf2. (D) Fragments per kilobase of exon model per million mapped fragments of activation-, cytotoxicity-, IFN-, and exhaustion-related genes in different groups. (E and F) Scatterplot of pairwise comparison of ATAC-seq density (Tn5 insertions per kilobase) between Nrf2−/−OT-I and WTOT-I T cells showing differentially accessible regions and associated de novo identified motifs. (G) Genome browser view of the hyperfunction locus of CD8+ T cells in all previously mentioned ATAC-seq samples. (H) RT-qPCR analysis of effector function-related genes of CD8+ T cells in Nrf2−/−OT-I and WTOT-I T cells (n = 4 mice/group). The expression of the target genes is normalized to that of Rpl13. Data show the mean ± SEM of two independent experiments (∗∗p < 0.01, ∗∗∗p < 0.001).
Figure 5
Figure 5
Nrf2 KD enhances in vivo efficacy of CAR-T cells against solid tumors (A and B) Human T cells from PBMC are stimulated with α-CD3/α-CD28 (1 μg/mL) for indicated times (A). Human T cells are incubated in 20 μM tert-Butylhydroquinone (tBHQ) and 100 μM H2O2 medium for 16 h (B). Cultured T cells are harvested and assessed for human Nrf2 by immunoblotting. β-Actin is used as the loading control. The blot is representative of three independent experiments. (C) Cytotoxicity assay using Nrf2KD-CAR-T cells and IM-9-zsgreen cells cocultured at a 1:1 ratio in medium (top) and 20 μM H2O2 (bottom). Each data point represents a mean of triplicate samples, and error bars represent SEM. The results are representative of three independent experiments. (D) Schematic of the CAR-T cell transfer experiments. (E) Human T, control CAR-T, and Nrf2KD-CAR-T cells are transferred to IM-9-zsgreen tumor-bearing NOG mice, and tumor growth is monitored twice a week. Tumor weight is measured at the end of monitoring (day 42). The results are a summary of four independent experiments (n = 7 mice/group). Data are represented as the mean ± SEM of four independent experiments. (F) LNGFR+ CAR-T cells are traced in the spleen and TILs 42 days after tumor injection. Dot plots are representative of three independent experiments (n = 7 mice/group). The bar graph summarizes LNGFR+ CAR-T cell frequency and numbers in the spleen and TILs. Data are representative of four independent experiments. (G) Splenocytes and TILs isolated from the indicated groups are stimulated with PMA/ionomycin, and IFNγ expression was assessed by intracellular staining. Contour plots are representative of four independent experiments (n = 7 mice/group). The bar graph shows the percentage of IFNγ-producing CAR-T cells (right, mean ± SEM). (H) MDSCs (Gr-1hiCD11bhi) from the spleen and TILs of tumor-bearing NOG mice. Contour plots are representative of four independent experiments (n = 7 mice/group). The bar graph represents the percentage and numbers of MDSCs (right, mean ± SEM). ∗p < 0.05, ∗∗p < 0.01, ∗∗∗p < 0.001.

References

    1. Fridman W.H., Pagès F., Sautès-Fridman C., Galon J. The immune contexture in human tumours: impact on clinical outcome. Nat. Rev. Cancer. 2012;12:298–306. doi: 10.1038/nrc3245. - DOI - PubMed
    1. Kim G., Hwang H., Jo Y., Lee B., Lee Y.H., Kim C.H., Hong C. Soluble γc receptor attenuates anti-tumor responses of CD8(+) T cells in T cell immunotherapy. Int. J. Cancer. 2018;143:1212–1223. doi: 10.1002/ijc.31402. - DOI - PubMed
    1. Kim J., Choi J.Y., Min H., Hwang K.W. Exploring the Potential of Glycolytic Modulation in Myeloid-Derived Suppressor Cells for Immunotherapy and Disease Management. Immune Netw. 2024;24 - PMC - PubMed
    1. Majzner R.G., Mackall C.L. Clinical lessons learned from the first leg of the CAR T cell journey. Nat. Med. 2019;25:1341–1355. doi: 10.1038/s41591-019-0564-6. - DOI - PubMed
    1. Shah N.N., Fry T.J. Mechanisms of resistance to CAR T cell therapy. Nat. Rev. Clin. Oncol. 2019;16:372–385. doi: 10.1038/s41571-019-0184-6. - DOI - PMC - PubMed

MeSH terms