Meta-Analysis
. 2024 Dec;19(1):2392050.
doi: 10.1080/15592294.2024.2392050. Epub 2024 Aug 22.

Genetic architecture of epigenetic cortical clock age in brain tissue from older individuals: alterations in CD46 and other loci

Affiliations
Meta-Analysis

Genetic architecture of epigenetic cortical clock age in brain tissue from older individuals: alterations in CD46 and other loci

Francine Grodstein et al. Epigenetics. 2024 Dec.

Abstract

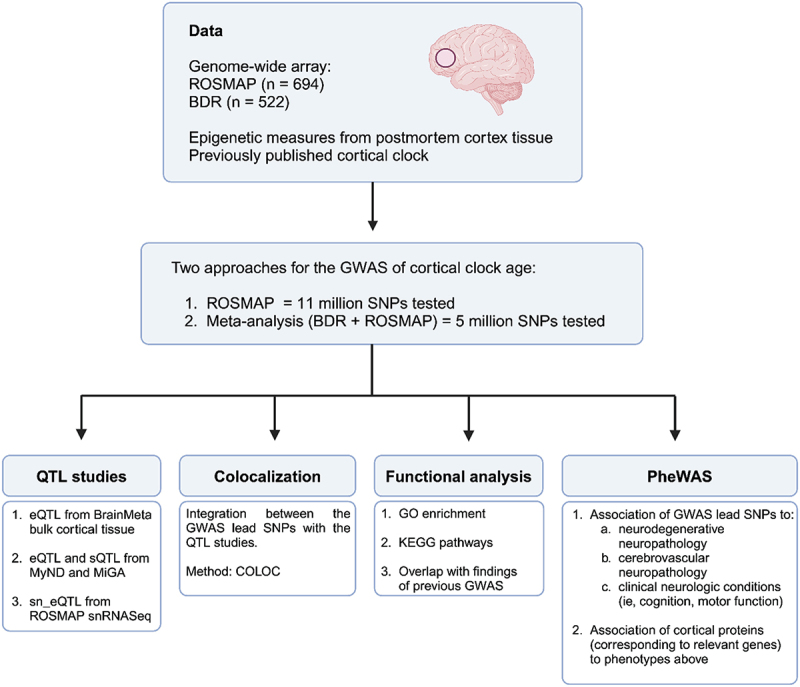
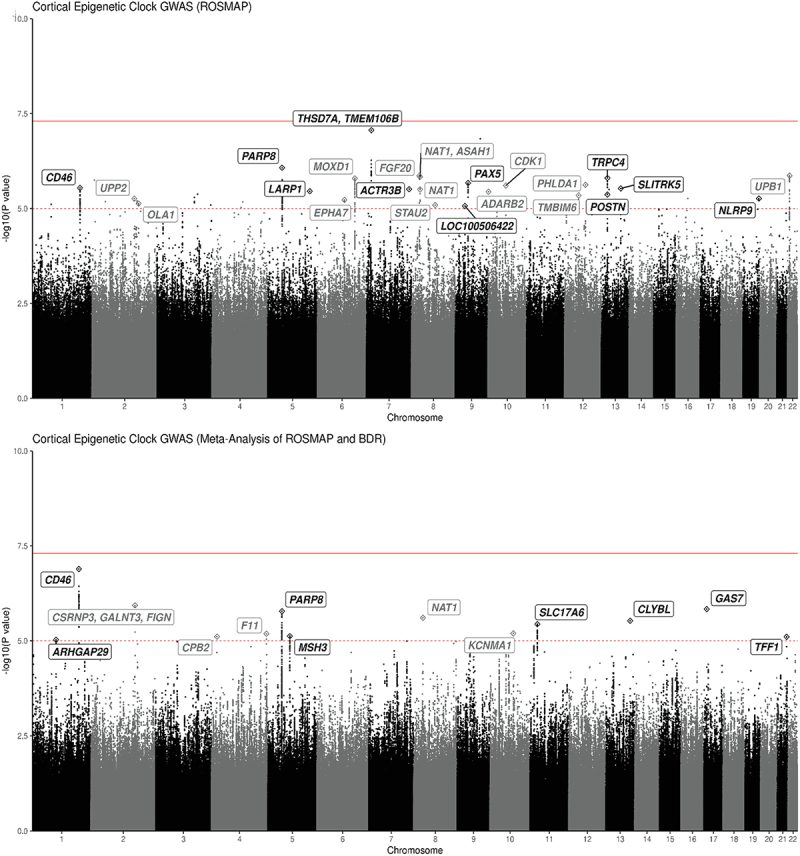
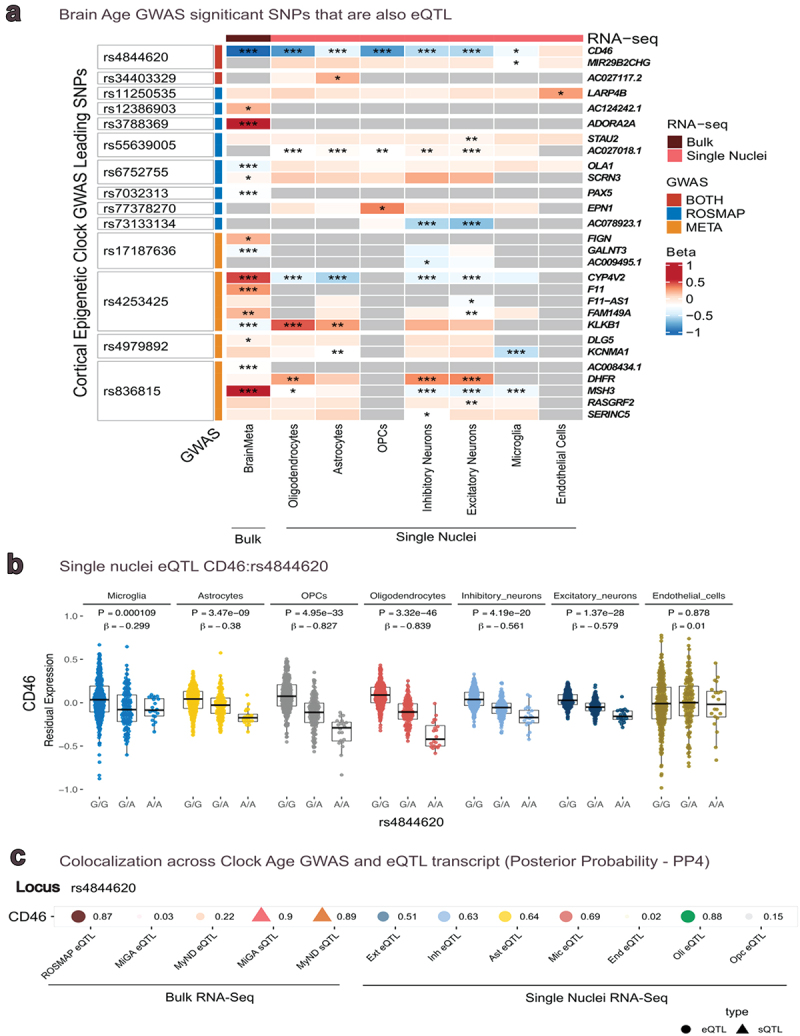
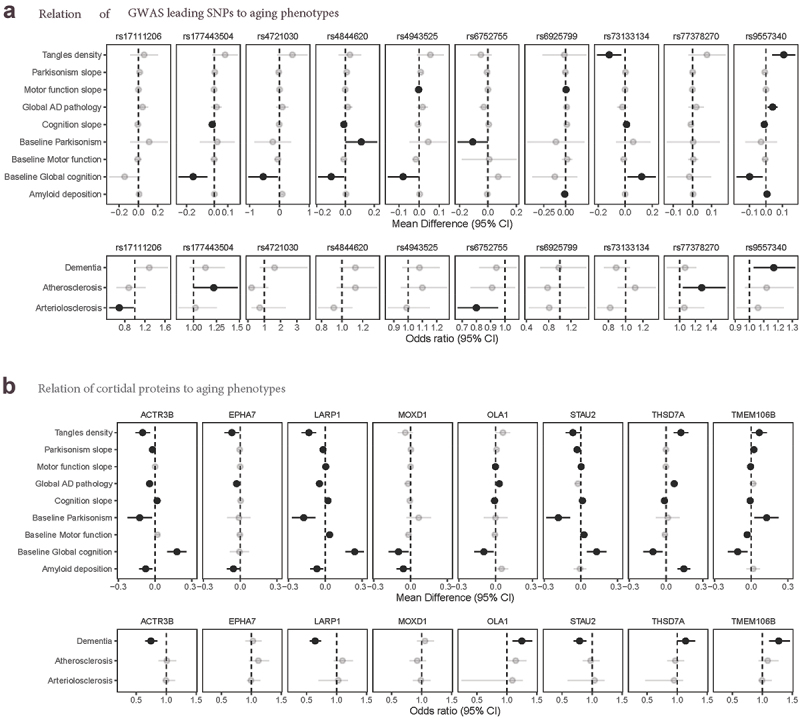
The cortical epigenetic clock was developed in brain tissue as a biomarker of brain aging. As one way to identify mechanisms underlying aging, we conducted a GWAS of cortical age. We leveraged postmortem cortex tissue and genotyping array data from 694 participants of the Rush Memory and Aging Project and Religious Orders Study (ROSMAP; 11000,000 SNPs), and meta-analysed ROSMAP with 522 participants of Brains for Dementia Research (5,000,000 overlapping SNPs). We confirmed results using eQTL (cortical bulk and single nucleus gene expression), cortical protein levels (ROSMAP), and phenome-wide association studies (clinical/neuropathologic phenotypes, ROSMAP). In the meta-analysis, the strongest association was rs4244620 (p = 1.29 × 10⁻⁷), which also exhibited FDR-significant cis-eQTL effects for CD46 in bulk and single nucleus (microglia, astrocyte, oligodendrocyte, neuron) cortical gene expression. Additionally, rs4244620 was nominally associated with lower cognition, faster slopes of cognitive decline, and greater Parkinsonian signs (n ~ 1700 ROSMAP with SNP/phenotypic data; all p ≤ 0.04). In ROSMAP alone, the top SNP was rs4721030 (p = 8.64 × 10⁻⁸) annotated to TMEM106B and THSD7A. Further, in ROSMAP (n = 849), TMEM106B and THSD7A protein levels in cortex were related to many phenotypes, including greater AD pathology and lower cognition (all p ≤ 0.0007). Overall, we identified converging evidence of CD46 and possibly TMEM106B/THSD7A for potential roles in cortical epigenetic clock age.

Keywords: Aging; brain; dementia; epigenetics.


Conflict of interest statement

No potential conflict of interest was reported by the author(s).

Figures

Figure 1.
Figure 1.
Flowchart of study design.
Figure 2.
Figure 2.
Manhattan plot: GWAS of cortical clock age for ROSMAP and Meta-analysis of ROSMAP/BDR.
Figure 3.
Figure 3.
Expression quantitative trait Loci** in panel a, Heatmap show the GWAS lead SNPs that are FDR significant eQTL in bulk brain RNAseq (BrainMeta), and sn-RNAseq cell specific eQTL. *P ≤ 0.05, **P ≤ 0.01, ***P ≤ 0.001. The strongest relation of SNP to expression level was identified for rs4844620 with CD46. In panel b, we show CD46 expression levels across genotypes of rs4844620 in 7 cell types from ROSMAP single nucleus RNAseq. This was the strongest finding for the snRnaseq results. In panel c, colocalization analyses demonstrate the likelihood that a SNP is causal for both cortical clock age and for expression levels. The value to the right of each point is the posterior probability (PP) that the SNP is related to clock age and to the QTL; PP > 0.8 is standardly considered as high likelihood the SNP is causal for both traits. ROSMAP eQTL are from frontal cortex; MiGA are from primary monocytes; MyND are primary microglia; single cell eQTL are from ROSMAP frontal cortex.
Figure 4.
Figure 4.
Relations of SNPs and cortical proteins to aging Phenotypes**, panel a: we show relations of leading SNPs to aging phenotypes, for SNPs with nominally significant relations with phenotypes. For continuous outcomes, we show mean differences from linear or linear mixed effects models; for categorical outcomes, we show odds ratios from logistic regression models. All models controlled for age at death, sex, and education. Of particular interest here, rs4844620 was related to lower baseline cognition (p = 0.031), steeper slopes of cognitive decline over time (p = 0.007), higher baseline levels of Parkinsonian signs (p = 0.046). Additionally, rs9557340 was related to more global AD neuropathology (p = 0.0047), more amyloid-β load (p = 0.014), greater PHFtau tangle density (p = 0.0022), lower baseline cognition (p = 0.014) and higher odds of dementia (p = 0.0038). panel b: we were able to examine protein levels in frontal cortex, based on annotated genes in our GWAS (14 genes of interest had corresponding protein levels in our proteomics data). We show here results for proteins which reached nominal significance for phenotypes. Of particular interest here, higher levels of the protein THSD7A in prefrontal cortex were related to more global AD pathology (p < 10−5), more amyloid-β load (p < 10−5), greater PHFtau tangle density (p < 10−5), lower baseline cognition (p = 0.007), steeper slopes of cognitive decline (p = 0.001) and higher odds of dementia (p = 0.046). Higher levels of TMEM106B protein were related to greater PHFtau tangle density (p = 0.03), more parkinsonism at baseline (p = 0.01) and steeper slopes over time (p = 0.0001), lower motor function at baseline (p = 0.001) and steeper slopes (p < 10−5), lower baseline cognition (p = 0.007), steeper slopes of cognitive decline (p = 0.04) and higher odds of dementia (p = 0.0004). Solid colors indicate significant association.

References

    1. Alzheimer’s Association . 2019 Alzheimer’s disease facts and figures. Alzheimers Dement. 2023;19(4). doi: 10.1002/alz - DOI - PubMed
    1. Jylhava J, Pedersen NL, Hagg S.. Biological age predictors. EBioMedicine. 2017;21:29–18. doi: 10.1016/j.ebiom.2017.03.046 - DOI - PMC - PubMed
    1. Shireby GL, Davies JP, Francis PT, et al. Recalibrating the epigenetic clock: implications for assessing biological age in the human cortex. Brain. 2020;143(12):3763–3775. doi: 10.1093/brain/awaa334 - DOI - PMC - PubMed
    1. Grodstein F, Lemos B, Yu L, et al. Characteristics of epigenetic clocks across blood and brain tissue in older women and men. Front Neurosci. [2021 Jan 7];14:555307. doi: 10.3389/fnins.2020.555307 PMID: 33488342. - DOI - PMC - PubMed
    1. Grodstein F, Lemos B, Yu L, et al. The association of epigenetic clocks in brain tissue with brain pathologies and common aging phenotypes. Neurobiol Dis. 2021. Sep;157:105428. doi: 10.1016/j.nbd.2021.105428 Epub 2021 Jun 19. PMID: 34153464; PMCID: PMC8373772. - DOI - PMC - PubMed

Publication types

Substances