. 2024 Aug 7:14:1408614.
doi: 10.3389/fonc.2024.1408614. eCollection 2024.

Single-cell RNA and T-cell receptor sequencing unveil mycosis fungoides heterogeneity and a possible gene signature

Affiliations

Single-cell RNA and T-cell receptor sequencing unveil mycosis fungoides heterogeneity and a possible gene signature

Nalini Srinivas et al. Front Oncol. .

Abstract

Background: Mycosis fungoides (MF) is the most common subtype of cutaneous T-cell lymphoma (CTCL). Comprehensive analysis of MF cells in situ and ex vivo is complicated by the fact that is challenging to distinguish malignant from reactive T cells with certainty.

Methods: To overcome this limitation, we performed combined single-cell RNA (scRNAseq) and T-cell receptor TCR sequencing (scTCRseq) of skin lesions of cutaneous MF lesions from 12 patients. A sufficient quantity of living T cells was obtained from 9 patients, but 2 had to be excluded due to unclear diagnoses (coexisting CLL or revision to a fixed toxic drug eruption).

Results: From the remaining patients we established single-cell mRNA expression profiles and the corresponding TCR repertoire of 18,630 T cells. TCR clonality unequivocally identified 13,592 malignant T cells. Reactive T cells of all patients clustered together, while malignant cells of each patient formed a unique cluster expressing genes typical of naive/memory, such as CD27, CCR7 and IL7R, or cytotoxic T cells, e.g., GZMA, NKG7 and GNLY. Genes encoding classic CTCL markers were not detected in all clusters, consistent with the fact that mRNA expression does not correlate linearly with protein expression. Nevertheless, we successfully pinpointed distinctive gene signatures differentiating reactive malignant from malignant T cells: keratins (KRT81, KRT86), galectins (LGALS1, LGALS3) and S100 genes (S100A4, S100A6) being overexpressed in malignant cells.

Conclusions: Combined scRNAseq and scTCRseq not only allows unambiguous identification of MF cells, but also revealed marked heterogeneity between and within patients with unexpected functional phenotypes. While the correlation between mRNA and protein abundance was limited with respect to established MF markers, we were able to identify a single-cell gene expression signature that distinguishes malignant from reactive T cells.

Keywords: CTCL; TCR sequencing; gene signature; heterogeneity; malignant T cells; single-cell RNA sequencing.


Conflict of interest statement

SU declares research support from Bristol Myers Squibb and Merck Serono; speakers and advisory board honoraria from Bristol Myers Squibb, Merck Sharp and Novartis, and travel support from Bristol Myers Squibb, Merck Sharp & Dohme and Pierre Fabre. EL reports personal fees, honoraria, and support for attending meetings or travel grants from Bristol Myers Squibb, Medac, Novartis, Pierre Fabre, and Sun Pharma, and honoraria from MSD, Recordati, and Sanofi. EL participated on a drug safety monitoring or advisory board for Bristol Myers Squibb, Novartis, Sanofi, and Sun Pharma. TG has received speakers and/or advisory board honoraria from BMS, Sano-fi-Genzyme, MSD, Novartis Pharma, Roche, Abbvie, Almirall, Janssen, Lilly, Pfizer, Pierre Fabre, Merck-Serono, outside the submitted work. JB is receiving speaker’s bureau honoraria from Amgen, Pfizer, Recordati and Sanofi, and is a paid consultant/advisory board member/DSMB member for Almirall, Boehringer Ingelheim, InProTher, ICON, Merck Serono, Pfizer, 4SC and Sanofi/Regeneron. His group receives research grants from Bristol Myers Squibb, Merck Serono, HTG, IQVIA and Alcedis GmbH. The remaining authors declare that the research was conducted in the absence of any commercial or financial relationships that could be construed as a potential conflict of interest.

Figures
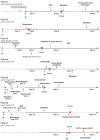
Figure 1
Figure 1
Patients’ history. The MF-specific history of these 7 patients is sketched. Duration of disease ranged from less than 1 to 17 years. Multiple different therapies (bexarotene, brentuximab-vedotin, doxorubicin, extracorporeal photopheresis (ECP), gemcitabin, interferon alpha, methotrexate (MTX), psoralen plus UV-A, resminostat, and/or ionizing radiation) were applied. The number of these treatments before biopsy collection ranged from treatment naïve to seven lines of therapy.
Figure 2
Figure 2
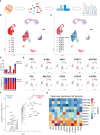
Single-cell transcriptomics of T cells isolated from MF lesions. (A) Workflow from sample preparation to sequencing. (B) UMAP for scRNA expression of 18,630 T cells isolated from cutaneous lesions of 7 patients diagnosed with MF. Cells were clustered using Seurat and annotated according to their sample origin. (C) TCR sequencing based clonotype information was applied to the UMAP. The most frequent TCR clonotype within a sample is assumed to be the respective malignant T-cell clone (MTC) and color coded accordingly; the polyclonal reactive infiltrate is depicted in blue. (D) Absolute (upper panel) and relative (lower panel) MTC to the reactive infiltrate ratios per sample. (E) Feature plots showing the normalized mRNA expression level of genes encoding commonly reported CTCL markers by incremental red shading. (F) Volcano plot depicting differentially expressed genes between malignant and reactive T cells for all samples combined. Differentially expressed genes were calculated by Wilcoxon rank sum test (logFC > |0.25|, adjusted P value < 0.05). (G) Differentially expressed genes between malignant the T-cell population and their respective reactive infiltrate are depicted in a heat map as averaged and subsequently scaled expression if differentially expressed in four or more tumors.
Figure 3
Figure 3
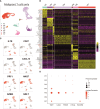
Inter-patient heterogeneity of MF cells. (A) UMAP depicting only the malignant T cells of all patients annotated by patient. (B) Heat map showing the expression of the ten top differentially expressed genes between MF cells of individual patients. Genes encoding established MF-associated markers are highlighted in red. Scaled expression values are color-coded with high expression in yellow and low expression in purple. (C) Feature plots depicting the normalized expression of indicated genes by incremental red shading. (D) Dot plot for expression of genes associated with T cell exhaustion in MF cells from each patient. Size of the dots reflects the percentage of cells expressing the respective gene and color intensity the relative expression intensity.
Figure 4
Figure 4
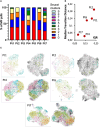
Intra-patient heterogeneity and transcriptional dynamics of MF cells. (A) Bar graph of transcriptomic diversity of the malignant T-cell population based on Seurat’s Louvain clustering for each patient. (B) Each panel depicts the indicated patient’s MF cells in a UMAP annotated according to Louvain clustering (left) or with arrows reflecting RNA velocities. (C) Dot plot to visualize the quantification of combined RNA velocities for the individual patients. The median transition distance reflects the magnitude of transcriptional changes (i.e., the velocity arrow length in PCA space) and the inner quartile range (IQR) the variance between the cells within a sample.
Figure 5
Figure 5
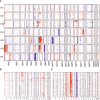
Copy number variation profiles in MF cells. (A) Overview presentation of scRNAseq data-derived CNV profiles of MF cells from all 7 patients. Regions with predicted copy number gains are indicated in red, losses in blue. (B, C) More detailed presentation of inferred CNV for patient 2 and 5.

References

    1. Patil K, Kuttikrishnan S, Khan AQ, Ahmad F, Alam M, Buddenkotte J, et al. . Molecular pathogenesis of Cutaneous T cell Lymphoma: Role of chemokines, cytokines, and dysregulated signaling pathways. Semin Cancer Biol. (2022) 86:382–99. doi: 10.1016/j.semcancer.2021.12.003 - DOI - PubMed
    1. Bastidas Torres AN, Najidh S, Tensen CP, Vermeer MH. Molecular advances in cutaneous T-cell lymphoma. Semin Cutan Med Surg. (2018) 37:81–6. doi: 10.12788/j.sder.2018.007 - DOI - PubMed
    1. Liu X, Jin S, Hu S, Li R, Pan H, Liu Y, et al. . Single-cell transcriptomics links Malignant T cells to the tumor immune landscape in cutaneous T cell lymphoma. Nat Commun. (2022) 13 1158. doi: 10.1038/s41467-022-28799-3 - DOI - PMC - PubMed
    1. Borcherding N, Voigt AP, Liu V, Link BK, Zhang W, Jabbari A. Single-cell profiling of cutaneous T-cell lymphoma reveals underlying heterogeneity associated with disease progression. Clin Cancer Res. (2019) 25:2996–3005. doi: 10.1158/1078-0432.CCR-18-3309 - DOI - PMC - PubMed
    1. Gaydosik AM, Tabib T, Geskin LJ, Bayan CA, Conway JF, Lafyatis R, et al. . Single-cell lymphocyte heterogeneity in advanced cutaneous T-cell lymphoma skin tumors. Clin Cancer Res. (2019) 25:4443–54. doi: 10.1158/1078-0432.CCR-19-0148 - DOI - PMC - PubMed

LinkOut - more resources