

Computational identification of novel potential genetic pathogenesis and otherwise biomarkers in acute liver allograft rejection
- PMID: 39170115
- PMCID: PMC11336371
- DOI: 10.1016/j.heliyon.2024.e33359
Computational identification of novel potential genetic pathogenesis and otherwise biomarkers in acute liver allograft rejection
Abstract
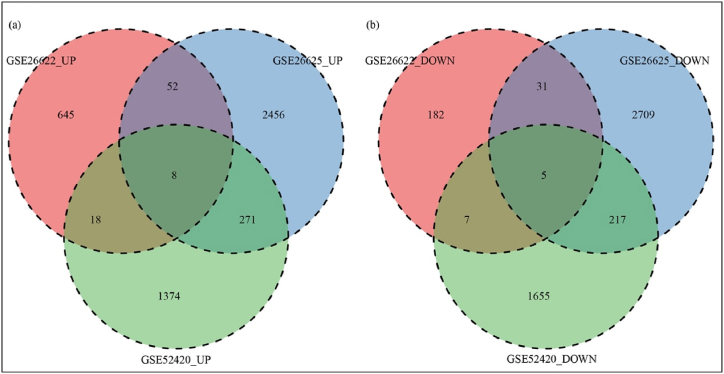
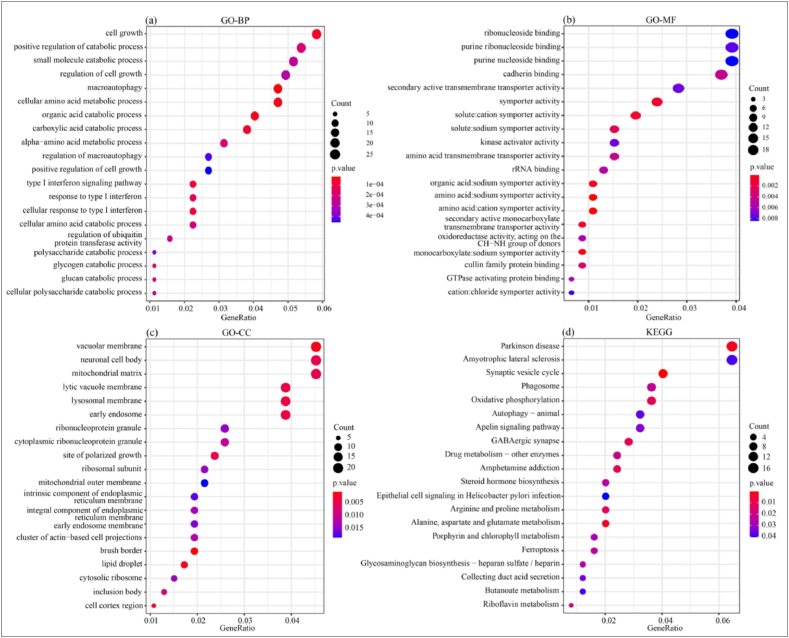
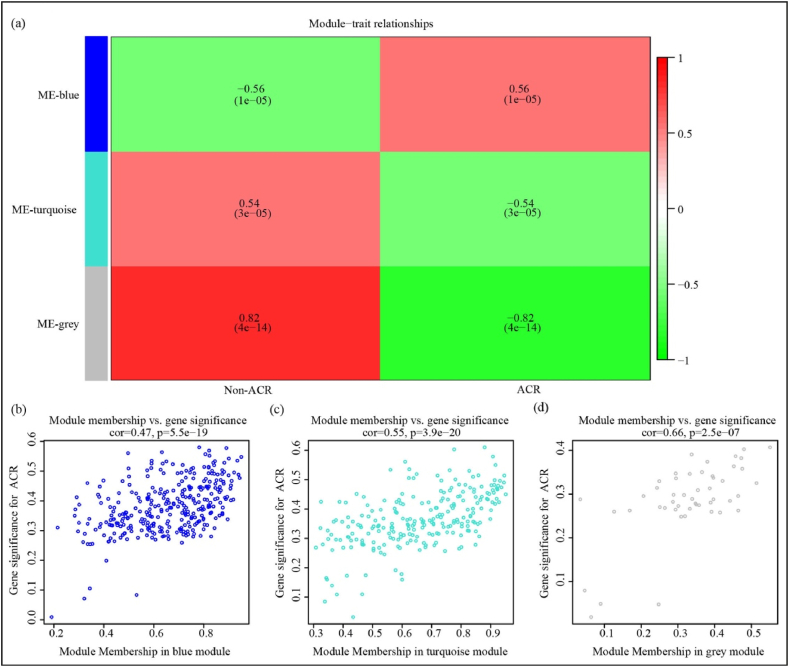
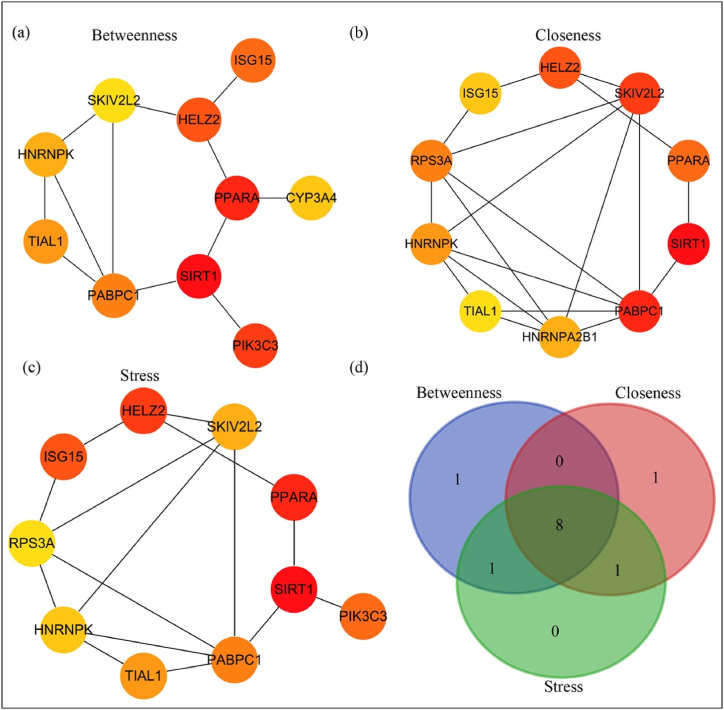
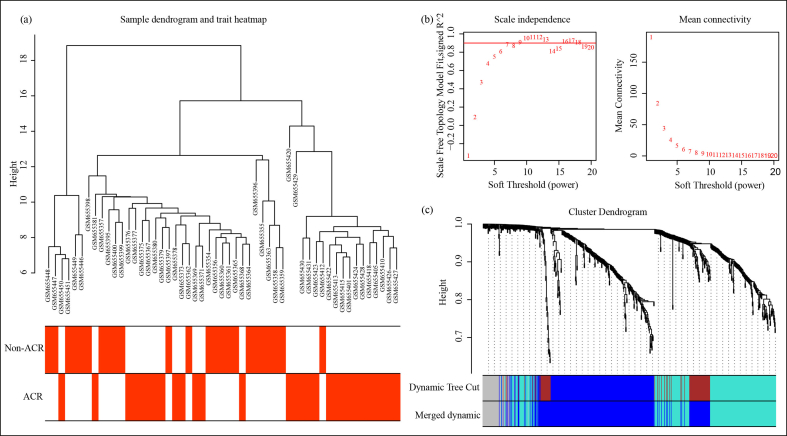
Acute cellular rejection (ACR) is a prevalent postoperative complication following liver transplantation (LT), exhibiting an increasing incidence of morbidity and mortality. However, the molecular mechanisms of ACR following LT remain unclear. To explore the genetic pathogenesis and identify biomarkers of ACR following LT, three relevant Gene Expression Omnibus (GEO) datasets consisting of data on ACR or non-ACR patients after LT were comprehensively investigated by computational analysis. A total of 349 upregulated and 260 downregulated differentially expressed genes (DEGs) and eight hub genes (ISG15, HELZ2, HNRNPK, TIAL1, SKIV2L2, PABPC1, SIRT1, and PPARA) were identified. Notably, HNRNPK, TIAL1, and PABPC1 exhibited the highest predictive potential for ACR with AUCs of 0.706, 0.798, and 0.801, respectively. KEGG analysis of hub genes revealed that ACR following LT was predominately associated with ferroptosis, protein processing in the endoplasmic reticulum, complement and coagulation pathways, and RIG-I/NOD/Toll-like receptor signaling pathway. According to the immune cell infiltration analysis, γδT cells, NK cells, Tregs, and M1/M2-like macrophages had the highest levels of infiltration. Compared to SIRT1, ISG15 was positively correlated with γδT cells and M1-like macrophages but negatively correlated with NK cells, CD4+ memory T cells, and Tregs. In conclusion, this study identified eight hub genes and their potential pathways, as well as the immune cells involved in ACR following LT with the greatest levels of infiltration. These findings provide a new direction for future research on the underlying mechanism of ACR following LT.
Keywords: Acute cellular rejection; Biomarkers; Hub genes; Liver transplantation; Mechanisms.
© 2024 The Authors.
Conflict of interest statement
The authors declare the following financial interests/personal relationships which may be considered as potential competing interests:Chun-Qiang Dong reports financial support was provided by The First Affiliated Hospital of 10.13039/501100011827Guangxi Medical University. Song-Qing He reports financial support was provided by The First Affiliated Hospital of 10.13039/501100011827Guangxi Medical University. Chun-Qiang Dong reports a relationship with The First Affiliated Hospital of 10.13039/501100011827Guangxi Medical University that includes: funding grants. Song-Qing He reports a relationship with The First Affiliated Hospital of 10.13039/501100011827Guangxi Medical University that includes: funding grants. No other conflicts of interest. If there are other authors, they declare that they have no known competing financial interests or personal relationships that could have appeared to influence the work reported in this paper.
Figures


References
-
- Rodríguez-Perálvarez M., et al. Biopsy-proven acute cellular rejection as an efficacy endpoint of randomized trials in liver transplantation: a systematic review and critical appraisal. Transpl. Int. 2016;29(9):961–973. - PubMed
-
- Lee B.T., Fiel M.I., Schiano T.D. Antibody-mediated rejection of the liver allograft: an update and a clinico-pathological perspective. J. Hepatol. 2021;75(5):1203–1216. - PubMed
-
- Kohut T.J., Barandiaran J.F., Keating B.J. Genomics and liver transplantation: genomic biomarkers for the diagnosis of acute cellular rejection. Liver Transplant. 2020;26(10):1337–1350. - PubMed
-
- Regev A., et al. Sampling error and intraobserver variation in liver biopsy in patients with chronic HCV infection. Am. J. Gastroenterol. 2002;97(10):2614–2618. - PubMed
LinkOut - more resources
Full Text Sources
Research Materials
Miscellaneous
