

TMAO is involved in kidney-yang deficiency syndrome diarrhea by mediating the "gut-kidney axis"
- PMID: 39170478
- PMCID: PMC11336722
- DOI: 10.1016/j.heliyon.2024.e35461
TMAO is involved in kidney-yang deficiency syndrome diarrhea by mediating the "gut-kidney axis"
Abstract
Background: Trimethylamine-N-oxide (TMAO) is a harmful metabolite dependent on the intestinal microbiota and excreted through the kidneys. According to numerous investigations, rich circulation concentrations of TMAO have been linked to kidney and gastrointestinal disorders. Through the "gut-kidney axis" mediated by TMAO, this research attempted to clarify the microbiological causes of kidney-yang deficiency syndrome diarrhea.
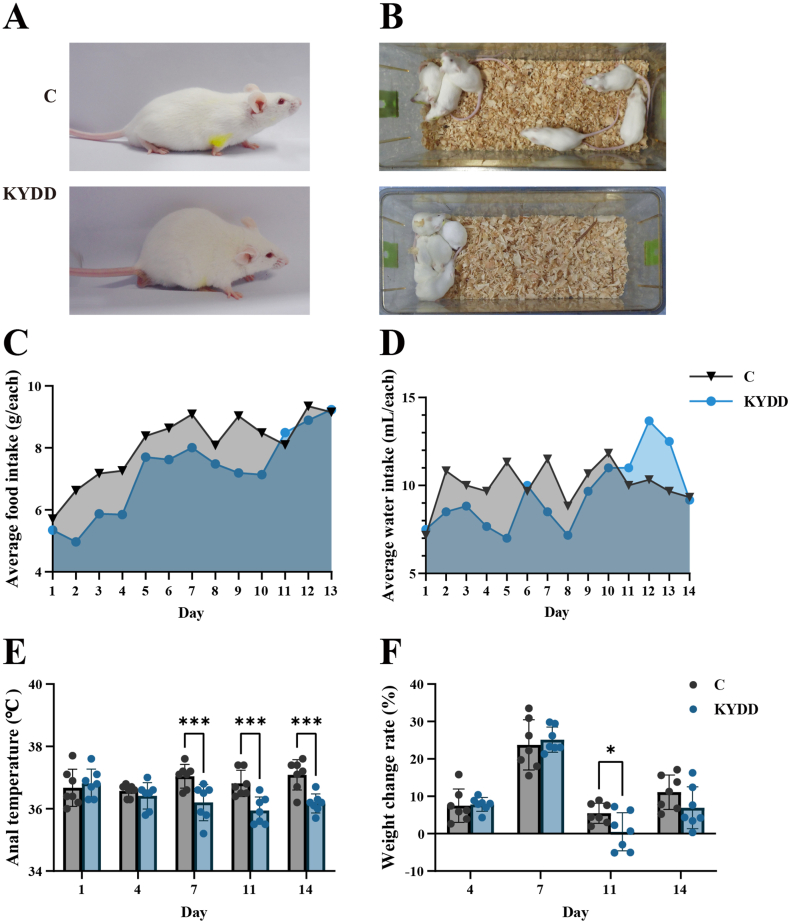
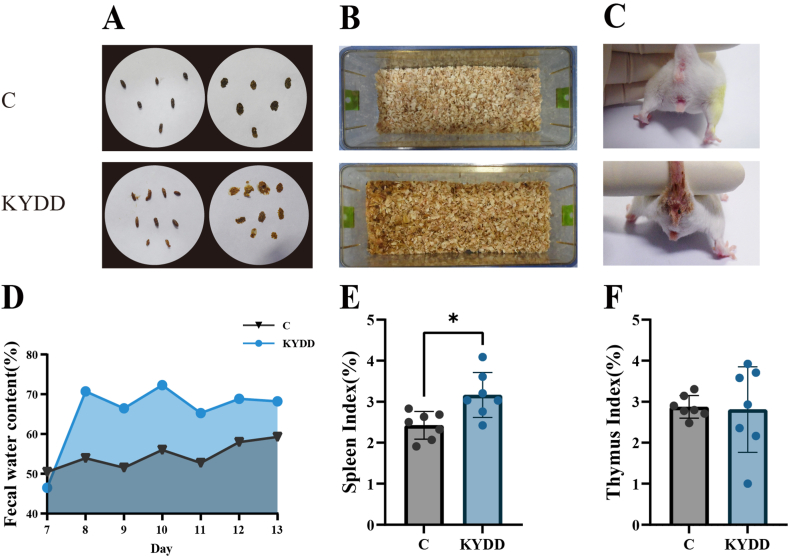
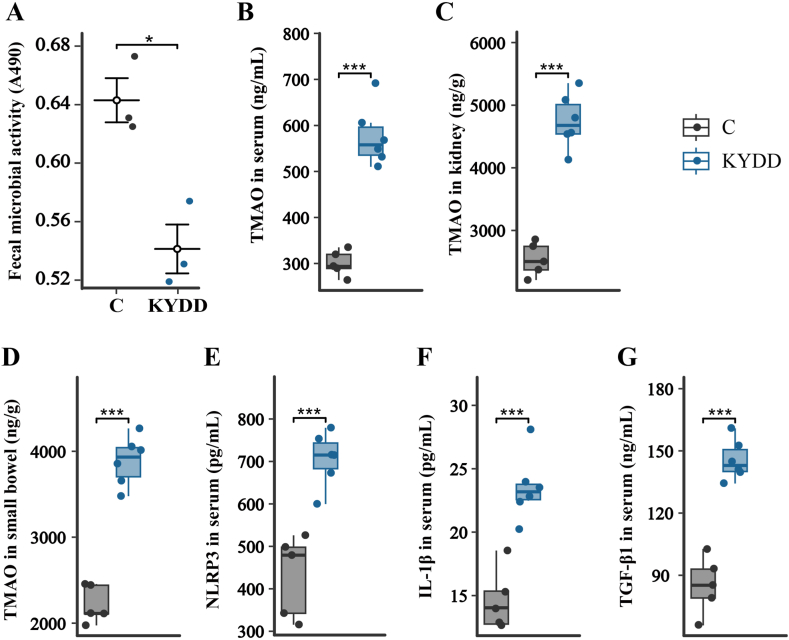
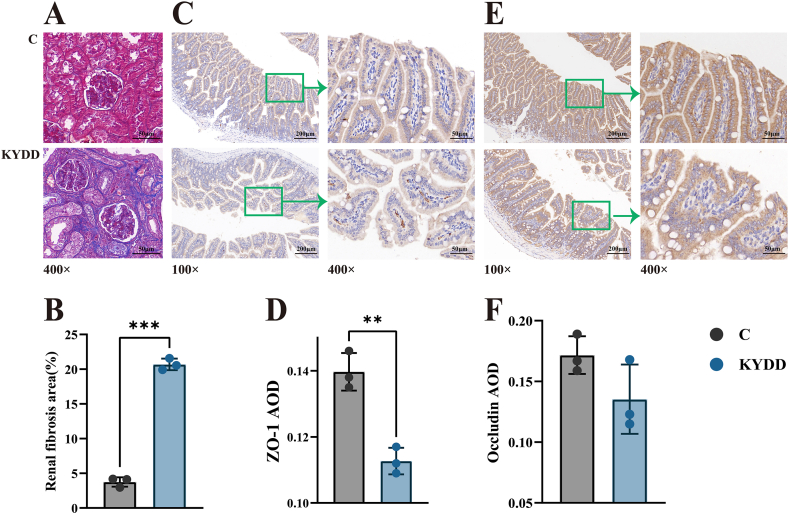
Methods: Adenine and Folium Sennae were used to create a mouse model of kidney-yang deficiency syndrome diarrhea. 16S rRNA sequencing was used to identify the traits of the intestinal mucosal microbiota. ELISA was used to assess TMAO, transforming growth factor-β1 (TGF-β1), interleukin-1β (IL-1β), and NOD-like receptor thermal protein domain associated protein 3 (NLRP3). Kidney tissue fibrosis was evaluated using Masson's trichrome staining, and immunohistochemical labeling was used to investigate the protein expression of occludin and Zonula Occludens-1(ZO-1) in small intestine tissue. Microbial activity was determined by using fluorescein diacetate (FDA) hydrolysis spectrophotometry.
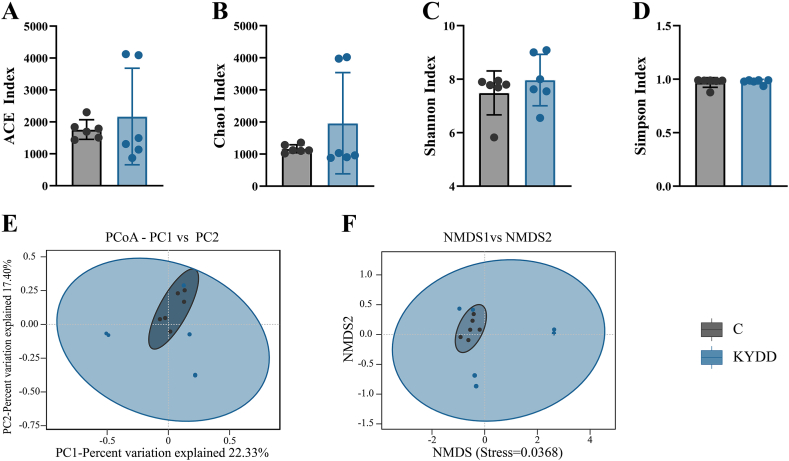
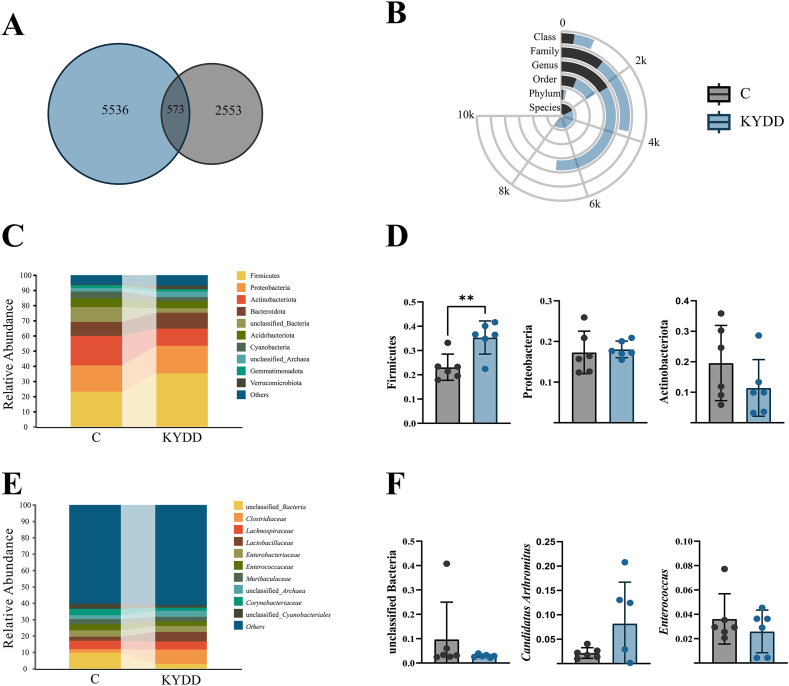
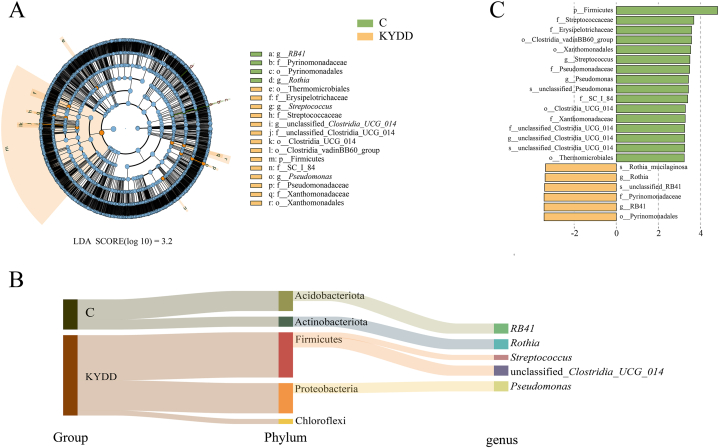
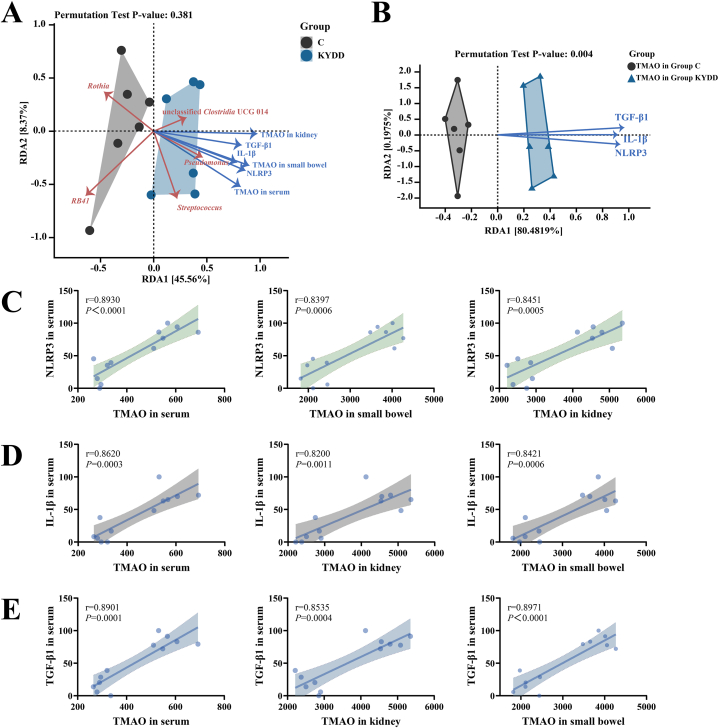
Results: TMAO showed a positive correlation with NLRP3, IL-1β and TGF-β1, all of which exhibited substantial increases (P < 0.05). Significant renal fibrosis and decreased ZO-1 and occludin expression in small intestine tissues were detected in the model group. The sequencing results revealed alterations in both α and β diversities of small intestinal mucosal microbiota. Elevated TMAO concentrations were potentially associated with increasing Firmicutes/Bacteroidota (F/B) ratios, Streptococcus, Pseudomonas and unclassified Clostridia UCG 014, but with decreasing Rothia and RB41 abundances.
Conclusion: This study establishes a link between intestinal microbiota dysbiosis and elevated TMAO concentrations. TMAO can activate inflammatory responses and cytokines, contributing to kidney-yang deficiency syndrome diarrhea via the "gut-kidney axis". Moreover, TMAO may coincide with disruptions in the intestinal barrier and renal fibrosis. Dysfunction of the "gut-kidney axis" further elevates TMAO levels, perpetuating a vicious cycle.
Keywords: Gut-kidney axis; Inflammation; Intestinal barrier; Intestinal microbiota; Kidney-yang deficiency syndrome diarrhea; Renal fibrosis; TMAO.
© 2024 The Authors.
Conflict of interest statement
The authors declare that they have no competing interests. All the authors have approved the manuscript and agree with this submission.
Figures
Similar articles
-
Targeting the Gut-Kidney Axis in Diarrhea with Kidney-Yang Deficiency Syndrome: The Role of Sishen Pills in Regulating TMAO-Mediated Inflammatory Response.Med Sci Monit. 2024 Jun 20;30:e944185. doi: 10.12659/MSM.944185. Med Sci Monit. 2024. PMID: 38898640 Free PMC article.
-
Dysfunction of cecal microbiota and CutC activity in mice mediating diarrhea with kidney-yang deficiency syndrome.Front Microbiol. 2024 Mar 4;15:1354823. doi: 10.3389/fmicb.2024.1354823. eCollection 2024. Front Microbiol. 2024. PMID: 38500584 Free PMC article.
-
Decreasing of Trimethylamine N-Oxide by Cecal Microbiota and Choline-Trimethylamine Lyase are Associated with Sishen Pill on Diarrhea with Kidney-Yang Deficiency Syndrome.J Inflamm Res. 2024 Oct 13;17:7275-7294. doi: 10.2147/JIR.S470254. eCollection 2024. J Inflamm Res. 2024. PMID: 39429849 Free PMC article.
-
The Role of a Gut Microbial-Derived Metabolite, Trimethylamine N-Oxide (TMAO), in Neurological Disorders.Mol Neurobiol. 2022 Nov;59(11):6684-6700. doi: 10.1007/s12035-022-02990-5. Epub 2022 Aug 20. Mol Neurobiol. 2022. PMID: 35986843 Review.
-
The Brain-Gut Axis, an Important Player in Alzheimer and Parkinson Disease: A Narrative Review.J Clin Med. 2024 Jul 15;13(14):4130. doi: 10.3390/jcm13144130. J Clin Med. 2024. PMID: 39064171 Free PMC article. Review.
Cited by
-
Effect of Sodium Butyrate and Sishen Pill Combination on Diarrhea with Kidney-Yang Deficiency Syndrome Was Associated with Intestinal Mucosal Microbiota and Immune Barrier.J Inflamm Res. 2025 Aug 4;18:10467-10487. doi: 10.2147/JIR.S518370. eCollection 2025. J Inflamm Res. 2025. PMID: 40787254 Free PMC article.
-
External damp environment aggravates diarrhea in spleen deficiency and dampness syndrome in mice: involvement of small intestinal contents microbiota, energy metabolism, gastrointestinal and fluid functions.Front Cell Infect Microbiol. 2024 Oct 31;14:1495311. doi: 10.3389/fcimb.2024.1495311. eCollection 2024. Front Cell Infect Microbiol. 2024. PMID: 39544280 Free PMC article.
-
Effects of Tanreqing injection on the gut microbiota in healthy volunteers.Front Cell Infect Microbiol. 2024 Oct 4;14:1428476. doi: 10.3389/fcimb.2024.1428476. eCollection 2024. Front Cell Infect Microbiol. 2024. PMID: 39431053 Free PMC article.
-
Dietary supplement of Acanthopanax senticosus decoction formula improves immune response via intestine flora of rabbits.Front Microbiol. 2025 Mar 4;16:1508280. doi: 10.3389/fmicb.2025.1508280. eCollection 2025. Front Microbiol. 2025. PMID: 40104594 Free PMC article.
-
The Role of Gut Microbiota on Intestinal Fibrosis in Inflammatory Bowel Disease and Traditional Chinese Medicine Intervention.J Inflamm Res. 2025 May 7;18:5951-5967. doi: 10.2147/JIR.S504827. eCollection 2025. J Inflamm Res. 2025. PMID: 40357383 Free PMC article. Review.
References
-
- Sitkin S.I., Tkachenko E.I., Vakhitov T.Y. Metabolic dysbiosis of the gut microbiota and its biomarkers. Eksp Klin Gastroenterol. 2016;12:6–29. - PubMed
LinkOut - more resources
Full Text Sources
