. 2024 Aug 3;10(15):e35789.
doi: 10.1016/j.heliyon.2024.e35789. eCollection 2024 Aug 15.

Differential effect of asparagine and glutamine removal on three adenocarcinoma cell lines

Affiliations

Differential effect of asparagine and glutamine removal on three adenocarcinoma cell lines

Greta Pessino et al. Heliyon. .

Abstract

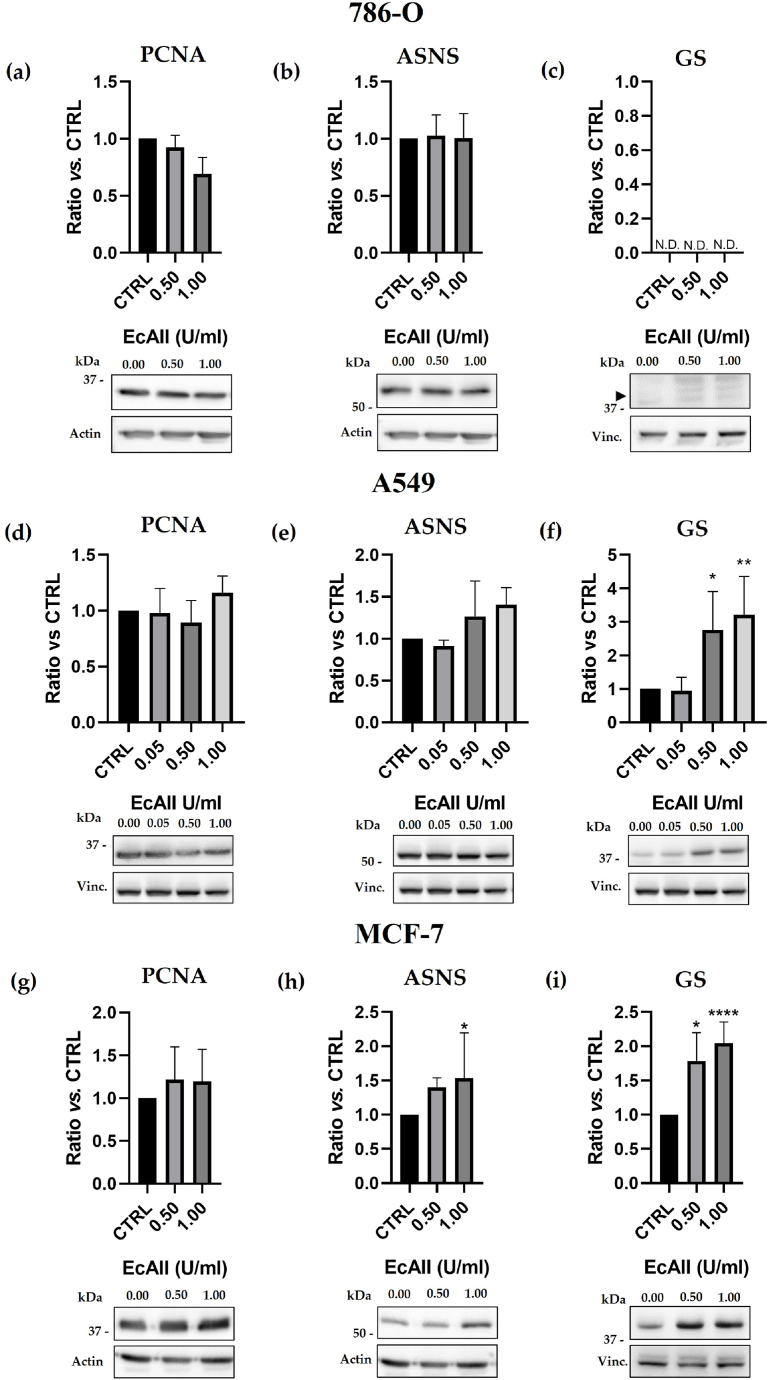
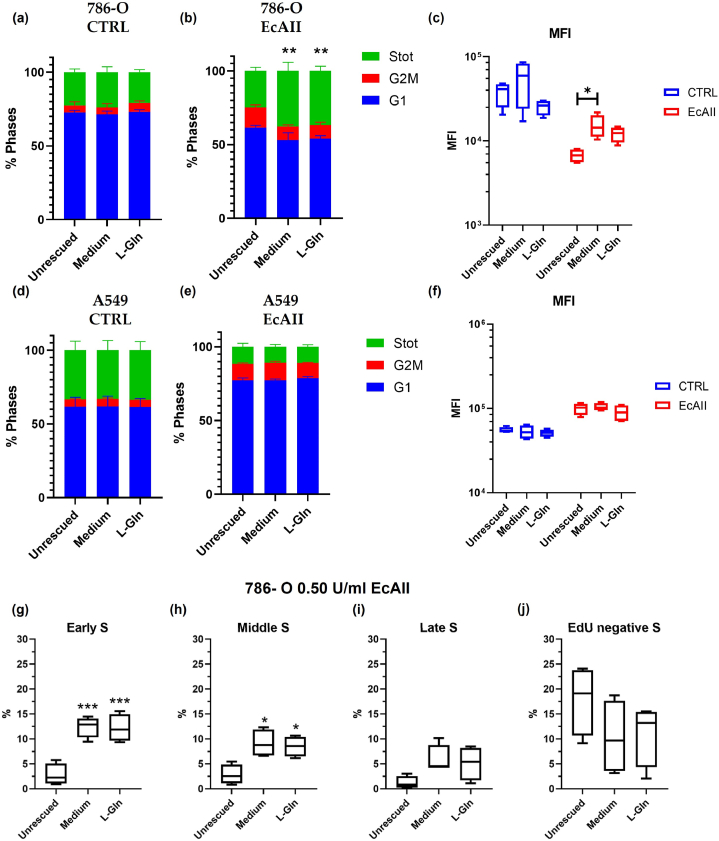
Asparagine and glutamine depletion operated by the drug Asparaginase (ASNase) has revolutionized therapy in pediatric patients affected by Acute Lymphoblastic Leukemia (ALL), bringing remissions to a remarkable 90 % of cases. However, the knowledge of the proproliferative role of asparagine in adult and solid tumors is still limited. We have here analyzed the effect of ASNase on three adenocarcinoma cell lines (A549, lung adenocarcinoma, MCF-7, breast cancer, and 786-O, kidney cancer). In contrast to MCF-7 cells, 786-O and A549 cells proved to be a relevant target for cell cycle perturbation by asparagine and glutamine shortage. Indeed, when the cell-cycle was analyzed by flow cytometry, A549 showed a canonical response to asparaginase, 786-O cells, instead, showed a reduction of the percentage of cells in the G1 phase and an increase of those in the S-phase. Despite an increased number of PCNA and RPA70 positive nuclear foci, BrdU and EdU incorporation was absent or strongly delayed in treated 786-O cells, thus indicating a readiness of replication forks unmatched by DNA synthesis. In 786-O asparagine synthetase was reduced following treatment and glutamine synthetase was totally absent. Interestingly, DNA synthesis could be recovered by adding Gln to the medium. MCF-7 cells showed no significant changes in the cell cycle phases, in DNA-bound PCNA and in total PCNA, but a significant increase in ASNS and GS mRNA and protein expression. The collected data suggest that the effect observed on 786-O cells following ASNase treatment could rely on mechanisms which differ from those well-known and described for leukemic blasts, consisting of a complete block in the G1/S transition in proliferating cells and on an increase on non-proliferative (G0) blasts.

Keywords: Adenocarcinoma; Asparaginase; Asparagine synthetase; Breast carcinoma; Cell cycle; Glutamine synthetase; Renal cell carcinoma; Solid tumors.


Conflict of interest statement

The authors declare the following financial interests/personal relationships which may be considered as potential competing interests:Maristella Maggi has patent A HIGHLY STABLE, PROTEASE-RESISTANT E. COLI ASPARAGINASE issued to University of Pavia. Claudia Scotti has patent A HIGHLY STABLE, PROTEASE-RESISTANT E. COLI ASPARAGINASE issued to University of Pavia. If there are other authors, they declare that they have no known competing financial interests or personal relationships that could have appeared to influence the work reported in this paper.

Figures

Fig. 1
Fig. 1
Proliferation and cell cycle analysis of 786-O, A549 and MCF-7 cells treated with 0.00–0.05–0.50 - 1.00 U/ml EcAII for 72 h. Panels (a)–(c) proliferation rate of 786-O, A549 and MCF-7 cells. Panels (d) and (e) clonogenic assay of 786-O and A549 cells. Panels (f)–(h) 786-O, A549 and MCF-7 cell cycle phases distribution. The Stot gating represents cells with a DNA content between 2n and 4n, both positive and negative for EdU, excluding cells gated in G1 and G2/M. Panels (i)–(k) Median Fluorescence Intensity (MFI) of EdU positive cells in 786-O, A549 and MCF-7 cells, respectively. Data were normalized for the untreated CTRL (MFI at 0.00 U/ml = 1). n = 7, *p < 0.05; ** p<0.01; ***p < 0.001.
Fig. 2
Fig. 2
Immunofluorescence (IF) analysis. Panel (a) Representative images of control (CTRL) or treated with 1 U/ml EcAII 786-O, A549 and MCF-7 cells stained for nuclear PCNA. Hoechst: blue, PCNA: green. Panels (b)–(d) Nuclear PCNA quantification in 786-O, A549 and MCF-7 cells. Data are reported as percentages of PCNA positive cells on total counted cells (n = 3). Panel (e) Representative images of 786-O, A549 and MCF-7 cells control (CTRL) or treated with 1 U/ml EcAII and stained for BrdU (green), RPA70 (red) and nuclei (blue). Nuclei counted: 786-O CTRL, 39; 786-O 1U/ml EcAII 14; A549 CTRL, 71; A549 1 U/ml EcAII 48; MCF-7 CTRL, 65; MCF-7 1 U/ml EcAII, 54. Panels (f)–(h) Quantification of RPA70 foci in control (CTRL) 786-O cells or treated with 1 U/ml EcAII. n = 3. *: p < 0.05, **: p < 0.01, ***: p < 0.001, ****: p < 0.0001.
Fig. 3
Fig. 3
EdU Continuous Fluorescence Intensity (CFI) analysis of 786-O cells. Panel (a) and panel (b) Percentage distribution of cells into zero generation G1, zero generation G2 and EdU+ in untreated cells and cells treated with 1 U/ml EcAII, respectively. Panel (c) Peak Fluorescence Intensity (PFI) increment in untreated cells (CTRL, circle) and cells treated with 1 U/ml EcAII for 48h (square). Lines represent linear regression in the curve linear phase (1–9 h). Data were normalized for the internal zero (PFI at 1 h), (n = 4).
Fig. 4
Fig. 4
Western blot analysis of PCNA (panels (a), (d), (g)), ASNS (panels (b), (e), (h)) and GS (panels (c), (f), (i)). Representative Western blot membranes for Asparagine synthetase (ASNS), Glutamine synthetase (GS), PCNA, actin or vinculin (Vinc.) are reported in each panel. Densitometric analysis for each target protein is reported in each panel. Data are normalized for the untreated control (CTRL). N.D. indicates “Not Detectable”. ► indicates the expected molecular weight for GS. n = 4, *: p < 0.05; **: p < 0.01, ****: p < 0.0001. Full, non-adjusted images are provided as supplementary material.
Fig. 5
Fig. 5
786-O and A549 cells rescue with complete medium (Medium) or 2 mM L-Gln (L-Gln) after EcAII treatment. Panels (a) and (b) and (d) and (e): Cell cycle analysis of control samples and samples treated with 0.50 U/ml EcAII (786-O) or 1.00 U/ml (A549), respectively. Panels (c) and (f) MFI analysis of control (blue) and EcAII-treated (red) samples.786-O and A549 cells, respectively. Panels (g) to (j) S phase analysis in EcAII-treated samples. n = 4, *: p < 0.05; **: p < 0.01, ***: p < 0.001.

References

    1. Lomelino C.L., Andring J.T., McKenna R., Kilberg M.S. Asparagine synthetase: function, structure, and role in disease. J. Biol. Chem. 2017;292:19952–19958. doi: 10.1074/JBC.R117.819060. - DOI - PMC - PubMed
    1. Shan J., Lopez M.C., Baker H.V., Kilberg M.S. Expression profiling after activation of amino acid deprivation response in HepG2 human hepatoma cells. Physiol. Genomics. 2010;41:315–327. doi: 10.1152/PHYSIOLGENOMICS.00217.2009. - DOI - PMC - PubMed
    1. Balasubramanian M.N., Butterworth E.A., Kilberg M.S. Asparagine synthetase: regulation by cell stress and involvement in tumor biology. Am. J. Physiol. Endocrinol. Metab. 2013;304 doi: 10.1152/AJPENDO.00015.2013. - DOI - PMC - PubMed
    1. Zhang J., Fan J., Venneti S., Cross J.R., Takagi T., Bhinder B., Djaballah H., Kanai M., Cheng E.H., Judkins A.R., Pawel B., Baggs J., Cherry S., Rabinowitz J.D., Thompson C.B. Asparagine plays a critical role in regulating cellular adaptation to glutamine depletion. Mol. Cell. 2014;56:205–218. doi: 10.1016/J.MOLCEL.2014.08.018. - DOI - PMC - PubMed
    1. Pavlova N.N., Hui S., Ghergurovich J.M., Fan J., Intlekofer A.M., White R.M., Rabinowitz J.D., Thompson C.B., Zhang J. As extracellular glutamine levels decline, asparagine becomes an essential amino acid. Cell Metab. 2018;27:428–438.e5. doi: 10.1016/J.CMET.2017.12.006. - DOI - PMC - PubMed

LinkOut - more resources