. 2024 May 29;9(7):845-864.
doi: 10.1016/j.jacbts.2024.02.012. eCollection 2024 Jul.

Human Aortic Stenotic Valve-Derived Extracellular Vesicles Induce Endothelial Dysfunction and Thrombogenicity Through AT1R/NADPH Oxidases/SGLT2 Pro-Oxidant Pathway

Affiliations

Human Aortic Stenotic Valve-Derived Extracellular Vesicles Induce Endothelial Dysfunction and Thrombogenicity Through AT1R/NADPH Oxidases/SGLT2 Pro-Oxidant Pathway

Sandy Hmadeh et al. JACC Basic Transl Sci. .

Abstract

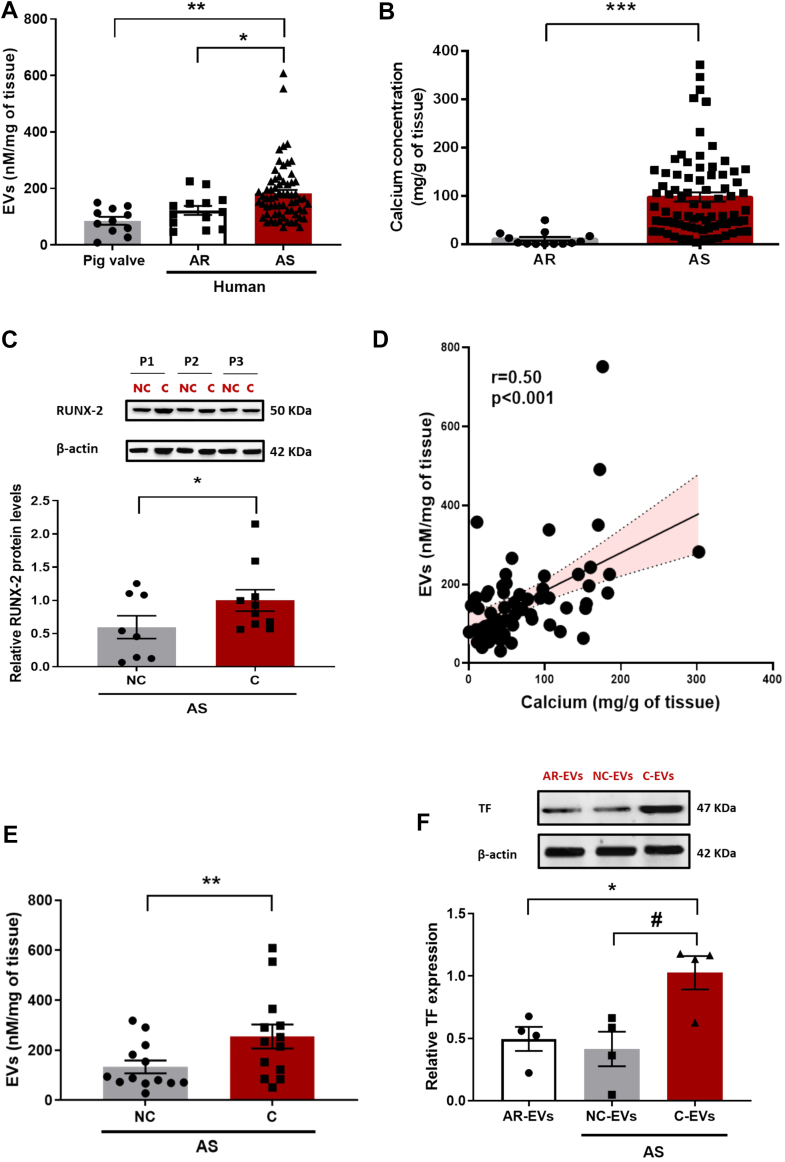
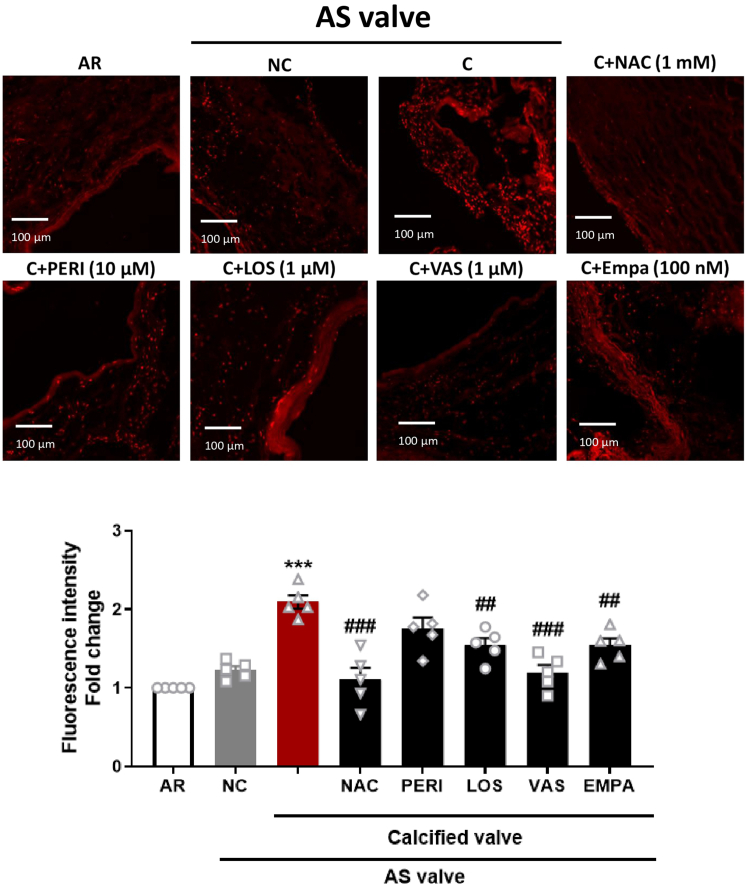
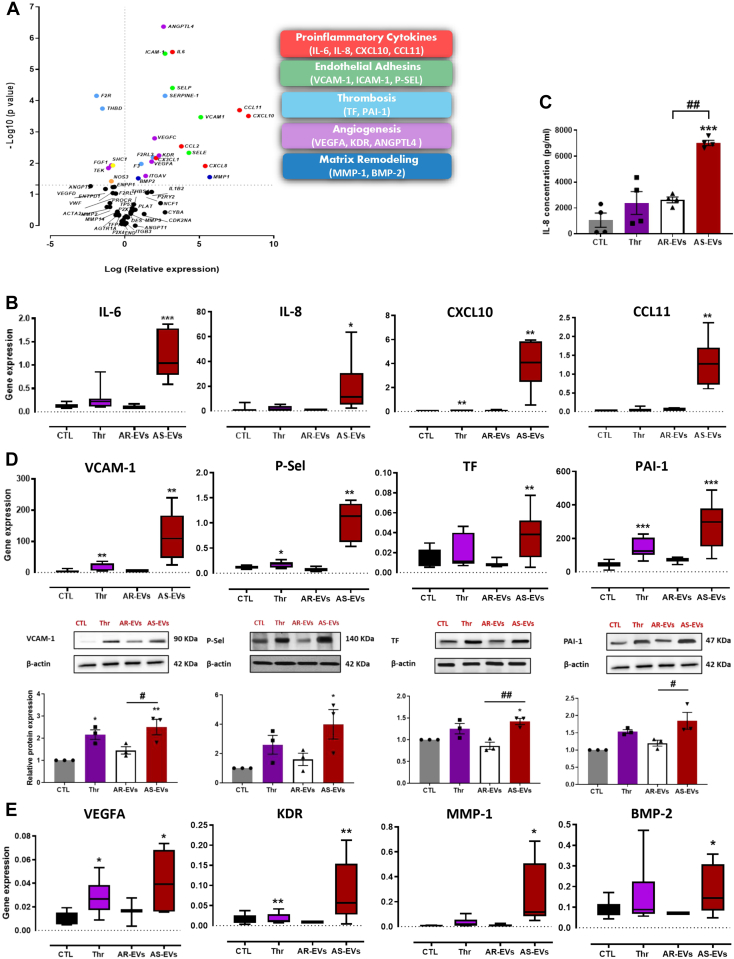
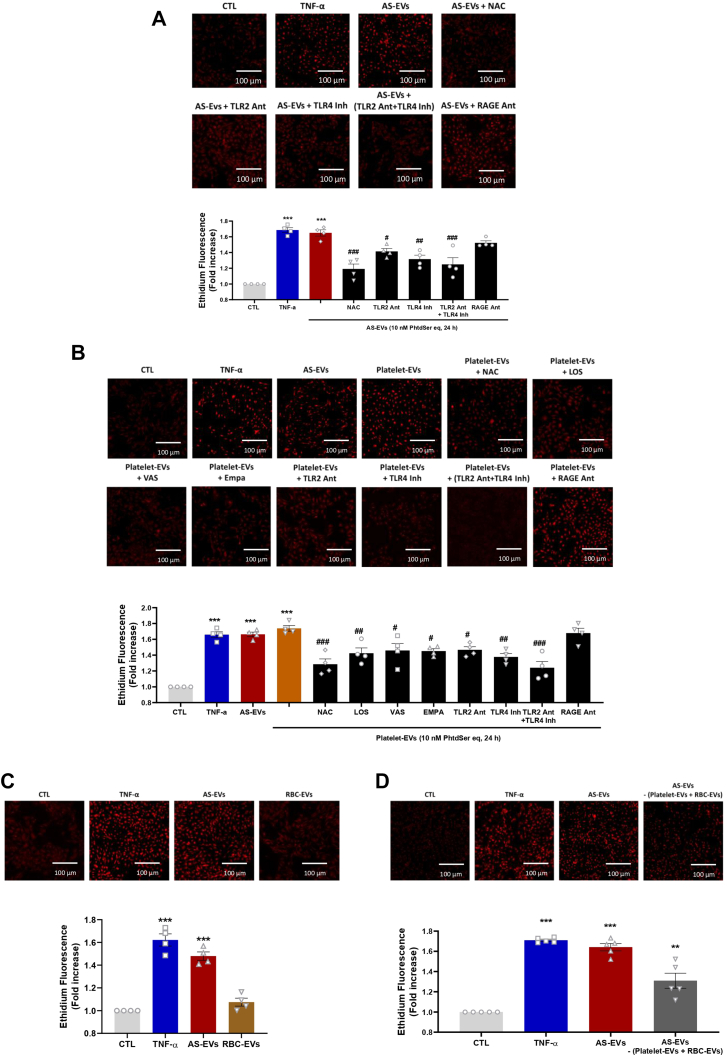
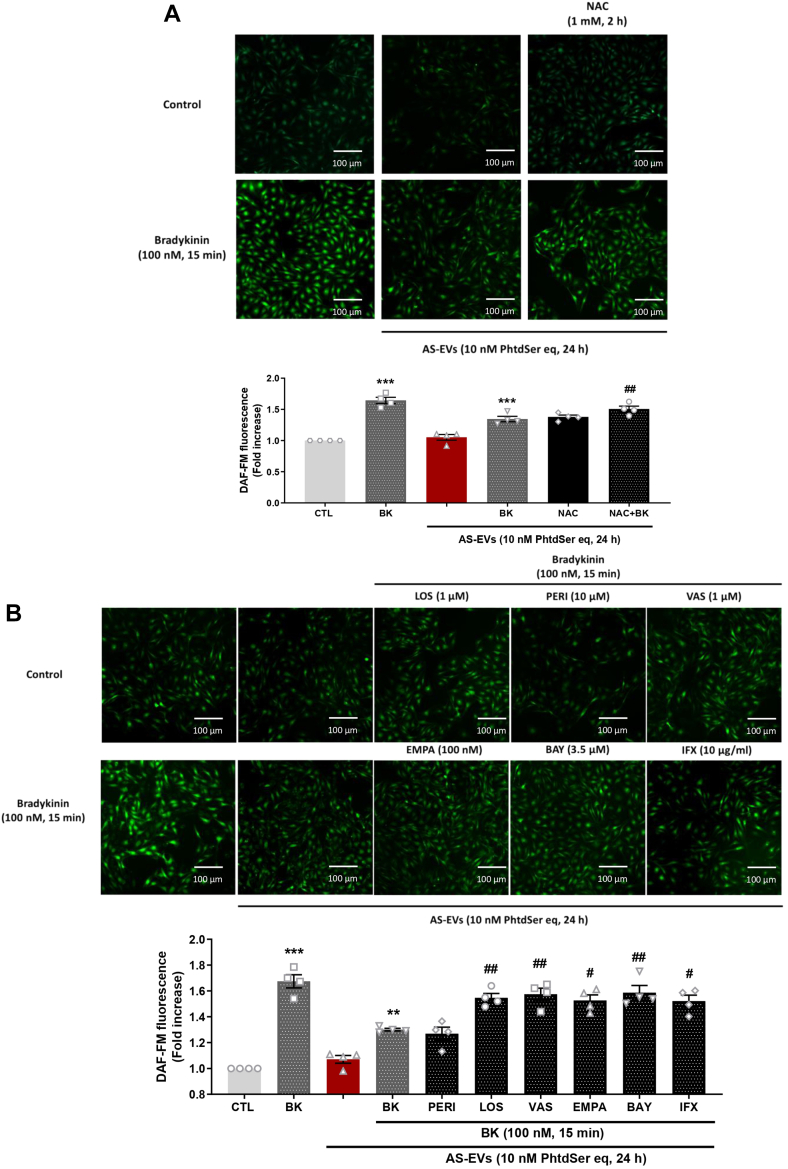
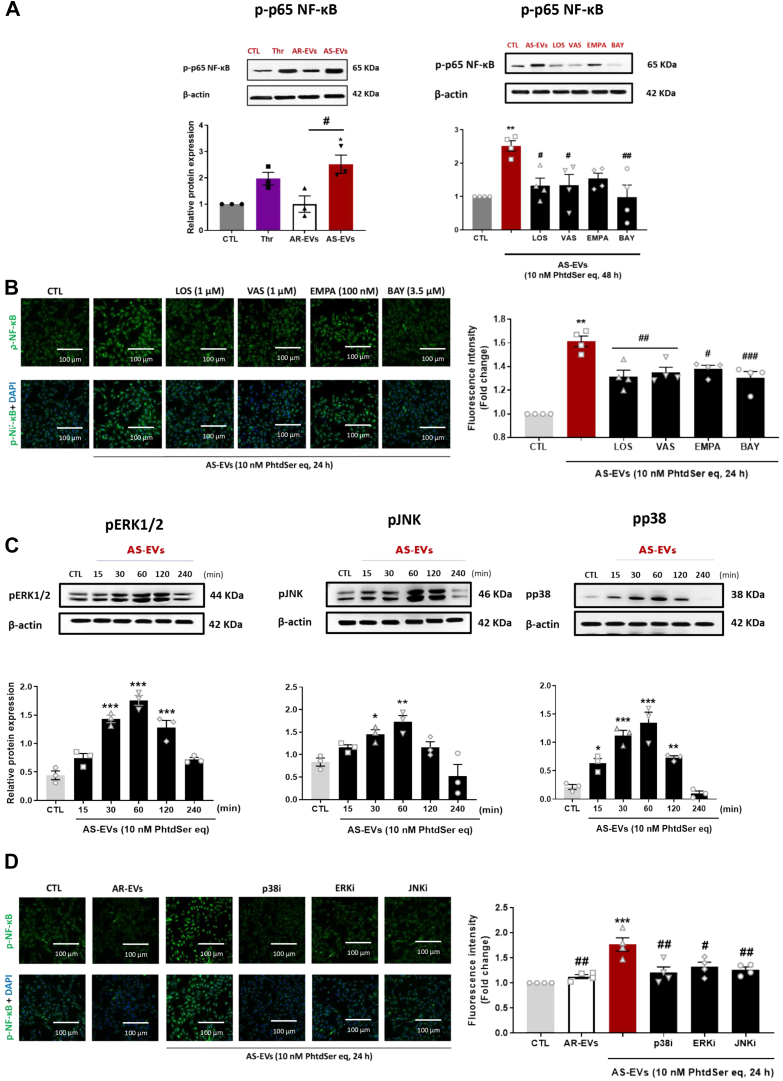
Pathological tissues release a variety of factors, including extracellular vesicles (EVs) shed by activated or apoptotic cells. EVs trapped within the native pathological valves may act as key mediators of valve thrombosis. Human aortic stenosis EVs promote activation of valvular endothelial cells, leading to endothelial dysfunction, and proadhesive and procoagulant responses.

Keywords: SGLT2i; SVD; TAVI; TAVR; aortic stenosis; extracellular vesicles; inflammation; leaflet; microparticles; thrombosis.


Conflict of interest statement

This work was supported by an unrestricted research grant by the Groupe pour l’Enseignement de la Recherche Cardio-vasculaire en Alsace, France. The authors have reported that they have no relationships relevant to the contents of this paper to disclose.

Figures

None
Graphical abstract
Figure 1
Figure 1
EVs Release in Human Pathological Valves (A) Shedding of extracellular vesicles (EVs) (nmol/L eTPES/mg of tissue) in human aortic stenosis (AS) valves (n = 65) compared with human aortic regurgitation (AR) valves (n = 13) and porcine healthy valves (n = 11). Data are expressed as mean ± SEM; ∗P < 0.05, ∗∗P < 0.01, vs AS (multiple Student’s unpaired t-tests). (B) Calcium concentration in AS valves (n = 78) compared with AR valves (n = 13). Data are expressed as mean ± SEM; ∗∗∗P < 0.001 vs AR (Student’s unpaired t-test). (C) RUNX-2 protein expression in the calcified (C) vs the noncalcified (NC) part of the AS valve (n = 8). Data are expressed as mean ± SEM; ∗P < 0.05 vs the C part (Student’s paired t-test). (D) Correlation between shedding of EVs (nmol/L eqPS/mg of tissue) and calcium concentration (mg/tissue) of AS valves (n = 62) (Pearson’s correlation). (E) Shedding of EVs (nmol/L eqPS/mg of tissue) in the C vs the NC part of the valve (n = 13). Data are expressed as mean ± SEM; ∗∗P < 0.01 vs the C part (Student’s paired t-test). (F) TF protein expression in EVs extracted from the C part compared with EVs from the NC part of AS valve and AR. Results represent blots (upper), and corresponding cumulative data (lower). Data are expressed as mean ± SEM; ∗P < 0.05 vs AR, #P < 0.05 vs NC. All comparisons were performed by repeated measures analysis of variance followed by Tukey’s post hoc analyses.
Figure 2
Figure 2
Oxidative Stress in the Human Pathological Valves AR valves, and calcified and noncalcified segments of AS valves were exposed to dihydroethidium staining by confocal microscopy (n = 5). The calcified segments of the AS valves were incubated with N-acetylcysteine (NAC) (1 mmol/L) for 2 hours and either with VAS-2870 (1 μmol/L), losartan (LOS) (1 μmol/L), perindoprilat (PERI) (10 μmol/L), or empagliflozin (EMPA) (100 nmol/L) for 30 minutes before the subsequent determination of dihydroethidium staining by confocal microscope. Results are shown as micrography of dihydroethidium staining (upper and left) and corresponding cumulative data (lower and right). Data are expressed as mean ± SEM of 5 different patients; ∗∗∗P < 0.001 vs AR and ##P < 0.01, ###P < 0.001 vs the C part. All comparisons were performed by 1-way analysis of variance followed by Tukey’s post hoc analyses. Abbreviations as in Figure 1.
Figure 3
Figure 3
Effect of AS-EVs on VECs (A) Volcano plot showing the distribution of relative gene expression (log of fold changes) and P values (log10) in VECs stimulated with AS-EVs compared with control cells (CTL). (B) Boxplots showing the gene expression of IL-6, IL-8, CXCL10, and CCL11, in VECs treated with thrombin (Thr), AS-EVs, and AR-EVs. (C) Enzyme-linked immunosorbent assay showing an increase in IL-8 secretion in the supernatant of AS-EV–treated valvular interstitial cells (VECs). (D) Boxplots showing gene expression and respective blots showing protein expression of VCAM-1, P-SEL, TF, and PAI-1 in VECs treated with Thr, AS-EVs, and AR-EVs. (E) Boxplots showing the gene expression of VEGFA, KDR, MMP-1, and BMP-2 in VECs treated with Thr, AR-EVs, and AR-EVs. Data are expressed as mean ± SEM on experiments performed on 3 to 6 different cultures; ∗P < 0.05, ∗∗P < 0.01, ∗∗∗P < 0.001 vs CTL and ##P < 0.01, ###P < 0.001 vs AS-EVs. Comparisons were performed by 1-way analysis of variance followed by Tukey’s post hoc analyses and multiple Student’s paired t-tests. Abbreviations as in Figure 1.
Figure 4
Figure 4
ROS Formation in VECs Exposed to EVs (A and B) Levels of oxidative stress as measured by ethidium fluorescence in VECs exposed to EVs (10 nmol/L phosphatidylserine equivalent [PhtdSer eq]) and TNF-α (10 ng/mL) after 30 minutes and 24 hours. NAC (1 μmol/L), perindoprilat (10 μmol/L), LOS (1 μmol/L), VAS-2870 (1 mmol/L), EMPA (100 nmol/L), and BAY 11-7082 (3.5 μmol/L) were used to reduce the pro-oxidant responses to AS-EVs. (C) VECs exposed for 48 hours to EVs (10 nmol/L PhtdSer eq) and thrombin (1 U/mL) and either LOS (1 μmol/L), VAS-2870 (1 μmol/L), EMPA (100 nmol/L), or BAY 11-7082 (3.5 μmol/L) for 30 minutes before the addition of AS-EVs and the subsequent determination of the expression level of target proteins by Western blot analysis. Data are expressed as mean ± SEM on 3 to 4 different cultures; ∗P < 0.05, ∗∗P < 0.01, ∗∗∗P < 0.001 vs CTL and #P < 0.05, ##P < 0.01 vs AS-EVs (A, B, and D) vs AR-EVs (C). All comparisons were performed using 1-way analysis of variance followed by Tukey’s post hoc analyses. ROS = reactive oxygen species; other abbreviations as in Figures 1, 2, and 3.
Figure 5
Figure 5
Oxidative Stress in VECs Exposed to Platelet-EVs and RBC-EVs (A) Levels of oxidative stress as measured by ethidium fluorescence in VECs exposed to AS-EVs (10 nmol/L PhtdSer eq) and TNF-α (10 ng/mL) after 24 hours. NAC (1 mmol/L), TLR2 antagonist (Ant) (100 μmol/L), TLR4 inhibitor (Inh) (10 μmol/L), and RAGE antagonist (1 mmol/L) were used to reduce the pro-oxidant responses to AS-EVs. (B) VECs exposed to platelet-EVs (10 nmol/L PhtdSer eq) and TNF-α (10 ng/mL) after 24 hours. NAC (1 mmol/L), LOS (1 μmol/L), VAS-2870 (1 μmol/L), EMPA (100 nmol/L), TLR2 antagonist (100 μmol/L), TLR4 inhibitor (10 μmol/L), and RAGE antagonist (1 mmol/L) were used to reduce the pro-oxidant responses to platelet-EVs. (C and D) VECs exposed to red blood cell (RBC)-EVs and Depleted-EVs (10 nmol/L PhtdSer eq) and TNF-α (10 ng/mL) after 24 hours. Data are expressed as mean ± SEM of 4 different cultures; ∗P < 0.05, ∗∗P < 0.01, ∗∗∗P < 0.001 vs CTL and #P < 0.05, ##P < 0.01, ###P < 0.001 vs AS-EVs (A) and vs platelet-EVs (B). All comparisons were performed using 1-way analysis of variance followed by Tukey’s post hoc analyses. Abbreviations as in Figures 1, 2, 3and 4.
Figure 6
Figure 6
NO Formation in VECs Exposed to AS-EVs (A) VECs studied at passage 1 demonstrated down-regulation of bradykinin-stimulated nitric oxide (NO) formation as assessed by DAF-FM in response to AS-EVs (10 nmol/L PhtdSer eq, 24 hours). (A and B) NAC (1 mmol/L), LOS (1 μmol/L), VAS-2870 (1 μmol/L), EMPA (100 nmol/L), and BAY 11-7082 (3.5 μmol/L) preserved bradykinin-stimulated NO formation. Data are expressed as mean ± SEM on experiments performed on 4 different cultures; ∗∗∗P < 0.001 vs control CTL, #P < 0.05, ##P < 0.01, ###P < 0.001 vs AS-EVs + bradykinin. All comparisons were performed using 1-way analysis of variance followed by Tukey’s post hoc analyses. Abbreviations as in Figures 1, 2, 3and 4.
Figure 7
Figure 7
AS-EVs Activate the MAPK Pathways and Phosphorylate NF-κ B (A, B) Phosphorylation of NF-κB in VECs exposed to AS-EVs (10 nmol/L PhtdSer eq), thrombin (1 U/mL), and after pretreatment with either LOS (1 μmol/L), VAS-2870 (1 μmol/L), EMPA (100 nmol/L), or BAY 11-7082 (3.5 μmol/L) for 30 minutes before the addition of AS-EVs and measured by Western blot analysis and immunostaining. (C) VECs were treated with AS-EVs (10 nmol/L PhtdSer eq) for the indicated time before determination of the phosphorylation level of ERK1/2, JNK, and p38 MAPK. (D) VECs were exposed to a selective inhibitor of either p38 MAPK (p38i, SB203580, 10 μmol/L), ERK1/2 (ERKi, PD98059, 10 μmol/L) JNK (JNKi, SP600125, 10 μmol/L), for 30 minutes in the presence of AS-EVs (10 nmol/L PhtdSer eq) for 24 hours. Data are expressed as mean ± SEM of experiments performed on 3 to 4 different cultures; ∗P < 0.05, ∗∗P < 0.01, ∗∗∗P < 0.001 vs control (CTL), and #P < 0.05, ##P < 0.01 vs AS-EVs. All comparisons were performed using 1-way analysis of variance followed by Tukey’s post hoc analyses. Abbreviations as in Figures 1, 2, 3and 4.
Figure 8
Figure 8
Effect of AS-EVs on THP-1 Cell Adherence and Thrombin Generation in VECs (A) VECs exposed to TNF-α (10 ng/mL) and AS-EVs (10 nmol/L PhtdSer eq) for 24 hours demonstrated increased THP-1 adherent cell count. LOS (1 μmol/L), VAS-2870 (1 μmol/L), EMPA (100 nmol/L), and BAY 11-7082 (3.5 μmol/L) exhibited diminished AS-EV–mediated THP-1 adherence. Data are expressed as mean ± SEM of experiments performed on 4 to 5 different cultures. ∗∗P < 0.01, ∗∗∗P < 0.001 vs CTL and ##P < 0.01, ###P < 0.001 vs AS-EVs (1-way analysis of variance followed by Tukey’s post hoc analysis). (B) Thrombin generation was measured in VECs upon the exposure to EVs (10 nmol/L PhtdSer eq) and TNF-α (10 ng/mL) (upper left). AS-EV–mediated thrombin generation in VECs was measured after the exposure to TF neutralizing antibody (10 μg/mL), dabigatran (10 μmol/L), and rivaroxaban (10 μmol/L) (upper right), and LOS (1 μmol/L), VAS-2870 (1 μmol/L), EMPA (100 nmol/L), and BAY 11-7082 (3.5 μmol/L) (bottom). Data are expressed as mean ± SEM of experiments performed on 4 to 5 different cultures. ∗∗∗P < 0.001 vs CTL and #P < 0.05, ##P < 0.01, ###P < 0.001 vs AS-EVs. Comparisons were performed by 1-way analysis of variance followed by Tukey’s post hoc analyses and multiple Student’s paired t-tests. Abbreviations as in Figures 1, 2, 3and 4.

References

    1. Goody P.R., Hosen M.R., Christmann D., et al. Aortic valve stenosis. Arterioscler Thromb Vasc Biol. 2020;40(4):885–900. - PubMed
    1. Lindman B.R., Clavel M.A., Mathieu P., et al. Calcific aortic stenosis. Nat Rev Dis Primer. 2016;2 - PMC - PubMed
    1. Trimaille A., Hmadeh S., Matsushita K., Marchandot B., Kauffenstein G., Morel O. Aortic stenosis and the hemostatic system. Cardiovasc Res. 2023;119(6):1310–1323. - PubMed
    1. Sellers S.L., Turner C.T., Sathananthan J., et al. Transcatheter aortic heart valves: histological analysis providing insight to leaflet thickening and structural valve degeneration. JACC Cardiovasc Imaging. 2019;12(1):135–145. - PubMed
    1. Hein M., Schoechlin S., Schulz U., et al. Long-term follow-up of hypoattenuated leaflet thickening after transcatheter aortic valve replacement. JACC Cardiovasc Interv. 2022;15(11):1113–1122. - PubMed

LinkOut - more resources