. 2024 Aug 7:11:1411374.
doi: 10.3389/fnut.2024.1411374. eCollection 2024.

Characteristics of stachyose-induced effects on gut microbiota and microbial metabolites in vitro associated with obesity in children

Affiliations

Characteristics of stachyose-induced effects on gut microbiota and microbial metabolites in vitro associated with obesity in children

Xionge Pi et al. Front Nutr. .

Abstract

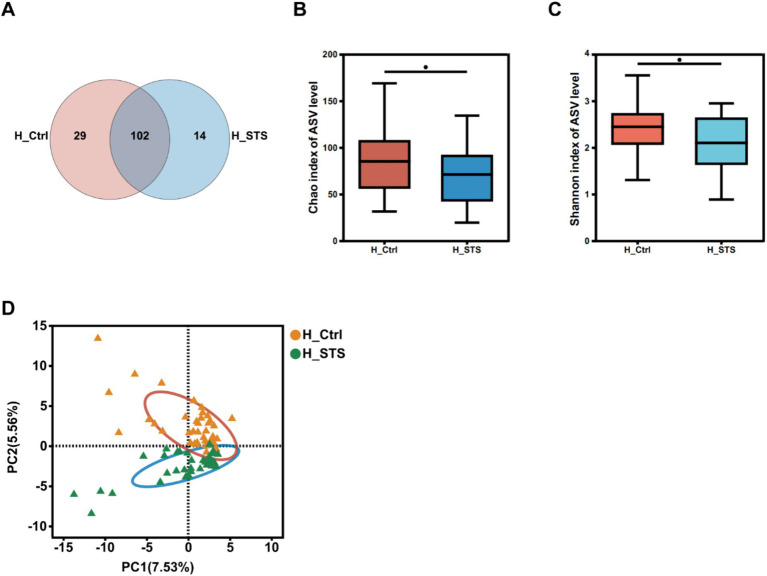
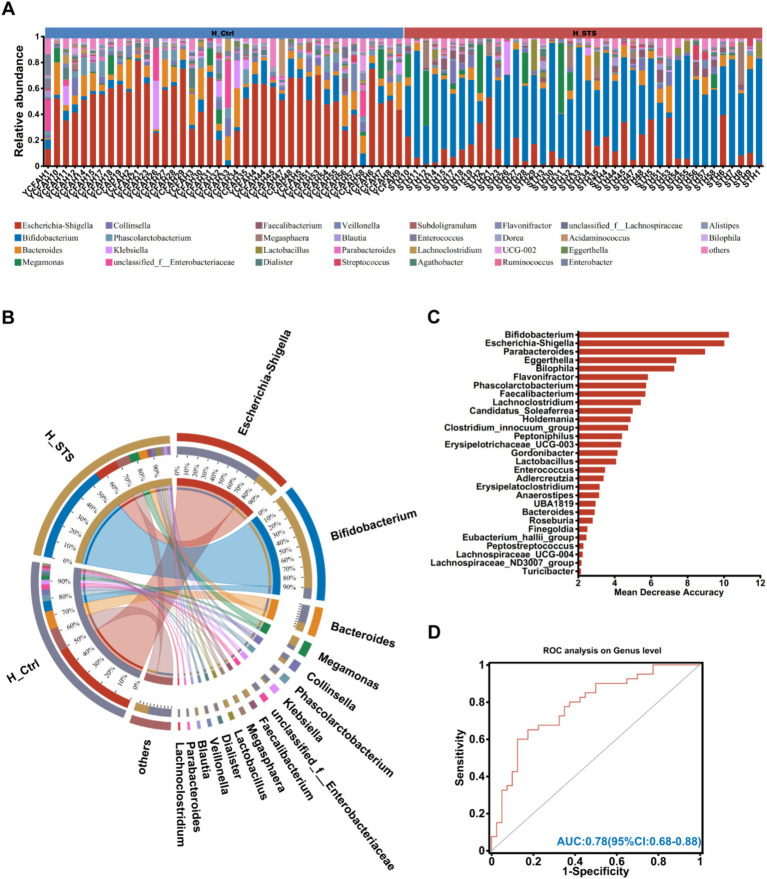
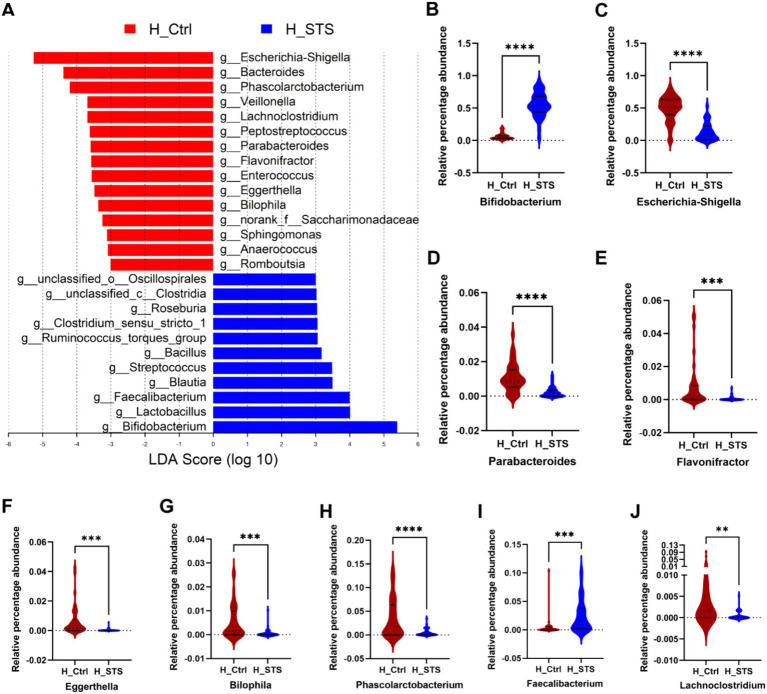
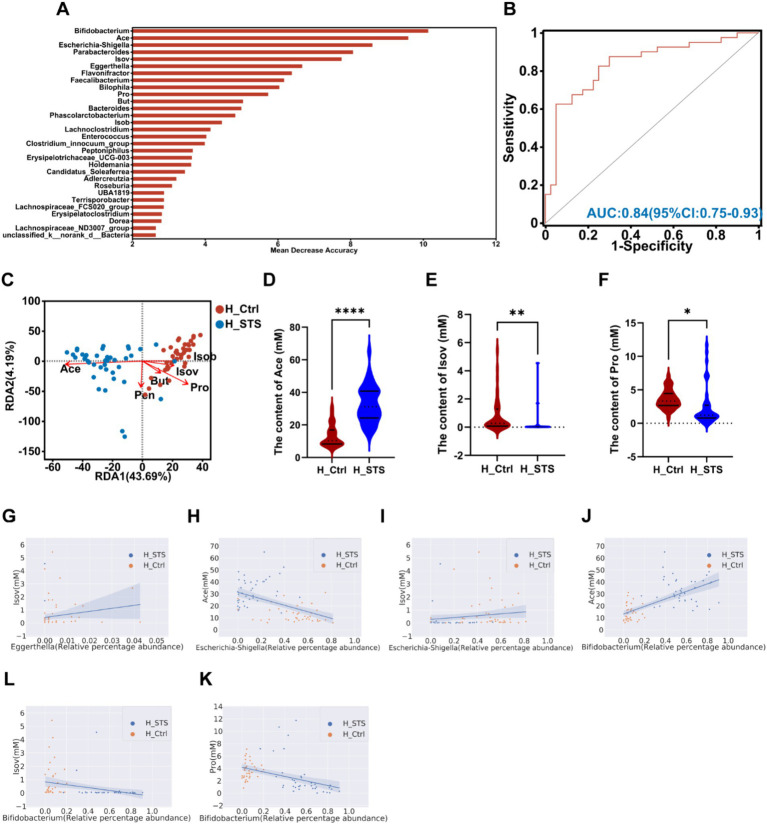
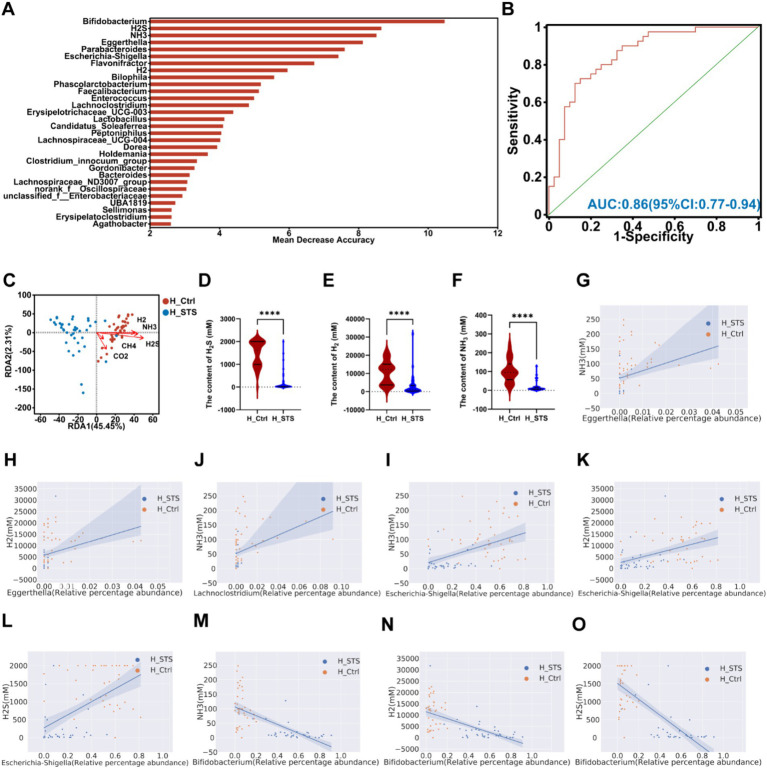
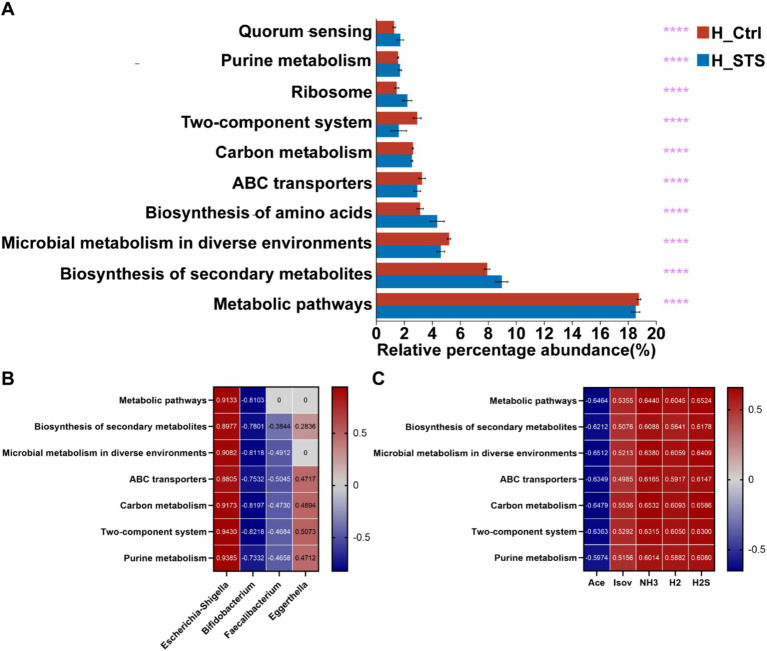
Childhood obesity presents a serious health concern associated with gut microbiota alterations. Dietary interventions targeting the gut microbiota have emerged as promising strategies for managing obesity in children. This study aimed to elucidate the impact of stachyose (STS) supplementation on the gut microbiota composition and metabolic processes in obese children. Fecal samples were collected from 40 obese children (20 boys and 20 girls) aged between 6 and 15 and in vitro fermentation was conducted with or without the addition of STS, respectively, followed by 16S rRNA amplicon sequencing and analysis of short-chain fatty acids (SCFAs) and gases. Notably, our results revealed that STS supplementation led to significant alterations in gut microbiota composition, including an increase in the abundance of beneficial bacteria such as Bifidobacterium and Faecalibacterium, and a decrease in harmful bacteria including Escherichia-Shigella, Parabacteroides, Eggerthella, and Flavonifractor. Moreover, STS supplementation resulted in changes in SCFAs production, with significant increases in acetate levels and reductions in propionate and propionate, while simultaneously reducing the generation of gases such as H2S, H2, and NH3. The Area Under the Curve (AUC)-Random Forest algorithm and PICRUSt 2 were employed to identify valuable biomarkers and predict associations between the gut microbiota, metabolites, and metabolic pathways. The results not only contribute to the elucidation of STS's modulatory effects on gut microbiota but also underscore its potential in shaping metabolic activities within the gastrointestinal environment. Furthermore, our study underscores the significance of personalized nutrition interventions, particularly utilizing STS supplementation, in the management of childhood obesity through targeted modulation of gut microbial ecology and metabolic function.

Keywords: children; gut microbiota; microbial metabolites; obesity; prebiotics; stachyose.


Conflict of interest statement

The authors declare that the research was conducted in the absence of any commercial or financial relationships that could be construed as a potential conflict of interest.

Figures

Figure 1
Figure 1
Diversity of gut microbiota. (A) The Venn diagram, based on ASV levels, illustrates the number of genera in the H_Ctrl (orange) and H_STS (blue) groups, as well as the common genera (purple) between the two groups. α-diversity in the H_Ctrl and H_STS groups, assessed using the (B) Chao index (p = 0.03766) and (C) Shannon index (p = 0.03075), is displayed with significance indicated by asterisks (*0.01 < p ≤ 0.05; **0.001 < p ≤ 0.01; ***0.0001 < p ≤ 0.001; ****p ≤ 0.0001). (D) β-diversity at the genus level is visualized through PCA (p = 0.001) comparing the H_Ctrl and H_STS groups.
Figure 2
Figure 2
Composition of gut microbiota. (A) The community bar plot analysis at the genus level visually represents the relative abundance of gut microbiota in individual samples from the H_Ctrl and H_STS groups. (B) Circos analysis at the genus level offers a comprehensive view of the abundance relationship between samples and bacterial communities. (C) The bar plot illustrates the variable importance of gut microbiota at the genus level, constructed through random forest. (D) The performance of the model candidates is evaluated using ROC analysis of gut microbiota at the genus level, with AUC values indicating diagnostic accuracy. AUC ≤ 0.5 signifies no diagnostic value, AUC = 0.5 ~ 0.7 indicates low accuracy, AUC = 0.7 ~ 0.9 suggests a certain degree of accuracy, and AUC ≥ 0.9 indicates high accuracy.
Figure 3
Figure 3
Difference of gut microbiota. (A) Gut microbiota comparisons at the genus level between the H_Ctrl and H_STS groups are examined using LEfSe (LDA > 3, p < 0.05). (B–J) The relative percentage abundance differences of the top 9 variables, importance of gut microbiota at the genus level in Figure 2C, are illustrated. Significance thresholds are denoted by asterisks (*0.01 < p ≤ 0.05; **0.001 < p ≤ 0.01; ***0.0001 < p ≤ 0.001; ****p ≤ 0.0001).
Figure 4
Figure 4
SCFAs levels in the H_Ctrl and H_STS groups. (A) The bar plot displays the variable importance of gut microbiota at the genus level and SCFAs determined through random forest. (B) The ROC analysis evaluates the performance of model candidates based on gut microbiota at the genus level and SCFAs, with AUC values indicating diagnostic accuracy. AUC ≤ 0.5 indicates no diagnostic value, AUC = 0.5 ~ 0.7 indicates low accuracy, AUC = 0.7 ~ 0.9 indicates a certain degree of accuracy, and AUC ≥ 0.9 indicates high accuracy. (C) RDA analysis of SCFAs and samples in the H_Ctrl and H_STS groups. (D–F) Significant differences in SCFAs levels between the H_Ctrl and H_STS groups are shown, with statistical significance thresholds indicated by asterisks (*0.01 < p ≤ 0.05; **0.001 < p ≤ 0.01; ***0.0001 < p ≤ 0.001; ****p ≤ 0.0001). Scatterplots illustrate the significant correlations (cor ≥ 0.5) between SCFAs and gut microbiota. The correlations are as follows: (G) cor = 0.506, p = 1.69e-06; (H) cor = −0.5315, p = 3.93e-07; (I) cor = 0.5129, p = 1.15e-06; (J) cor = 0.696, p = 7.69e-13; (K) cor = −0.6097, p = 1.93e-09; (L) cor = −0.5476, p = 1.47e-07.
Figure 5
Figure 5
Content of gas in different media. (A) The bar plot depicts the variable importance of gut microbiota at the genus level and gases as determined by random forest. (B) The ROC analysis assesses the performance of model candidates based on gut microbiota at the genus level and gases, with AUC values indicating diagnostic accuracy. AUC ≤ 0.5 indicates no diagnostic value, AUC = 0.5 ~ 0.7 indicates low accuracy, AUC = 0.7 ~ 0.9 indicates a certain degree of accuracy, and AUC ≥ 0.9 indicates high accuracy. (C) RDA analysis of gases and samples in the H_Ctrl and H_STS groups. (D–F) Significant differences in gas levels between the H_Ctrl and H_STS groups are presented, with statistical significance thresholds indicated by asterisks (*0.01 < p ≤ 0.05; **0.001 < p ≤ 0.01; ***0.0001 < p ≤ 0.001; ****p ≤ 0.0001). Scatterplots illustrate the significant correlations (cor ≥ 0.5) between gases and gut microbiota. The correlations are as follows: (G) cor = 0.545, p = 1.73e-07; (H) cor = 0.5299, p = 4.31e-07; (I) cor = 0.5221, p = 6.82e-07; (J) cor = 0.554, p = 9.76e-08; (K) cor = 0.5413, p = 2.17e-07; (L) cor = 0.5621, p = 5.77e-08; (M) cor = −0.7368, p = 6.66e-15; (N) cor = −0.6259, p = 5.37e-10; (O) cor = −0.7229, p = 3.69e-14.
Figure 6
Figure 6
PICRUSt 2 analysis and Wilcoxon rank-sum test bar plots. (A) The top 10 metabolic pathways at Level 3, based on KEGG categories, are presented with statistical significance thresholds indicated by asterisks (*0.01 < p ≤ 0.05; **0.001 < p ≤ 0.01; ***0.0001 < p ≤ 0.001; ****p ≤ 0.0001). (B,C) Depict correlation analyses between metabolic pathways and the top 7 relative abundances of gut microbiota at the genus level.

Similar articles

Cited by

References

    1. Jebeile H, Kelly AS, O'Malley G, Baur LA. Obesity in children and adolescents: epidemiology, causes, assessment, and management. Lancet Diabetes Endocrinol. (2022) 10:351–65. doi: 10.1016/S2213-8587(22)00047-X, PMID: - DOI - PMC - PubMed
    1. Turta O, Rautava S. Antibiotics, obesity and the link to microbes-what are we doing to our children? BMC Med. (2016) 14:57. doi: 10.1186/s12916-016-0605-7, PMID: - DOI - PMC - PubMed
    1. Baker JL, Olsen LW, Sorensen TI. Childhood body-mass index and the risk of coronary heart disease in adulthood. N Engl J Med. (2007) 357:2329–37. doi: 10.1056/NEJMoa072515, PMID: - DOI - PMC - PubMed
    1. Juonala M, Magnussen CG, Berenson GS, Venn A, Burns TL, Sabin MA, et al. . Childhood adiposity, adult adiposity, and cardiovascular risk factors. N Engl J Med. (2011) 365:1876–85. doi: 10.1056/NEJMoa1010112 - DOI - PubMed
    1. Zhang Y, Zhang X, Li J, Zhong H, Pan CW. Associations of outdoor activity and screen time with adiposity: findings from rural Chinese adolescents with relatively low adiposity risks. BMC Public Health. (2020) 20:1769. doi: 10.1186/s12889-020-09897-7, PMID: - DOI - PMC - PubMed

LinkOut - more resources