. 2024 Jul 16;35(3):102268.
doi: 10.1016/j.omtn.2024.102268. eCollection 2024 Sep 10.

Bi-functional CpG-STAT3 decoy oligonucleotide triggers multilineage differentiation of acute myeloid leukemia in mice

Affiliations

Bi-functional CpG-STAT3 decoy oligonucleotide triggers multilineage differentiation of acute myeloid leukemia in mice

Dongfang Wang et al. Mol Ther Nucleic Acids. .

Abstract

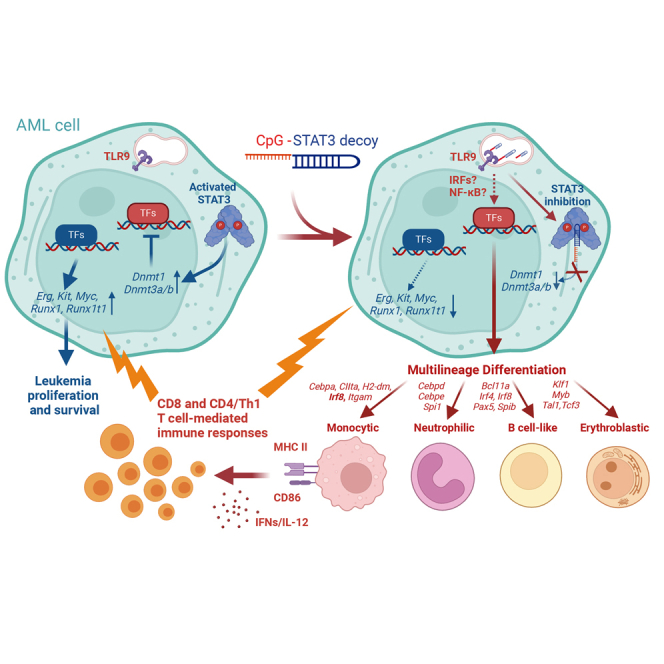
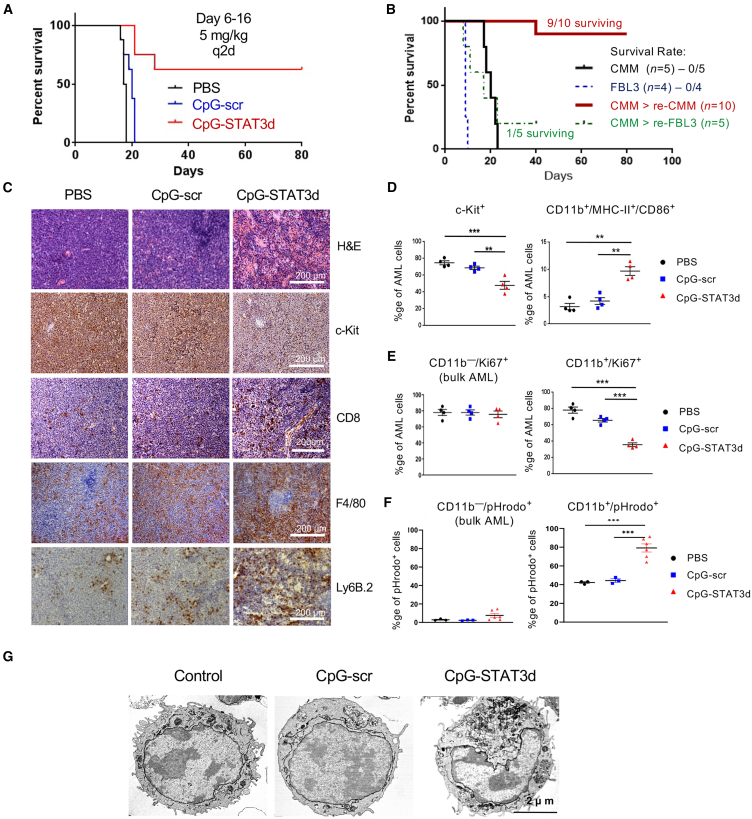
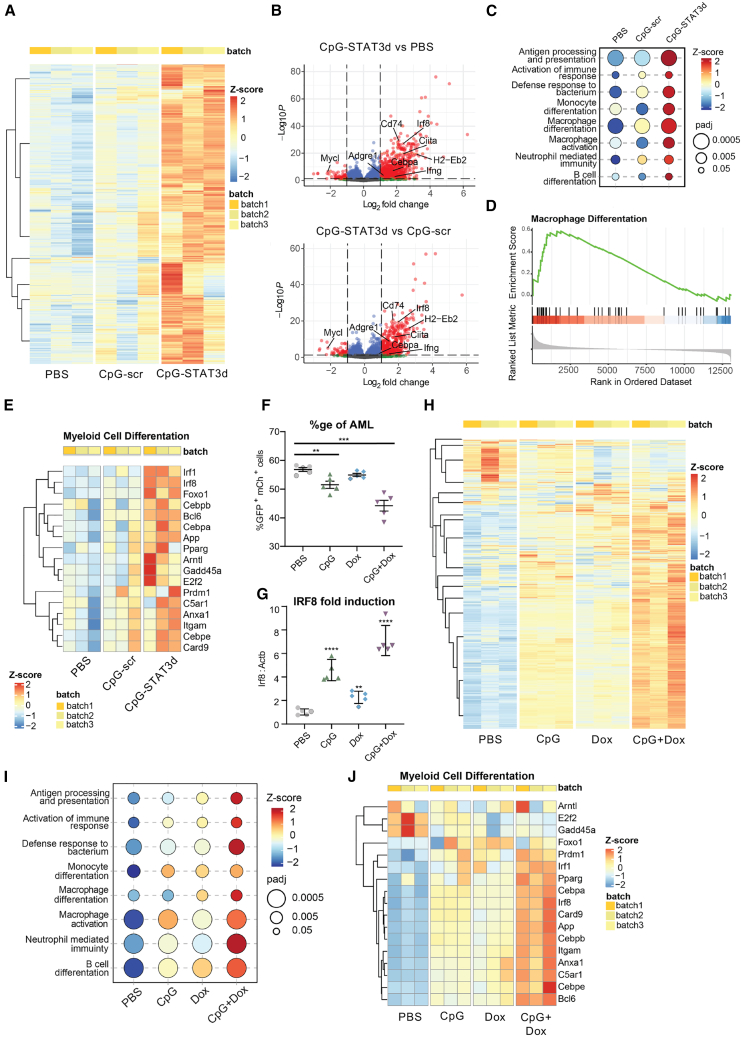
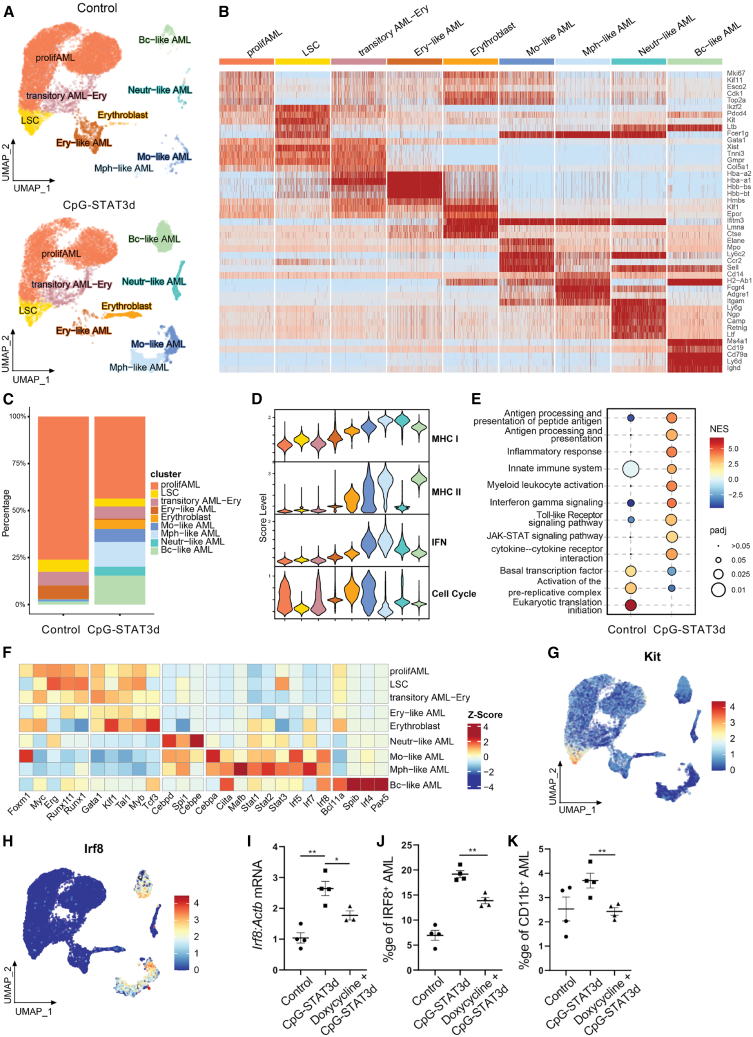
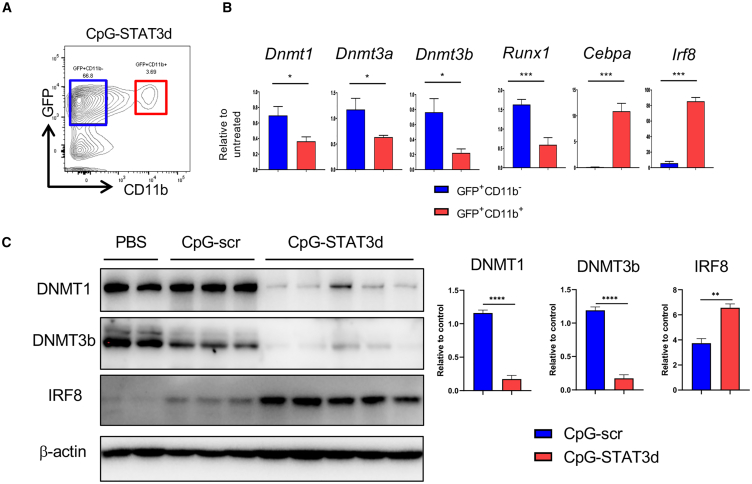
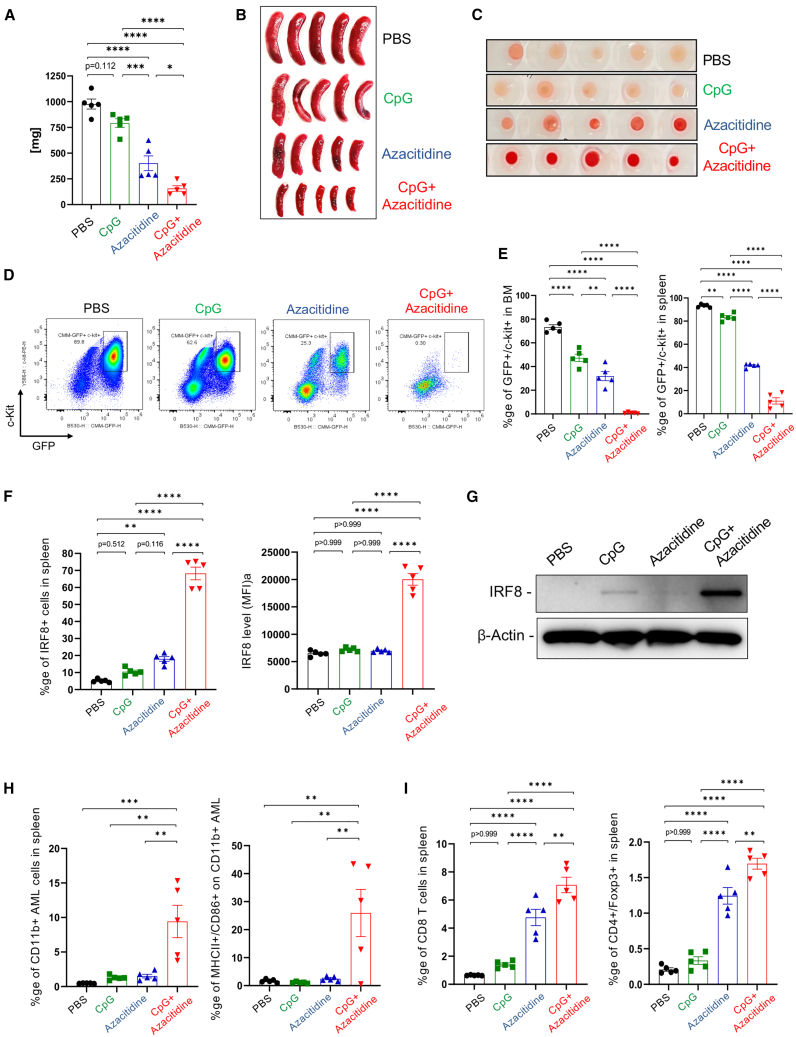
Acute myeloid leukemia (AML) cells resist differentiation stimuli despite high expression of innate immune receptors, such as Toll-like receptor 9 (TLR9). We previously demonstrated that targeting Signal Transducer and Activator of Transcription 3 (STAT3) using TLR9-targeted decoy oligodeoxynucleotide (CpG-STAT3d) increases immunogenicity of human and mouse AML cells. Here, we elucidated molecular mechanisms of inv(16) AML reprogramming driven by STAT3-inhibition/TLR9-activation in vivo. At the transcriptional levels, AML cells isolated from mice after intravenous administration of CpG-STAT3d or leukemia-targeted Stat3 silencing and TLR9 co-stimulation, displayed similar upregulation of myeloid cell differentiation (Irf8, Cebpa, Itgam) and antigen-presentation (Ciita, Il12a, B2m)-related genes with concomitant reduction of leukemia-promoting Runx1. Single-cell transcriptomics revealed that CpG-STAT3d induced multilineage differentiation of AML cells into monocytes/macrophages, erythroblastic and B cell subsets. As shown by an inducible Irf8 silencing in vivo, IRF8 upregulation was critical for monocyte-macrophage differentiation of leukemic cells. TLR9-driven AML cell reprogramming was likely enabled by downregulation of STAT3-controlled methylation regulators, such as DNMT1 and DNMT3. In fact, the combination of DNA methyl transferase (DNMT) inhibition using azacitidine with CpG oligonucleotides alone mimicked CpG-STAT3d effects, resulting in AML cell differentiation, T cell activation, and systemic leukemia regression. These findings highlight immunotherapeutic potential of bi-functional oligonucleotides to unleash TLR9-driven differentiation of leukemic cells by concurrent STAT3 and/or DNMT inhibition.

Keywords: CpG deoxynucleotides; MT: Oligonucleotides: Therapies and Applications; Oligonucleotide therapeutics; STAT3; TLR9; acute myeloid leukemia; cancer immunotherapy; decoy DNA.


Conflict of interest statement

M.K. is an inventor on the patents that cover the design of CpG-STAT3d ODNs. M.K. serves on the Scientific Advisory Board of Scopus Biopharma and its subsidiary Duet Biotherapeutics with stock options and sponsored research.

Figures

None
Graphical abstract
Figure 1
Figure 1
CpG/TLR9 stimulation results in regression of Cbfb/Myh11/Mpl leukemia in mice only when combined with STAT3 inhibition C57BL/6 mice were intravenously injected with 1 × 106Cbfb/Myh11/Mpl (CMM) leukemia cells. After tumors were established (1%–2% of AML cells in blood), mice were treated i.v. using CpG-STAT3d, control CpG-scr oligonucleotides (5 mg/kg), or PBS every other day for six times (days 6–16). (A) CpG-STAT3d, but not control CpG-scr treatment, resulted in survival of the majority of mice. The presented result represents one of two independent experiments with similar outcome (n = 7–8 mice/group). (B) CpG-STAT3d-treated mice that rejected CMM leukemia were rechallenged with CMM cells or with an unrelated FBL3 leukemia. Shown are survival curves for rechallenged mice as well as naive mice engrafted with both AML types in parallel (n = 5–10 mice/group). (C) Mice were euthanized 1 day after the last treatment to assess leukemia burden, cell morphology, and immune infiltration. The percentages of c-Kit+ leukemic cells, CD8+ T cells, F4/80+ macrophages, and Ly6B.2+ neutrophils were assessed using immunohistochemical staining in spleens from mice treated as indicated above; scale bar, 200 μm. Shown are data representative of one of three independent experiments. (D–F) Treatment with CpG-STAT3d triggers AML cell differentiation to the antigen-presenting phenotype. CMM leukemia-bearing mice were treated three times every other day using CpG-STAT3d, control CpG-scr (5 mg/kg), or PBS and euthanized 1 day later. Data are representative of 1 of 2 independent experiments. (D) Reduction of leukemia burden in spleen after CpG-STAT3d treatment is inversely correlated with AML cell differentiation. The percentages of GFP+c-Kit+ AML cells and differentiated GFP+CD11b+/MHC-II+/CD86+ AML cells were assessed using flow cytometry; shown are means ± SEM (n = 4 mice/group). (E and F) The cytofluorimetric analysis of intracellular staining for proliferation marker Ki-67 (E) and phagocytosis assay using pHrodo-E.coli-BioParticles (F) on freshly isolated GFP+CD11b+ vs. GFP+CD11b leukemic cells after in vivo treatments as indicated earlier; shown as means ± SEM (n = 3–6 mice/group). (G) CpG-STAT3d induces morphological changes in ultrastructure of the differentiating AML cell subset. Representative TEM images of splenic AML cell cytomorphology from two independent experiments; scale bar, 2 μm. Statistically significant p values were indicated as follows: ∗∗∗, p < 0.001; ∗∗, p < 0.01; and ∗, p < 0.05
Figure 2
Figure 2
The combination of STAT3 inhibition and TLR9 stimulation is required to transcriptionally reprogram CMM leukemic cells toward myeloid cell differentiation and antigen presentation (A–D) CMM-bearing mice were treated i.v. using CpG-STAT3d or control CpG-scr oligonucleotides (5 mg/kg) every other day for three times as in Figure 1A. RNA-seq analysis was performed using magnetically enriched leukemic cells. (A) The heatmap of hierarchical clustering of differentially expressed genes (DEGs), demonstrating distinct separation between treatment groups. (B) Volcano plots of DEGs with a log2 fold change (log2FC) greater than 2 and an adjusted p value (padj) less than 0.05 shown in red, highlighting a significant majority of upregulated genes following CpG-STAT3d treatment compared with both CpG-scr and PBS treatments. (C–E) Gene set enrichment analysis (GSEA) of the KEGG database-derived gene sets indicating the top-scoring immune signaling pathways for all three treatment groups (C), the gene enrichment score indicating the differentiation of AML cells primarily into macrophage-like cells (D), and the heatmap (E) of key myeloid cell differentiation gene expression in all three treatment groups. (F–J) Mice engrafted with 1 × 106 CMM-tetON-shStat3 cells expressing doxycycline-inducible STAT3shRNA (tetON-shStat3) were treated daily for six times with PBS, CpG, Dox (100 mg/kg), or CpG plus Dox. Compared with CpG or Dox treatments alone, the combined CpG/Dox treatment was the most effective in reducing splenic GFP+/mCherry+ AML cells (F) and in the upregulation of Irf8 expression in leukemic cells (G) as assessed using flow cytometry or qPCR, respectively. (H) RNA-seq analysis and hierarchical clustering showing pattern of gene expression in CMM-tetON-shStat3 cells treated with CpG+Dox as observed in the parental CMM treated with CpG-STAT3d (see A). (I and J) GSEA results (I) along with (J) a heatmap of differentially expressed genes associated with myeloid cell differentiation most robustly activated by the combined CpG+Dox treatment. All the presented data are representative of the results obtained in two independent experiments, n = 3–5 mice/group, and the quantification results were shown as means ± SEM. Statistically significant differences are indicated by asterisks: ∗∗∗∗, p < 0.0001; ∗∗, p < 0.01.
Figure 3
Figure 3
Single-cell transcriptomic analysis of CMM cell differentiation into immunogenic myeloid cells in vivo CMM leukemia-bearing mice were treated using i.v. injections of CpG-STAT3d (5 mg/kg) or PBS three times every other day. (A–H) Single-cell RNA-seq analysis was performed on the sorted GFP+ leukemic cells from four individually treated mice or PBS control (88%–94% purity). (A) UMAP plots of AML cells in control (top) and CpG-STAT3d-treated (bottom) mice, clustered using the Leiden algorithm, revealing nine distinct populations. (B) Cell clusters were labeled based on the expression of lineage and immune marker genes. Among these, four populations represented CMM cells, while the remaining five exhibited signatures of differentiated immune cell types. (C) Stacked bar plots depict percentages of various cell clusters to highlight the enrichment of differentiated cell subsets in CpG-STAT3d-treated mice. (D) Module score plots indicating a correlation between reduced proliferative potential of macrophage and B cell-like clusters together with augmented antigen-presenting potential. (E) The upregulation of antigen-presentation and immune signaling gene sets coupled with a decrease in DNA synthesis and proliferation-related genes in CMM cells from treated vs. control mice as assessed using GSEA. (F) Heatmap of transcription factor expression levels revealing the downregulation of pro-tumor TFs (e.g., Runx1, Myb, Myc) and the upregulation of TFs driving cell differentiation, antigen-presentation and immune activity (e.g., Cebpa, Irf8, Stat1, Ciita). (G) UMAP plot of Kit expression levels in the LSC subset of AML cells. (H) UMAP plot of Irf8 expression levels overlapping with monocyte/macrophage clusters. (I–K) To achieve inducible Irf8 silencing in AML cells, we generated CMM-tetON-shIrf8 cells expressing doxycycline (Dox)-inducible Irf8shRNA (tetON-shIrf8). Mice engrafted with CMM-tetON-shIrf8 cells were treated three times daily with PBS, CpG-STAT3d, or Dox+CpG-STAT3d. Dox-inducible IRF8 knockdown decreased CpG-STAT3d-driven IRF8 upregulation in splenic CMM cells at mRNA (I) and protein (J) levels. (K) Inducible Irf8 knockdown abrogates differentiation of AML cells after CpG-STAT3d treatment. The data (I–K) are representative of the results obtained in three independent experiments. Statistically significant differences were indicated by asterisks: ∗∗, p < 0.01; ∗, p < 0.05; shown are means ± SEM (n = 3–5 mice/group).
Figure 4
Figure 4
CpG-STAT3d promotes downregulation of methyl transferases with concomitant induction of IRF8 expression in differentiating CMM cells (A) C57BL/6 mice were intravenously injected with 1 × 106 CMM leukemia cells. Mice with established leukemia (1%–2% of AML cells in blood), were treated i.v. using CpG-STAT3d, CpG-scr (5 mg/kg), or PBS every other day for three times. qPCR and western blot were performed on sorted leukemic cells from spleen. (B) GFP+CD11b or GFP+CD11b+ leukemic cells were sorted from CpG-STAT3d-treated mice to determine the expression of certain genes. CpG-STAT3d upregulated Cebpa and Irf8 transcription factors that regulate myeloid cell differentiation, while it downregulated DNA methyltransferases (Dnmt1, Dnmt3a, Dnmt3b) in differentiated CMM cells (CD11b+) compared with non-differentiated CMM cells (CD11b). (C) The representative western blot (left) and the results quantification (right) showing decreased protein levels of DNMT1, DNMT3b, and elevated IRF8 in sorted GFP+ CMM cells after treatment using CpG-STAT3d, CpG-scr, or PBS. The presented data are representative of three independent experiments; shown are means ± SEM (n = 3–5). Statistically significant p values were indicated with asterisks: ∗∗∗∗, p < 0.0001; ∗∗∗, p < 0.001; ∗∗, p < 0.01 and ∗, p < 0.05
Figure 5
Figure 5
DNMT1 inhibition and CpG/TLR9 stimulation synergize to stimulate CMM cell differentiation and leukemia regression in vivo C57BL/6 mice with established, disseminated CMM leukemia were treated i.v. using azacitidine (1 mg/kg), CpG oligonucleotide (1 mg/kg), a combination thereof, or PBS every day for six times. Two days after the last treatment, mice were euthanized to analyze AML burden by measuring spleen weight (A) and size (B), bone marrow appearance (C), and the percentages of proliferating GFP+/c-Kit+ leukemic cells in spleen and bone marrow (D and E). (F) The combined azacitidine/CpG treatment induced expression of IRF8 in splenic leukemic cells as assessed using flow cytometry (F) and western blotting (G). (H and I) The combination of DNMT1 inhibitor and TLR9 stimulation promoted (H) differentiation and maturation of CMM cells to antigen-presenting phenotype (CD11b+/MHC-II+/CD86+) with (I) the increased recruitment of predominantly CD8 T cells with smaller percentages of regulatory T cells; means ± SEM (n = 5). Shown are results representative of two independent experiments. Statistically significant p values were indicated as follows: ∗∗∗∗, p < 0.0001; ∗∗∗, p < 0.001; ∗∗, p < 0.01 and ∗, p < 0.05.

References

    1. Khwaja A., Bjorkholm M., Gale R.E., Levine R.L., Jordan C.T., Ehninger G., Bloomfield C.D., Estey E., Burnett A., Cornelissen J.J., et al. Acute myeloid leukaemia. Nat. Rev. Dis. Prim. 2016;2 - PubMed
    1. Kantarjian H.M., Short N.J., Fathi A.T., Marcucci G., Ravandi F., Tallman M., Wang E.S., Wei A.H. Acute myeloid leukemia: historical perspective and progress in research and therapy over 5 decades. Clin. Lymphoma, Myeloma & Leukemia. 2021;21:580–597. - PMC - PubMed
    1. Damiani D., Tiribelli M. Present and future role of immune targets in acute myeloid leukemia. Cancers. 2022;15 - PMC - PubMed
    1. Curran E., Corrales L., Kline J. Targeting the innate immune system as immunotherapy for acute myeloid leukemia. Front. Oncol. 2015;5:83. - PMC - PubMed
    1. Boyiadzis M., Bishop M.R., Abonour R., Anderson K.C., Ansell S.M., Avigan D., Barbarotta L., Barrett A.J., Van Besien K., Bergsagel P.L., et al. The Society for Immunotherapy of Cancer consensus statement on immunotherapy for the treatment of hematologic malignancies: multiple myeloma, lymphoma, and acute leukemia. J. Immunother. Cancer. 2016;4:90. - PMC - PubMed

LinkOut - more resources