. 2024 Jul 31;6(4):fcae254.
doi: 10.1093/braincomms/fcae254. eCollection 2024.

Data-driven biomarkers better associate with stroke motor outcomes than theory-based biomarkers

Affiliations

Data-driven biomarkers better associate with stroke motor outcomes than theory-based biomarkers

Emily R Olafson et al. Brain Commun. .

Abstract

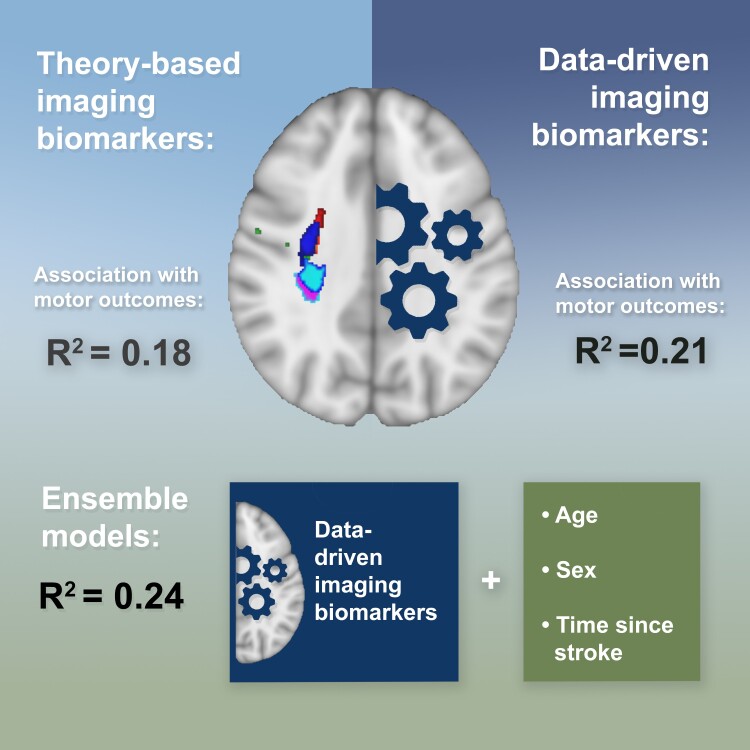
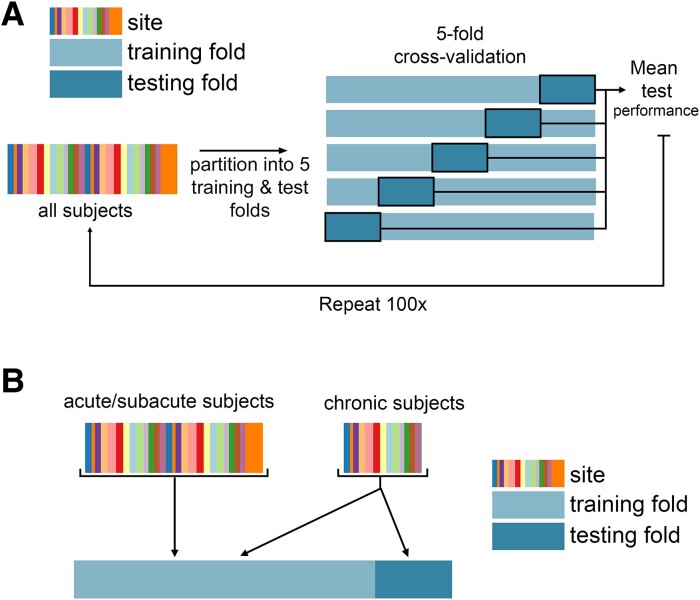
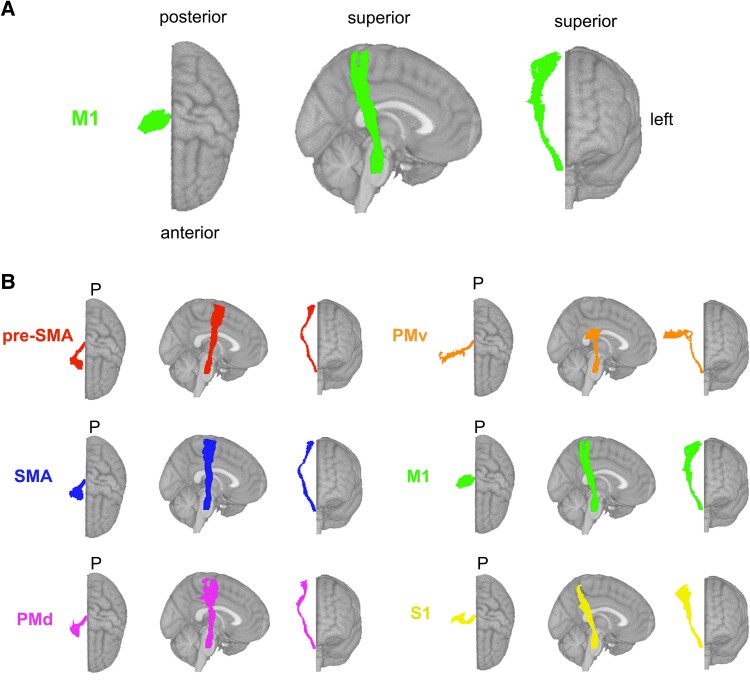
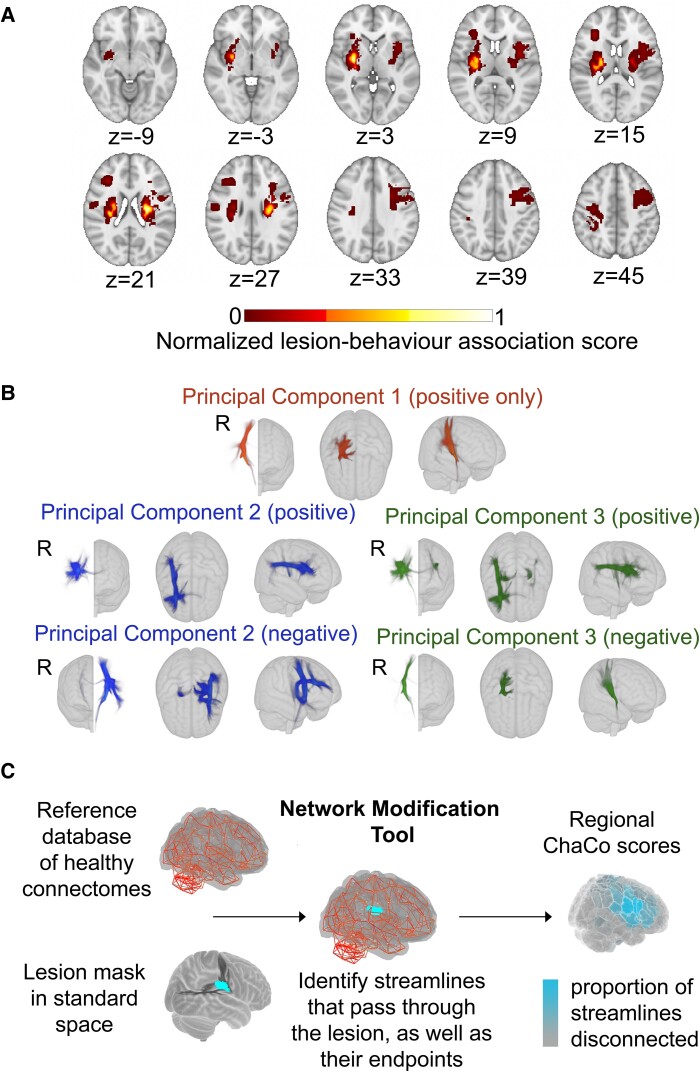
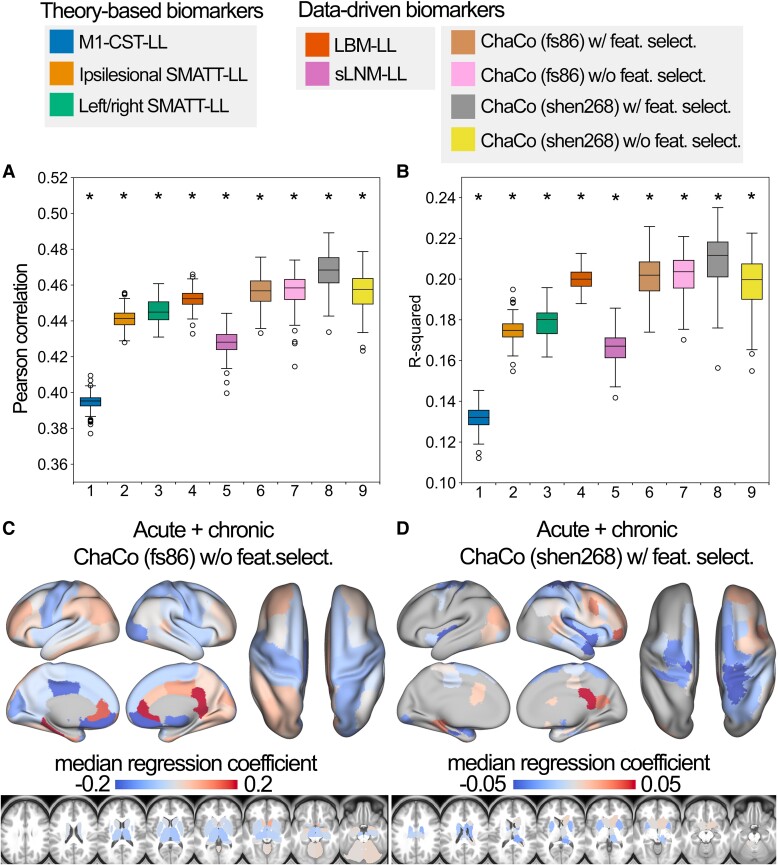
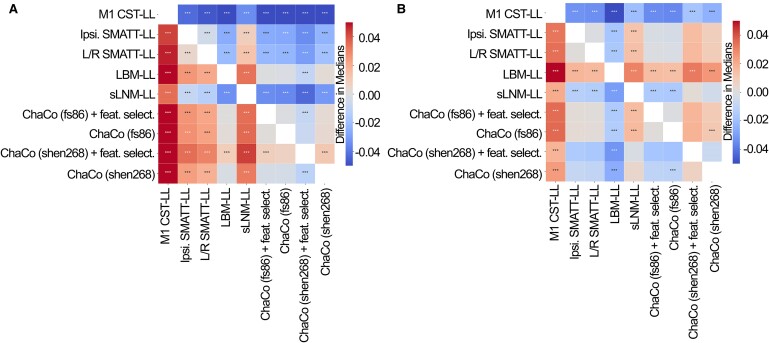
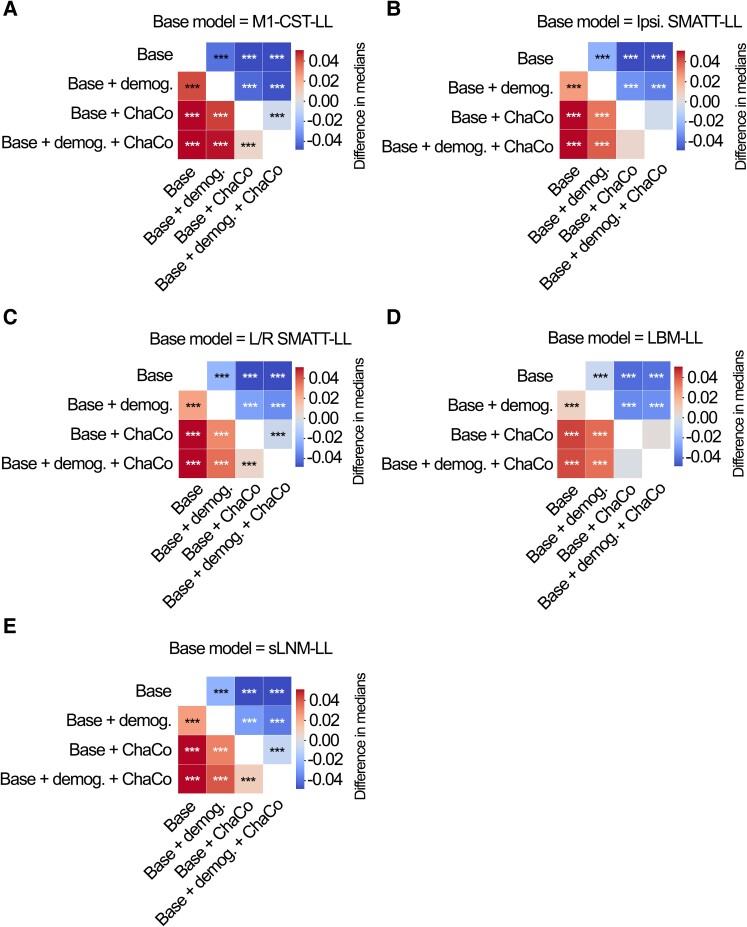
Chronic motor impairments are a leading cause of disability after stroke. Previous studies have associated motor outcomes with the degree of damage to predefined structures in the motor system, such as the corticospinal tract. However, such theory-based approaches may not take full advantage of the information contained in clinical imaging data. The present study uses data-driven approaches to model chronic motor outcomes after stroke and compares the accuracy of these associations to previously-identified theory-based biomarkers. Using a cross-validation framework, regression models were trained using lesion masks and motor outcomes data from 789 stroke patients from the Enhancing NeuroImaging Genetics through Meta Analysis (ENIGMA) Stroke Recovery Working Group. Using the explained variance metric to measure the strength of the association between chronic motor outcomes and imaging biomarkers, we compared theory-based biomarkers, like lesion load to known motor tracts, to three data-driven biomarkers: lesion load of lesion-behaviour maps, lesion load of structural networks associated with lesion-behaviour maps, and measures of regional structural disconnection. In general, data-driven biomarkers had stronger associations with chronic motor outcomes accuracy than theory-based biomarkers. Data-driven models of regional structural disconnection performed the best of all models tested (R 2 = 0.210, P < 0.001), performing significantly better than the theory-based biomarkers of lesion load of the corticospinal tract (R 2 = 0.132, P < 0.001) and of multiple descending motor tracts (R 2 = 0.180, P < 0.001). They also performed slightly, but significantly, better than other data-driven biomarkers including lesion load of lesion-behaviour maps (R 2 = 0.200, P < 0.001) and lesion load of structural networks associated with lesion-behaviour maps (R 2 = 0.167, P < 0.001). Ensemble models - combining basic demographic variables like age, sex, and time since stroke - improved the strength of associations for theory-based and data-driven biomarkers. Combining both theory-based and data-driven biomarkers with demographic variables improved predictions, and the best ensemble model achieved R 2 = 0.241, P < 0.001. Overall, these results demonstrate that out-of-sample associations between chronic motor outcomes and data-driven imaging features, particularly when lesion data is represented in terms of structural disconnection, are stronger than associations between chronic motor outcomes and theory-based biomarkers. However, combining both theory-based and data-driven models provides the most robust associations.

Keywords: imaging biomarkers; lesion-deficit associations; machine learning; stroke outcomes.


Conflict of interest statement

S.C.C. serves as a consultant for Abbvie, Constant Therapeutics, BrainQ, Myomo, MicroTransponder, Neurolutions, Panaxium, NeuExcell, Elevian, Helius, Omniscient, Brainsgate, Nervgen, Battelle, and TRCare. B.H. has a clinical partnership with Fourier Intelligence. N.J.S. is an inventor for a patent US 10,071,015 B2. C.J. W. is a consultant for Microtransponder, BrainQ, and MedRhythm. G.F.W. sits on Advisory Boards for Myomo and Neuro-innovators.

Figures

Graphical abstract
Graphical abstract
Figure 1
Figure 1
Cross-validation framework for model evaluation. A. Overview of five-fold cross-validation. Subject data are partitioned into five non-overlapping training and test folds, such that no training subjects are in the test set, and no subject is in the test fold more than once. B. Use of acute/subacute subjects in training folds but not test folds. When using all training data, chronic subjects were included in the test folds and training folds, whereas acute/subacute stroke subjects were only included in training folds.
Figure 2
Figure 2
Theory-based biomarkers. A. The M1-CST, displaying only the right hemisphere tracts relative to an MNI (Montreal Neurological Institute) template. B. Tracts from the sensorimotor tract template atlas (SMATT), displaying only right hemisphere tracts relative to an MNI template, including pre-supplementary motor area (pre-SMA), supplementary motor area (SMA), dorsal premotor cortex (PMd), ventral premotor cortex (PMv), primary motor cortex (M1), and primary sensory cortex (S1). Pre-SMA is the most anterior tract, and S1 is the most posterior tract.
Figure 3
Figure 3
Data-driven biomarkers. A. Lesion-behaviour map (LBM) representing the association between voxelwise damage and Fugl–Meyer scores, derived from multivariate lesion-behaviour mapping with Fugl–Meyer scores. B. Structural lesion-network maps (sLNMs), derived from seed-based tractography run on peak regions identified from LBM (A) and then performing principal components analysis to identify 3 components, split into positive and negative weights. C. Change in Connectivity (ChaCo) scores derived from the Network Modification (NeMo) tool. Binary lesion masks in MNI space representing the presence of a stroke lesion (turquoise) in a given voxel are provided by the user. Each lesion mask is embedded into 420 unrelated healthy structural connectomes (separately for each healthy subject) and the regional ChaCo scores are calculated and averaged across healthy subjects (parcellation shown here is the Shen 268-region atlas).
Figure 4
Figure 4
Summary of model performance metrics across all models tested and feature weights (regression coefficients β) for the two best-performing models. A. and B. Distribution of model performance (mean Pearson correlation/R2 across five outer folds for 100 permutations of the data, N = 92 for each fold). Asterisks (*) indicate that model performance is significantly above chance (*, P < 0.001), as assessed via permutation testing, where the P-value for the model's significance is the proportion of null models that had median R2 greater than or equal to the median performance of the true model. The boxes extend from the lower to upper quartile values of the data, with a line at the median. Whiskers represent the range of the data from (Q1-1.5*IQR, Q3 + 1.5*IQR). C. and D. Mean feature weights for the top two best-performing models (ChaCo (fs86) without feature selection, ChaCo (shen268) with feature selection, respectively). For the fs86-ChaCo model (left), we display the mean regression coefficients β across 100 permutations. For ChaCo (shen268) (right), we display the median regression coefficients of regions that were selected in at least 95% of outer folds (i.e. for regions that were included in the model in at least 475/500 outer folds, mean β coefficients were calculated across five outer folds, and the median value across 100 permutations is plotted).
Figure 5
Figure 5
Statistical comparison of model performance for estimating motor scores using Mann-Whitney signed-rank tests. Colours shown indicate the differences in median explained variance scores for each model. A. Models trained using all (acute and chronic) training data. B. Models trained only using chronic data. *** denotes corrected P < 0.001 after Bonferroni correction. A positive difference indicates that the model on the y-axis (vertical) has a greater explained variance than the model on the x-axis (horizontal).
Figure 6
Figure 6
Statistical comparison of model performance for ensemble models. Demog. = demographic information (age, sex, days since stroke). ChaCo = model using 268-region ChaCo scores w/ feature selection. Significance of differences in explained variance was evaluated using Mann-Whitney signed-rank tests; ***denotes corrected P < 0.001 after Bonferroni correction. A positive difference value indicates that the model on the y-axis (vertical) has a greater explained variance than the model on the x-axis (horizontal). Panels A-E display differences in model performance relative to (A) M1-CST-LL, (B) Ipsilesional SMATT-LL, (C) left/right hemisphere SMATT-LL, (D) LBM-LL, and (E) sLNM-LL.
Figure 7
Figure 7
Analysis of feature stability for 268-region ChaCo models (with feature selection) and investigation of paradoxical feature weights. A. Scatter plots displaying similarity between beta coefficients across five training folds for one permutation. Each point corresponds to one region, and points are coloured by the mean beta coefficient for that region across 500 training folds (i.e. coloured based on y-axis value). The average Pearson correlation coefficient across 500 folds is reported. B. Boxplots show the distribution of beta coefficients of consistently weighted regions (defined as having median beta coefficients that are zero or of an opposite sign <5% of the time). In total, 30 regions with consistent negative weights and five regions with consistent positive weights remained. Median weights for consistently weighted regions are plotted on a brain. The boxes extend from the lower to upper quartile values of the data, with a line at the median. Whiskers represent the range of the data from (Q1–1.5*IQR, Q3 + 1.5*IQR).

Update of

References

    1. Kelly-Hayes M, Beiser A, Kase CS, Scaramucci A, D’Agostino RB, Wolf PA. The influence of gender and age on disability following ischemic stroke: The Framingham study. J Stroke Cerebrovasc Dis. 2003;12(3):119–126. - PubMed
    1. Bonkhoff AK, Grefkes C. Precision medicine in stroke: Towards personalized outcome predictions using artificial intelligence. Brain. 2022;145(2):457–475. - PMC - PubMed
    1. Boyd LA, Hayward KS, Ward NS, et al. Biomarkers of stroke recovery: Consensus-based core recommendations from the stroke recovery and rehabilitation roundtable. Int J Stroke. 2017;12(5):480–493. - PMC - PubMed
    1. Tozlu C, Edwards D, Boes A, et al. Machine learning methods predict individual upper-limb motor impairment following therapy in chronic stroke. Neurorehabil Neural Repair. 2020;34(5):428–439. - PMC - PubMed
    1. Kuceyeski A, Navi BB, Kamel H, et al. Structural connectome disruption at baseline predicts 6-months post-stroke outcome. Hum Brain Mapp. 2016;37(7):2587–2601. - PMC - PubMed