. 2024 Aug;13(16):e70104.
doi: 10.1002/cam4.70104.

Predictive biomarkers for metachronous gastric cancer development after endoscopic resection of early gastric cancer

Affiliations

Predictive biomarkers for metachronous gastric cancer development after endoscopic resection of early gastric cancer

Bokyung Kim et al. Cancer Med. 2024 Aug.

Abstract

Objectives: We aimed to identify predictive markers for metachronous gastric cancer (MGC) in early gastric cancer (EGC) patients curatively treated with endoscopic submucosal dissection (ESD).

Materials and methods: From EGC patients who underwent ESD, bulk RNA sequencing was performed on non-cancerous gastric mucosa samples at the time of initial EGC diagnosis. This included 23 patients who developed MGC, and 23 control patients without additional gastric neoplasms for over 3 years (1:1 matched by age, sex, and Helicobacter pylori infection state). Candidate differentially-expressed genes were identified, from which biomarkers were selected using real-time quantitative polymerase chain reaction and cell viability assays using gastric cell lines. An independent validation cohort of 55 MGC patients and 125 controls was used for marker validation. We also examined the severity of gastric intestinal metaplasia, a known premalignant condition, at initial diagnosis.

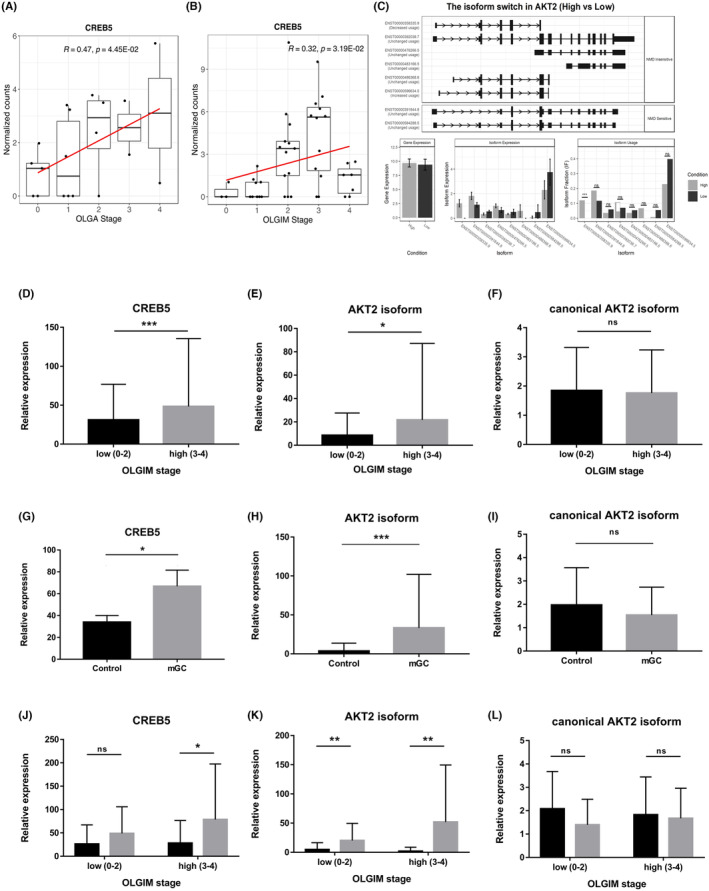
Results: From the discovery cohort, 86 candidate genes were identified of which KDF1 and CDK1 were selected as markers for MGC, which were confirmed in the validation cohort. CERB5 and AKT2 isoform were identified as markers related to intestinal metaplasia and were also highly expressed in MGC patients compared to controls (p < 0.01). Combining these markers with clinical data (age, sex, H. pylori and severity of intestinal metaplasia) yielded an area under the curve (AUC) of 0.91 (95% CI, 0.85-0.97) for MGC prediction.

Conclusion: Assessing biomarkers in non-cancerous gastric mucosa may be a useful method for predicting MGC in EGC patients and identifying patients with a higher risk of developing MGC, who can benefit from rigorous surveillance.

Keywords: RNA sequencing; biomarkers; endoscopic resection; gastric cancer; whole exome sequencing.


Conflict of interest statement

The authors declare that they have no conflict of interest.

Figures

FIGURE 1
FIGURE 1
Study design and graphical summary of the clinical and sequencing data. (A) Study design. (B) Graphical summary of the clinical data (C) Heatmap of the top 1000 highly variable genes (HVGS) sorted by the standard deviation of RNA sequencing data. The expression profiles of HVGS cluster samples, and the clustering pattern implies the heterogeneous characteristics of the cohort. (D) Somatic mutation landscape. (E) The flow of target marker selection.
FIGURE 2
FIGURE 2
Candidate gene selection with bulk RNA sequencing data. (A) Significantly differentially expressed genes are marked as red dots in the volcano plot. (Our gene of interest gene, KDF1, is labeled). (B) Unsupervised hierarchical clustering of 13 significantly dysregulated genes in the control (ctrl) and MGC groups. (C) Spearman correlation analysis of gene expression by the number of MGCs, number of new gastric cancers, number of new gastric neoplasms, and OLGIM stage. Each dot represents a significant correlation, with a correlation coefficient ≥0.5 and p‐value <0.05. The red dot represents CDK1, which is our gene of interest. (D) Expression of CDK1 by the number of new gastric cancers, with Spearman correlation coefficient and its p‐value. The red line indicates the regression line.
FIGURE 3
FIGURE 3
Selection and validation of the target markers, KDF1 and CDK1. (A, B) Relative expression of KDF1 and CDK1 in various gastric cancer cell lines and a normal gastric epithelial cell line (HFE145) (arrowhead). (A) KDF1 and (B) CDK1 showed increased expression in various gastric cancer cell lines compared to HFE145 (intestinal type: SNU216, MKN1, AGS; diffuse type: SNU1, SNU5, SNU16, SNU488, SNU601, SNU620, SNU638, MKN45; normal gastric epithelial cell line: HFE145). (C, D) Cell viability test using siRNA. Knockdown of (C) KDF1 and (D) CDK1 using specific siRNAs resulting in reduced cell viability in a gastric cancer cell line (SNU216). (E–L) Validation of KDF1 and CDK1. (E, F) RT‐qPCR in fresh‐frozen normal gastric epithelial tissue of MGC patients and controls in the validation set measured expression levels of KDF1 and CDK1. (E) KDF and (G) CDK1 showing significantly increased expression in MGC patients compared to controls. (G, H) Western blot of KDF1 and CDK1 in MGC patients and controls. (G) Representative western blot image of KDF1 in MGC and control samples from three independent experiments. (H) Representative western blot image of CDK1 in MGC and control samples from three independent experiments. (I, J) Intensity analysis of the Western blots of (I) KDF1 and (J) CDK1 in MGC patients and controls, normalized and displayed in bar diagrams. (K, L) Immunohistochemical staining of (K) KDF1 and (L) CDK1 in noncancerous gastric epithelial tissues. Representative samples were obtained from MGC patients and controls from the validation cohort. (K) Immunohistochemical staining revealed weak KDF1 expression in the normal gastric epithelial tissue of controls and high KDF1 expression in normal tissues of MGC patients. In the MGC patients, the normal gastric epithelium (arrow) and areas with intestinal metaplasia (*) both showed increased expression of KDF1. Upper and middle panels: Magnification ×15; lower panels: Magnification ×30. Data are representative of three independent experiments. (L) Weak CDK1 expression in normal gastric epithelial tissue of controls and high CDK11 expression in normal tissues of MGC patients. In the MGC patients, the normal gastric epithelium (arrow) and areas with intestinal metaplasia (*) both showed increased expression of CDK1. Upper and middle panels: Magnification ×15; lower panels: Magnification ×30. Data are representative of three independent experiments. *p < 0.01 ***p < 0.0001.
FIGURE 4
FIGURE 4
Markers associated to gastric atrophy and intestinal metaplasia. (A, B) Expression of CREB5 by the (A) OLGA stage and (B) OLGIM stage in the bulk RNA sequencing data from the discovery cohort with Spearman correlation coefficient and its p value. The red line indicates the regression line. (C) Isoform switching analysis of AKT2. The isoform structures of AKT2 along with the concatenated annotations (including transcript classification, ORF, coding potential, and NMD sensitivity) are shown in the upper panel. Differential gene expression and isoform fraction (dIF) between the OLGIM high (n = 20) and OLIGM low (n = 3) group were shown in the lower panel (** dIF >0.1 and p value <0.001.) (D–L) Expression levels of CREB5, AKT2 isoform (ENST00000358335.9), and canonical isoform AKT2 in the validation cohort according to OLGIM stage and MGC development. (D–F) Expression levels of (D) CREB5, (E) AKT2 isoform (ENST00000358335.9), and (F) canonical isoform AKT2 measured by RT‐qPCR in fresh‐frozen normal gastric epithelial tissue of the validation set, and stratified by OLGIM stage low (0–II) to high (III–IV). CREB5 and AKT2 isoform (ENST00000358335.9) shows good correlation with OLGIM stage while canonical isoform AKT2 does not show such significance. (G–I) Expression levels of (G) CREB5, (H) AKT2 isoform (ENST00000358335.9), and (I) canonical isoform AKT2 measured by RT‐qPCR in fresh‐frozen normal gastric epithelial tissue of MGC patients and controls in the validation cohort. (G) CREB5 and (H) AKT2 isoform (ENST00000358335.9) showing significantly increased expression in MGC patients compared to controls while (I) canonical isoform AKT2 does not show such significance. (J–L) Expression levels of (J) CREB5, (K) AKT2 isoform (ENST00000358335.9), and (L) canonical isoform AKT2 measured by RT‐qPCR in fresh‐frozen normal gastric epithelial tissue of MGC patients and controls in subgroups with low OLGIM stage (0–II) patients and high OLGIM stage (III–IV) patients in the validation cohort. (J) In OLGIM high (III–IV) patients, CREB5 showed increased expression in MGC patients compared to controls, while in OLGIM low (0–II) patients, no significant difference was noticed. *p < 0.01, **p < 0.001, ***p < 0.0001.
FIGURE 5
FIGURE 5
Accuracy of biomarkers in the validation cohort. (A–D) Receiver operating characteristic (ROC) curves for KDF1 (A), CDK1 (B), CREB5 (C), and AKT2 isoform (ENST00000358335.9) (D). The area under the curve (AUC) was used to determine the accuracy of MGC prediction. (E) Combinations of biomarkers with clinical information including age, sex, H. pylori infection status, and OLGIM stage with the optimal AUC for predicting MGC development (listed in order of highest to lowest AUC values according to each biomarker, combination of biomarkers, and combination of biomarkers and clinical variables).

Similar articles

Cited by

References

    1. Bray F, Ferlay J, Soerjomataram I, Siegel RL, Torre LA, Jemal A. Global cancer statistics 2018: GLOBOCAN estimates of incidence and mortality worldwide for 36 cancers in 185 countries. CA Cancer J Clin. 2018;68(6):394‐424. - PubMed
    1. Kakushima N, Fujishiro M. Endoscopic submucosal dissection for gastrointestinal neoplasms. World J Gastroenterol. 2008;14(19):2962‐2967. - PMC - PubMed
    1. Nakajima T, Oda I, Gotoda T, et al. Metachronous gastric cancers after endoscopic resection: how effective is annual endoscopic surveillance? Gastric Cancer. 2006;9(2):93‐98. - PubMed
    1. Min BH, Kim ER, Kim KM, et al. Surveillance strategy based on the incidence and patterns of recurrence after curative endoscopic submucosal dissection for early gastric cancer. Endoscopy. 2015;47(9):784‐793. - PubMed
    1. Hahn KY, Park JC, Kim EH, et al. Incidence and impact of scheduled endoscopic surveillance on recurrence after curative endoscopic resection for early gastric cancer. Gastrointest Endosc. 2016;84(4):628‐638 e1. - PubMed

MeSH terms