. 2024 Jul 9;9(16):e175103.
doi: 10.1172/jci.insight.175103.

High-fat and high-carbohydrate diets increase bone fragility through TGF-β-dependent control of osteocyte function

Affiliations

High-fat and high-carbohydrate diets increase bone fragility through TGF-β-dependent control of osteocyte function

Neha S Dole et al. JCI Insight. .

Abstract

Obesity can increase the risk of bone fragility, even when bone mass is intact. This fragility stems from poor bone quality, potentially caused by deficiencies in bone matrix material properties. However, cellular and molecular mechanisms leading to obesity-related bone fragility are not fully understood. Using male mouse models of obesity, we discovered TGF-β signaling plays a critical role in mediating the effects of obesity on bone. High-carbohydrate and high-fat diets increase TGF-β signaling in osteocytes, which impairs their mitochondrial function, increases cellular senescence, and compromises perilacunar/canalicular remodeling and bone quality. By specifically inhibiting TGF-β signaling in mouse osteocytes, some of the negative effects of high-fat and high-carbohydrate diets on bones, including the lacunocanalicular network, perilacunar/canalicular remodeling, senescence, and mechanical properties such as yield stress, were mitigated. DMP1-Cre-mediated deletion of TGF-β receptor II also blunted adverse effects of high-fat and high-carbohydrate diets on energy balance and metabolism. These findings suggest osteocytes are key in controlling bone quality in response to high-fat and high-carbohydrate diets. Calibrating osteocyte function could mitigate bone fragility associated with metabolic diseases while reestablishing energy balance.

Keywords: Bone biology; Obesity.


Conflict of interest statement

Conflict of interest: The authors have declared that no conflict of interest exists.

Figures

Figure 1
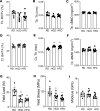
Figure 1. High-fat diet and its suggested control low-fat, high-carbohydrate diet impair bone material properties without affecting bone mineral density.
μCT analysis on femurs of 30-week-old control male mice on standard chow diet (RD), low-fat/high-carbohydrate diet (HCD), and high-fat diet (HFD) shows changes in trabecular bone volume fraction (Tb. BV/TV) (A), thickness (Tb. Th.) (B), and volumetric bone mineral density (Tb. tBMD) (C) and cortical bone area fraction (Ct. BA/TA) (D), thickness (Ct. Th.) (E), and volumetric bone mineral density (Ct.tBMD) (F) in response to diets (N = 8–10). Flexural testing of femurs from RD-, HCD-, and HFD-fed mice shows a decline in bone material properties of yield load (G), yield stress (H), and bending modulus (I) (N = 8–10 mice/group). Data for AI are presented as mean ± SD, and statistically significant differences, *P < 0.05, were determined with 1-way ANOVA and Newman-Keuls multiple post hoc test correction for the indicated group comparisons. Note: data from RD, HCD, and HFD control mice in Figure 1 are replicated in Figure 8.
Figure 2
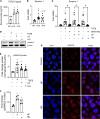
Figure 2. High-carbohydrate and -fat diets increase cell-intrinsic TGF-β signaling in osteocytes.
TGF-β1 levels in serum (A) (N = 4 mice/group) and mRNA levels of TGF-β–responsive gene, Serpine 1, in cortical bones (B) (N = 7–11 mice/group) of 30-week-old mice fed a standard chow diet (RD), low-fat/high-carbohydrate diet (HCD), or high-fat diet (HFD) were determined. For A and B, *P < 0.05 different from the RD-fed mice, and data are presented as mean ± SD. Differentiated OCY454 cells were treated with high fatty acids (HF, palmitate 100 μm, oleate 200 μm, linoleate 200 μm), high glucose (HG, 25 mM), TGF-β (5 ng/mL), or TGF-β receptor I kinase inhibitor, SB431542 (10 μM), for 72 hours for real-time quantitative PCR (qRT-PCR) (C), immunoblotting (D and E), and immunofluorescence (F and G). Changes in Serpine 1 mRNA (C) in the presence of HF, HG, and TGF-β (N = 8 biological replicates/group, compiled from 3 independent experiments, presented as mean ± SD). Induction of phosphorylated Smad 3 (D and E) with HF, HG, and TGF-β treatments was detected (N = 6 biological replicates/group, compiled from 3 independent experiments with N = 2 biological replicates/group/experiment, data are presented as mean ± SD). Immunofluorescence for increased Smad 3 nuclear localization and activation (F and G) with HF and HG treatments (N = 3 biological replicates/condition, 3 regions of interest [ROIs]/mouse, and data are shown as mean ± SD, and reproduced across 2 independent experiments). Scale bar is 50 µm. *P < 0.05 different from the control (untreated group), and #P < 0.05 denotes the difference in the presence of SB431542 for each of the treatments: TGF-β, HF, or HG. Statistical differences were determined with 1-way ANOVA and Newman-Keuls multiple post hoc correction (AC, E, and F).
Figure 3
Figure 3. Hyperglycemia and hyperlipidemia affect osteocyte intrinsic cellular metabolism.
Undifferentiated OCY454 cells were exposed to hyperlipidemia (HF, palmitate 100 μm, oleate 200 μm, linoleate-200 μm) or hyperglycemia (HG, glucose 25 mM) in the presence or absence of TGF-β (5 ng/mL) or TGF-β receptor I kinase inhibitor, SB431542 (10 μM), for 24 hours. In response to HF, HG, and TGF-β treatment, changes in oxygen consumption rate (OCR) parameters, namely, ATP production (A and E) and maximum respiration (B and F), were measured. Changes in intracellular ROS with HF (C and D) and HG (G and H) treatment determined with DCFDA stain have been quantified as mean fluorescence intensity (MFI) (N = 3 technical replicates/condition). Changes in mitochondrial membrane potential (I and J) with JC1 dye with TGF-β, HFG (palmitate, oleate, linoleate, glucose), or a combination of both treatments were quantified as red-to-green fluorescence intensity ratios (R/G) from sum projections, then normalized to the control group (for I, scale bar is 5 μm; for J, N = 3 technical replicates/condition). Changes in OCR parameters, namely, maximum respiration (K and M) and ATP production (L and N) in HF-, HG-, and SB431542-treated OCY454 cells have been shown. (N = 5 technical replicates/condition.) For AN, data are presented as mean ± SD and were reproduced across 3 independent experiments. *P < 0.05 different from the untreated group, #P < 0.05 different from the TGF-β–treated group, $P < 0.05 different from HF- or HG-treated groups, and differences were calculated with 2-way ANOVA and Newman-Keuls multiple post hoc correction. Statistical interactions are provided in Supplemental Tables 3 and 4.
Figure 4
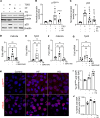
Figure 4. Hyperglycemia and hyperlipidemia promote cellular senescence through TGF-β signaling in osteocytes.
Differentiated OCY454 cells were treated with high fatty acids (HF, palmitate 100 μm, oleate 200 μm, linoleate 200 μm), high glucose (HG, 25 mM), TGF-β (5 ng/mL), or TGF-β receptor I kinase inhibitor, SB431542 (10 μM), for 72 hours. Immunoblotting shows induction in p16ink4a and p53 in the presence of HF, HG, or TGF-β (AC) (N = 2 biological replicates/group, and data compiled from 3 independent experiments). Quantitative real-time PCR (qRT-PCR) shows increased mRNA levels of senescence markers, Cdkn2a (D and F) and Tp53 (p53) (E and G) with HF and HG with or without SB431542 treatment. Immunofluorescence shows an increased percentage of DAPI-positive osteocytes that also stained positive for p16ink4a (H and I) and γH2AX (H and J) (N = 3 technical replicates/group repeated in 3 independent experiments). Scale bar is 50 µm. Data for AJ are shown as mean ± SD and *P < 0.05, **P < 0.01, ***P < 0.005; differences were calculated with 1-way ANOVA and Newman-Keuls multiple post hoc correction. Statistical interactions are provided in Supplemental Table 5.
Figure 5
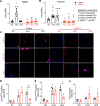
Figure 5. High-fat diet–induced osteocyte senescence is TGF-β dependent.
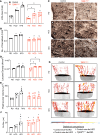
Quantitative real-time PCR (qRT-PCR) of cortical bone-derived RNA from 30-week-old control and TβRIIocy–/– male mice fed a standard chow diet (RD), low-fat/high-carbohydrate diet (HCD), or high-fat diet (HFD) used for in vivo assessment of TβRII and Serpine 1 expression in osteocytes (A and B) (N = 7–11 mice/group, mean ± SD). Immunohistochemistry (IHC) for p16ink4a, p21cip/waf, and p53 was conducted on femoral cortical bone sections. Representative images (C) of IHC and the percentage of DAPI-stained osteocytes that also stained for p16ink4a (D, top), p21cip/waf (E, middle), and p53 (F, bottom) were quantified and expressed as fold-change, relative to RD-fed control mice (N = 3 mice/group and 4 regions of interest [ROI]/mouse were collected, mean ± SD, the scale bar is 50 μm). *P < 0.05 different from RD-fed control mice, #P < 0.05 different from HCD-fed control mice, $P < 0.05 different from HFD-fed control mice, P < 0.05 different from RD-fed TβRIIocy–/– mice, as calculated from the 2-way ANOVA and Newman-Keuls multiple post hoc correction. Statistical interactions are provided in Supplemental Table 6.
Figure 6
Figure 6. High-carbohydrate and high-fat diet–induced osteocytic perilacunar/canalicular remodeling gene expression is partially TGF-β dependent.
Quantitative real-time PCR (qRT-PCR) shows differential regulation of genes implicated in PLR, Mmp13, Mmp14, Ctsk, Atp6v0d2, and Atp6v1g1, when differentiated OCY454 cells were subjected to hyperlipidemia (HF, AE) or hyperglycemia (HG, FJ) in the presence or absence of SB431542 (10 μM) for 72 hours (N = 3 biological replicates/group, replicated in 3 independent experiments, *P < 0.05 different from untreated group, $P < 0.05 different from HF or HG treatment). mRNA levels of Mmp13, Mmp14, Ctsk, Atp6v0d2, and Atp6v1g1, in cortical bones of 30-week-old control and TβRIIocy–/– mice fed a standard chow diet (RD), low-fat/high-carbohydrate diet (HCD), or high-fat diet (HFD) were quantified (KO), (N = 7–11 mice/group). *P < 0.05 different from RD-fed control mice, #P < 0.05 different from HCD-fed control mice, $P < 0.05 different from HFD-fed control mice, P < 0.05 different from RD-fed TβRIIocy–/– mice; differences were calculated with 1-way (AJ) and 2-way (KO) ANOVA, with Newman-Keuls multiple post hoc corrections, and data shown as mean ± SD (AO). Statistical interactions are provided in Supplemental Table 6.
Figure 7
Figure 7. High-carbohydrate and -fat diets alter osteocyte lacunar volume and canalicular network, and ablation of TGF-β signaling lessens these dietary effects on osteocytes.
Standard chow diet (RD), low-fat/high-carbohydrate diet (HCD), or high-fat diet (HFD) fed 30-week-old control and TβRIIocy–/– mouse femurs were used for assessment of the osteocyte lacunocanalicular network (LCN) in femoral cortical bone with Ploton silver stain. Quantified LCN area (A), number of canaliculi (B), and representative images (C) have been shown (N = 5 mice/group with 4 ROI/mouse; data shown as mean ± SEM; scale bar = 20 μm). SRμCT was used to determine osteocyte lacunar density (D), volume (E), and vascular canal diameter (F and G) in tibial cortical bones of RD-, HCD-, or HFD-fed 30-week-old control and TβRIIocy–/– mice (N = 4 mice/group; data are shown as mean ± SD). *P < 0.05 different from RD-fed control mice, #P < 0.05 different from HCD-fed control mice, $P < 0.05 different from HFD-fed control mice, P < 0.05 different from RD-fed TβRIIocy–/– mice, as calculated from the 2-way ANOVA and Newman-Keuls multiple post hoc correction. Statistical interactions are provided in Supplemental Table 6.
Figure 8
Figure 8. Disruption of TGF-β signaling in osteocytes prevents high-carbohydrate and high-fat diet–induced bone fragility.
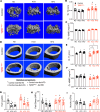
μCT analysis of femoral bones from 30-week-old male control and TβRIIocy–/– mice fed RD, HCD, or HFD shows changes in trabecular and cortical bone parameters. Representative μCT images (AD, scale bar 100 μm) and analysis of trabecular and cortical bone parameters, namely, trabecular bone thickness (Tb.Th) (B), trabecular bone mineral density (Tb. tBMD) (C), cortical thickness (Ct. Th) (E), and cortical bone mineral density (Ct. tBMD) (F) are shown (N = 8–10 mice/group). Flexural strength tests of bones of control and TβRIIocy–/– mice fed RD, HCD, or HFD reveal effects of diet on bone material properties, including yield load, yield stress, and elastic modulus (GI) (N = 8–10 mice/group). For AI, data are shown as mean ± SD; *P < 0.05 different from control mice fed RD, #P < 0.05 different from control mice fed LFD, $P < 0.05 different from control mice fed HFD, and P < 0.05 different from TβRIIocy–/– mice fed RD; statistical differences were calculated using 2-way ANOVA and Newman-Keuls multiple post hoc corrections. Statistical interactions are provided in Supplemental Tables 7 and 8. Note: data on RD, HCD, and HFD control mice are replicated in Figure 1.
Figure 9
Figure 9. TβRIIocy–/– mice are resistant to high-carbohydrate and high-fat diet–induced deregulation of energy metabolism.
Body weight of male control and TβRIIocy–/– mice fed standard chow diet (RD, A), low-fat/high-carbohydrate diet (HCD, D), or high-fat diet (HFD, G) is shown. Intraperitoneal glucose (GTT) and insulin tolerance tests (ITT) were performed at the end of diet in male control and TβRIIocy–/– mice fed RD (B and C), HCD (E and F), or HFD (H and I) (N = 6–11 mice/group; and data are shown as mean ± SEM). Statistical significance assessed by 2-tailed Student’s t test, *P < 0.05 denotes a significant difference from the control group on the same diet. Two-way ANOVA tests were performed for GTT and ITT, followed by Newman-Keuls multiple post hoc correction.
Figure 10
Figure 10. TβRIIocy–/– mice exhibit metabolic protection against the effects of high-carbohydrate and high-fat diet by targeting energy expenditure, activity, and food intake.
Indirect calorimetry was used to measure oxygen consumption (VO2), carbon dioxide production (VCO2), energy expenditure (EE), respiratory exchange ratio (RER), food intake, and activity (X-amb reflecting moving and exploring in the XY plane and Z-count reflecting jumping and grooming) in male control and TβRIIocy–/– mice fed standard chow diet (RD, AF), low-fat/high-carbohydrate diet (HCD, GL), or high-fat diet (HFD, MR) diet for 18 weeks (N = 6–8 mice/group; data are shown as mean ± SEM). Statistical significance, *P < 0.05, was assessed by 2-tailed Student’s t test.

References

    1. Shapses SA, Sukumar D. Bone metabolism in obesity and weight loss. Annu Rev Nutr. 2012;32:287–309. doi: 10.1146/annurev.nutr.012809.104655. - DOI - PMC - PubMed
    1. Gonnelli S, et al. Obesity and fracture risk. Clin Cases Miner Bone Metab. 2014;11(1):9–14. doi: 10.11138/ccmbm/2014.11.1.009. - DOI - PMC - PubMed
    1. Hou J, et al. Obesity and bone health: a complex link. Front Cell Dev Biol. 2020;8:600181. doi: 10.3389/fcell.2020.600181. - DOI - PMC - PubMed
    1. Ionova-Martin SS, et al. Changes in cortical bone response to high-fat diet from adolescence to adulthood in mice. Osteoporos Int. 2011;22(8):2283–2293. doi: 10.1007/s00198-010-1432-x. - DOI - PMC - PubMed
    1. Turcotte AF, et al. Association between obesity and risk of fracture, bone mineral density and bone quality in adults: a systematic review and meta-analysis. PLoS One. 2021;16(6):e0252487. doi: 10.1371/journal.pone.0252487. - DOI - PMC - PubMed

MeSH terms

Substances