. 2024 Jul 18;9(16):e177152.
doi: 10.1172/jci.insight.177152.

NAD+ precursors prolong survival and improve cardiac phenotypes in a mouse model of Friedreich's Ataxia

Affiliations

NAD+ precursors prolong survival and improve cardiac phenotypes in a mouse model of Friedreich's Ataxia

Caroline E Perry et al. JCI Insight. .

Abstract

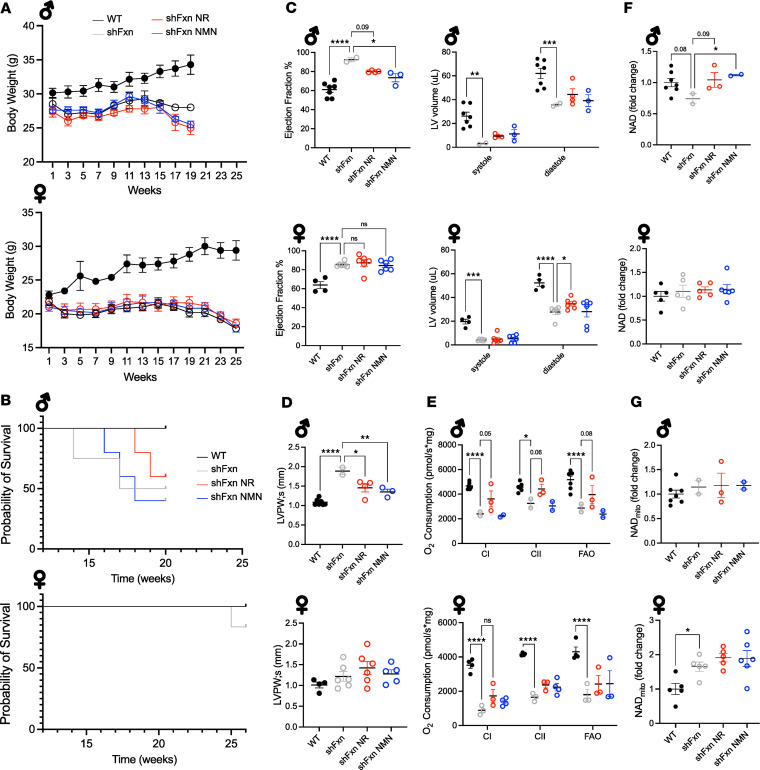
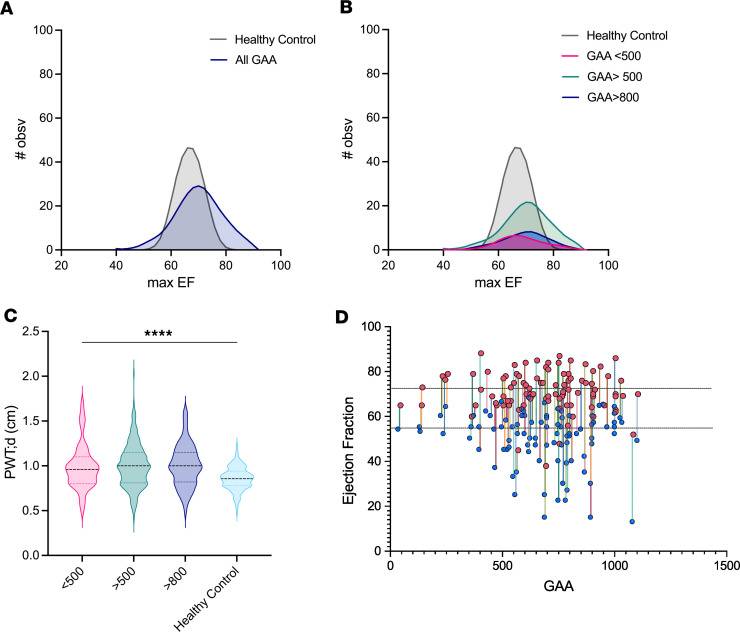
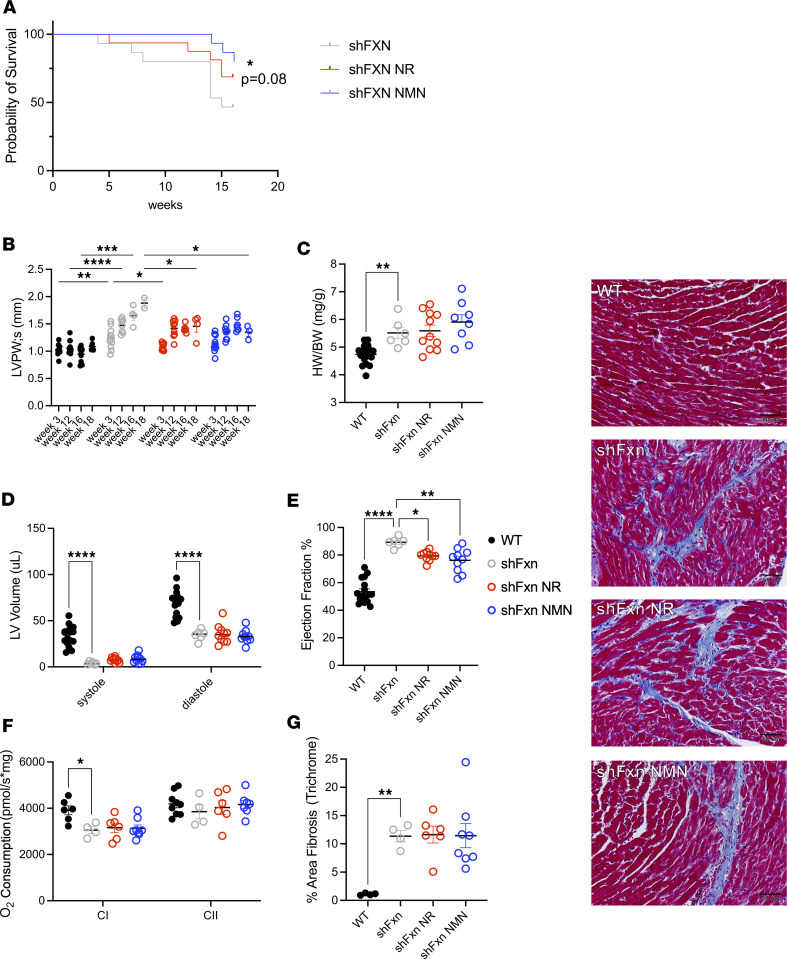
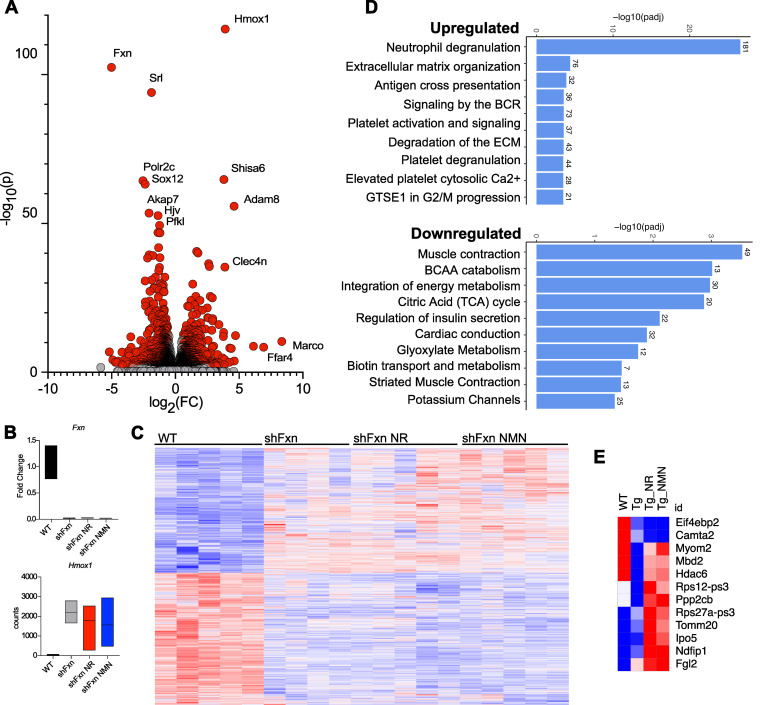
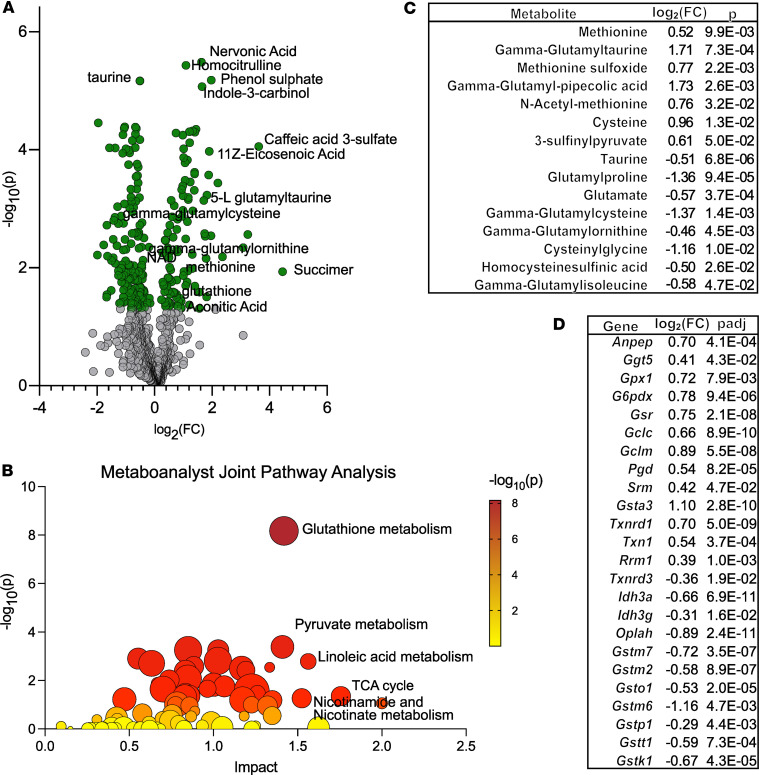
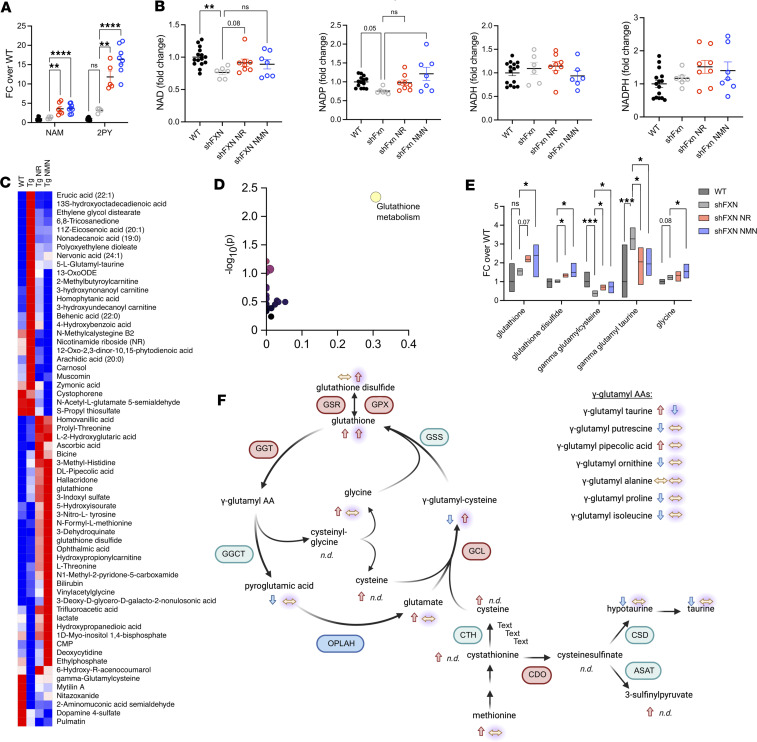
Friedreich's ataxia (FRDA) is a progressive disorder caused by insufficient expression of frataxin, which plays a critical role in assembly of iron-sulfur centers in mitochondria. Individuals are cognitively normal but display a loss of motor coordination and cardiac abnormalities. Many ultimately develop heart failure. Administration of nicotinamide adenine dinucleotide-positive (NAD+) precursors has shown promise in human mitochondrial myopathy and rodent models of heart failure, including mice lacking frataxin in cardiomyocytes. We studied mice with systemic knockdown of frataxin (shFxn), which display motor deficits and early mortality with cardiac hypertrophy. Hearts in these mice do not "fail" per se but become hyperdynamic with small chamber sizes. Data from an ongoing natural history study indicate that hyperdynamic hearts are observed in young individuals with FRDA, suggesting that the mouse model could reflect early pathology. Administering nicotinamide mononucleotide or riboside to shFxn mice increases survival, modestly improves cardiac hypertrophy, and limits increases in ejection fraction. Mechanistically, most of the transcriptional and metabolic changes induced by frataxin knockdown are insensitive to NAD+ precursor administration, but glutathione levels are increased, suggesting improved antioxidant capacity. Overall, our findings indicate that NAD+ precursors are modestly cardioprotective in this model of FRDA and warrant further investigation.

Keywords: Cardiology; Metabolism; Mitochondria; Neurological disorders.


Conflict of interest statement

Conflict of interest: JAB reports receiving research funding and materials from Pfizer, Elysium Health, and Metro International Biotech and consulting fees from Pfizer, Elysium Health, Altimmune, and Cytokinetics; he and SM hold a patent for using NAD+ precursors in liver injury (US 11,103,496 B2). DRL receives grant funding from Reata, PTC, Stealth, and Design. DJL is a salaried employee of Metro International Biotech.

Figures

Figure 1
Figure 1. Sexual dimorphism in survival and treatment responses in the shFxn mouse model.
(A) Body weights of male (top) and female (bottom) shFxn mice following the initiation of doxycycline at 12–16 weeks of age (n = 4–7). (B) Survival curves for each sex after doxycycline (n = 4–7). (C) Ejection fraction recorded at 18 weeks after doxycycline and LV volumes at end systole and diastole (n = 2–7). (D) Systolic LV posterior wall measurements (n = 2–7). (E) Respirometry in isolated heart mitochondria from males (20 weeks after doxycycline) and females (26 weeks after doxycycline) (n = 2–7). (F) Heart tissue NAD+ (n = 2–7). (G) Heart mitochondrial NAD+ (n = 2–7). A and E, 2-way ANOVA; B, Mantel-Cox test for survival; C, D, F, and G, 1-way ANOVA (*P ≤ 0.05, **P ≤ 0.01, ***P ≤ 0.001, ****P ≤ 0.0001).
Figure 2
Figure 2. Individuals with higher GAA repeat length are more likely to experience higher maximal EF.
(A and B) Frequency distribution of maximal EFs sorted by GAA (GAA1) repeat length on the shorter allele (n = 315). Curves generated by LOWESS regression with coarse smoothing on frequency distribution of maximum EF (bin size = 2). Simulated healthy control data generated by setting mean and SD with gaussian frequency based on ref. . (C) Posterior wall thickness at diastole at maximal EF (n = 315) compared with simulated healthy control data (57). (D) Individual patient EF range recorded throughout 6+ years sorted by GAA repeat length (n = 106). Peak EF is noted with pink circles, and minimum EF is noted with blue circles. Dotted lines represent minimum and maximum observed EFs in adolescents.
Figure 3
Figure 3. NR and NMN improve survival and heart function in male shFxn mice.
(A) Male shFxn mice treated with NAD+ precursors have significantly longer survival compared with nontreated mice. (B) NAD+ precursors significantly reduce LV posterior wall thickness at 16–18 weeks after doxycycline. (C) shFxn mice have increased heart weight relative to body weight at 16–18 weeks. (D and E) LV systolic and diastolic volumes and EF after 16–18 weeks measured by echocardiography. (F) Mitochondrial complex I respiration is modestly decreased in 16-week shFxn hearts. (G) Masson’s trichrome blue staining of LV section. Staining and quantification shows shFxn mice have fibrosis in hearts that is not reduced by treatment. Scale bar: 50 μM. A, pairwise Mantel-Cox test for survival vs. untreated, n = 10–11; B, D, and F, n = 4–12, 2-way ANOVA; C, E, and G, n = 4–12, 1-way ANOVA (*P ≤ 0.05, **P ≤ 0.01, ***P ≤ 0.001, ****P ≤ 0.0001).
Figure 4
Figure 4. shFxn hearts exhibit an mRNA signature of inflammation that is not affected by NAD+ precursor treatment.
(A) Volcano plot indicating upregulated and significantly downregulated genes in heart tissue of shFxn male mice at 16 weeks after doxycycline. Red are significantly upregulated or downregulated (Padj ≤ 0.05, FDR-adjusted Wald test). (B) Fxn is not recovered by precursor treatment (mean, lower, upper bound; WT: 1.085, 0.763, 1.402; shFxn: 0.019, 0.006, 0.025; NR: 0.021, 0.016, 0.030; NMN: 0.017, 0.012, 0.020), Hmox1 is highly induced in shFxn mice (WT: 151.6, 115, 196; shFxn: 2,303, 1,773, 2,909; NR: 1,906, 387, 2,649; NMN: 1,677, 581, 3,063). (C) Heatmap of all transcripts demonstrating minor transcriptional changes with treatment. (D) Upregulated and downregulated reactome terms in shFxn mice. (E) Subset of genes that are modified by NR and NMN.
Figure 5
Figure 5. Joint pathway analysis identifies glutathione metabolism as highly affected in shFxn hearts.
(A) Volcano plot indicating significantly depleted and enriched metabolites in shFxn heart tissue (P ≤ 0.05, 2-tailed t test). (B) Metaboanalyst joint pathway analysis using combined transcript data (Padj ≤ 0.05, Wald test, FDR-adjusted) and metabolite data (P ≤ 0.05, 2-tailed t test). (C) Glutathione synthesis–related metabolites modified in shFxn hearts. (D) Glutathione synthesis and function-related genes modified in shFxn hearts.
Figure 6
Figure 6. NAD+ precursor treatment amplifies glutathione synthesis in shFxn hearts.
(A) Plasma nicotinamide and 2-PY levels are increased in treated mice. (B) NAD+ and NADP+ are significantly depleted in shFxn hearts, with recovery of NADP with NMN treatment. NADH and NADPH levels are unchanged with loss of frataxin and with precursor treatment. (C) Heatmap of metabolites significantly changed with NR and NMN treatment (pooled analysis). Bolded metabolites were significantly modified by depletion of frataxin. (D) Using list in C, Metaboanalyst identified glutathione metabolism as significantly changed by treatment in shFxn hearts. (E) Glutathione related metabolites are altered in shFxn mice and treated mice. [Box Plots: Metabolite-[group:mean, lower, upper]] [Glutathione-[WT:1, 0.46, 1.97; shFxn:1.57, 1.33, 1.71; NR:2.189, 2.04, 2.39; NMN:2.40, 1.24, 2.97] Glutathione Disulfide-[WT:1, 0.68, 1.16; shFxn:1.02, 0.95, 1.11; NR:1.35, 1.23, 1.43; NMN:1.49, 1.25, 2.00] γ-glutamylcysteine-[WT:1, 0.71, 1.52; shFxn:0.39, 0.22, 0.53; NR:0.72, 0.54, 0.83; NMN:0.72, 0.39, 1.00] γ-glutamyltaurine-[WT:1, 0.17, 2.97; shFxn:3.27, 2.70, 3.87; NR:2.05, 0.84, 2.81; NMN:1.95, 1.32, 2.77] Glycine-[WT:1, 0.86, 1.14; shFxn:1.21, 1.09, 1.35; NR:1.34, 1.02, 1.55; NMN:1.54, 1.185, 1.94]. Brackets indicate pairwise comparisons with P values indicated for several that did not reach significance. (F) Model representing metabolite changes in glutathione synthesis pathways. Left arrow is direction in shFxn vs. WT mice, right arrow with glow is direction in shFxn vs. treated mice, red symbols are upregulated in shFxn mice, blue symbols are downregulated, and green are unchanged. A, B, and E, n = 6–17, 1-way ANOVA, Fisher’s LSD test); C, n = 6–17, normalized ion value, 2-tailed t test (*P ≤ 0.05, **P ≤ 0.01, ***P ≤ 0.001, ****P ≤ 0.0001).

References

    1. Bidichandani SI, et al. In: Adam MP, Feldman J, Mirzaa GM, et al., eds. GeneReviews [Internet]. Seattle (WA): University of Washington, Seattle; 1998.
    1. Campuzano V, et al. Friedreich’s ataxia: autosomal recessive disease caused by an intronic GAA triplet repeat expansion. Science. 1996;271(5254):1423–1427. doi: 10.1126/science.271.5254.1423. - DOI - PubMed
    1. Dürr A, et al. Clinical and genetic abnormalities in patients with Friedreich’s ataxia. N Engl J Med. 1996;335(16):1169–1175. doi: 10.1056/NEJM199610173351601. - DOI - PubMed
    1. Rotig A, et al. Aconitase and mitochondrial iron-sulphur protein deficiency in Friedreich ataxia. Nat Genet. 1997;17(2):215–217. doi: 10.1038/ng1097-215. - DOI - PubMed
    1. Patel M, et al. Progression of Friedreich ataxia: quantitative characterization over 5 years. Ann Clin Transl Neurol. 2016;3(9):684–694. doi: 10.1002/acn3.332. - DOI - PMC - PubMed

MeSH terms