. 2024 Aug;12(8):e70001.
doi: 10.1002/iid3.70001.

Evaluation of the protective effect of Curcuma longa and PPARγ agonist, pioglitazone on paraquat-induced lung injury in rats

Affiliations

Evaluation of the protective effect of Curcuma longa and PPARγ agonist, pioglitazone on paraquat-induced lung injury in rats

Mohammad Hossein Eshaghi Ghalibaf et al. Immun Inflamm Dis. 2024 Aug.

Abstract

Background: The inhalation of paraquat (PQ), one of the most widely used herbicides in the world, can result in lung injury. Curcuma longa (Cl) has long history in traditional and folk medicine for the treatment of a wide range of disorders including respiratory diseases.

Aim: The aim of the present work was to evaluate the preventive effect of Cl on inhaled PQ-induced lung injury in rats.

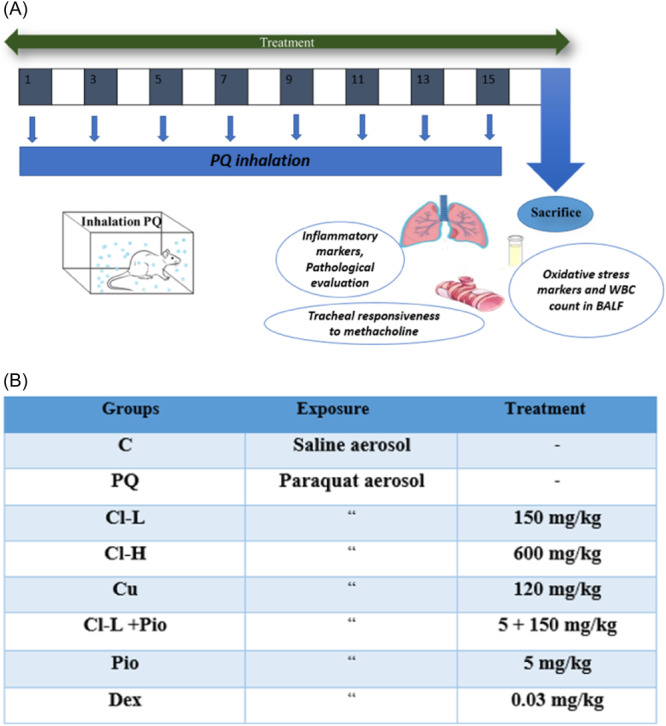
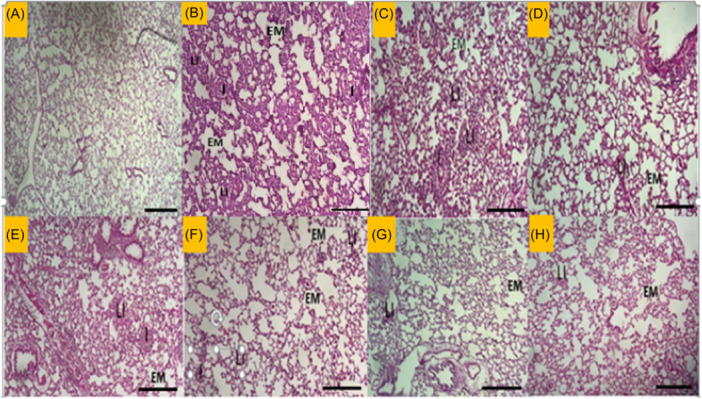
Methods: Male Wistar rats were divided into 8 groups (n = 7), one group exposed to saline (control) and other groups exposed to PQ aerosol. Saline (PQ), Cl extract, (two doses), curcumin (Cu), pioglitazone (Pio), and the combination of Cl-L + Pio and dexamethasone (Dex) were administered during the exposure period to PQ. Total and differential white blood cell (WBC) counts, oxidant and antioxidant indicators in the bronchoalveolar lavage (BALF), interleukin (IL)-10, and tumor necrosis alpha (TNF-α) levels in the lung tissues, lung histologic lesions score, and air way responsiveness to methacholine were evaluated.

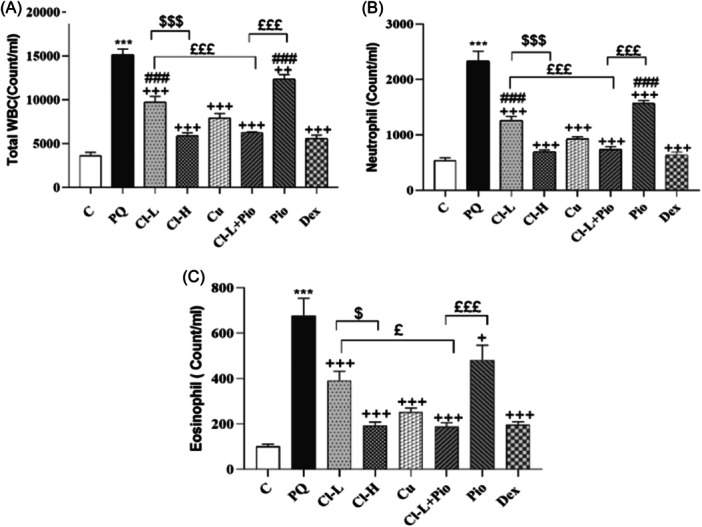
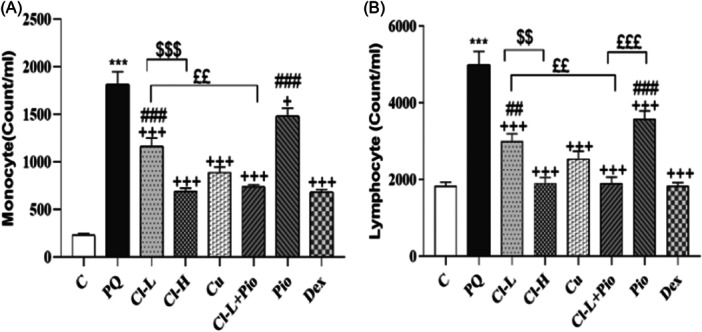
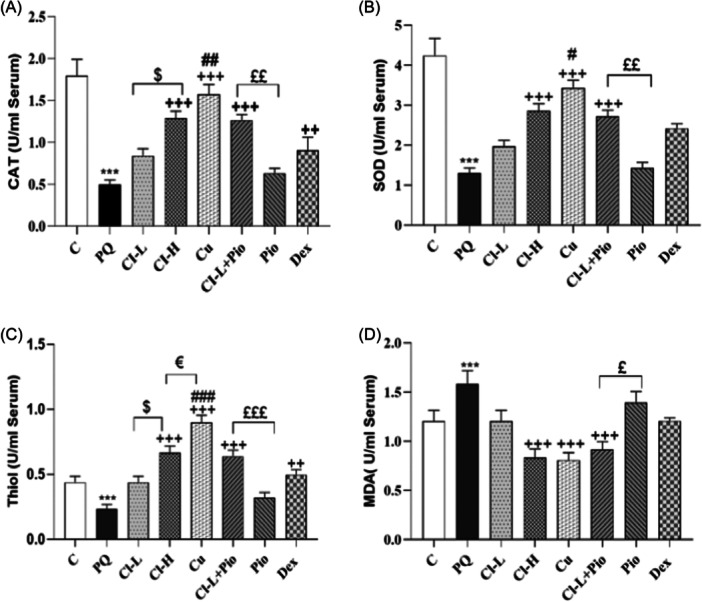
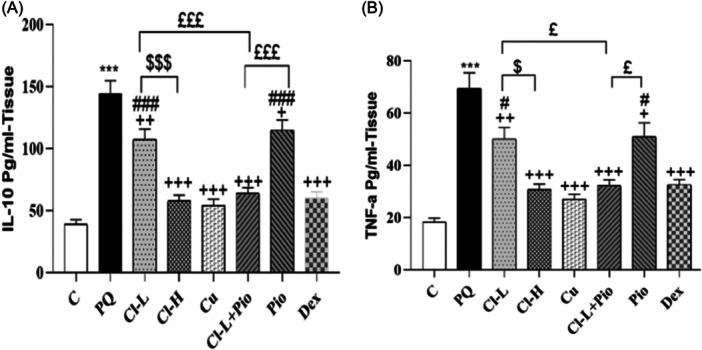
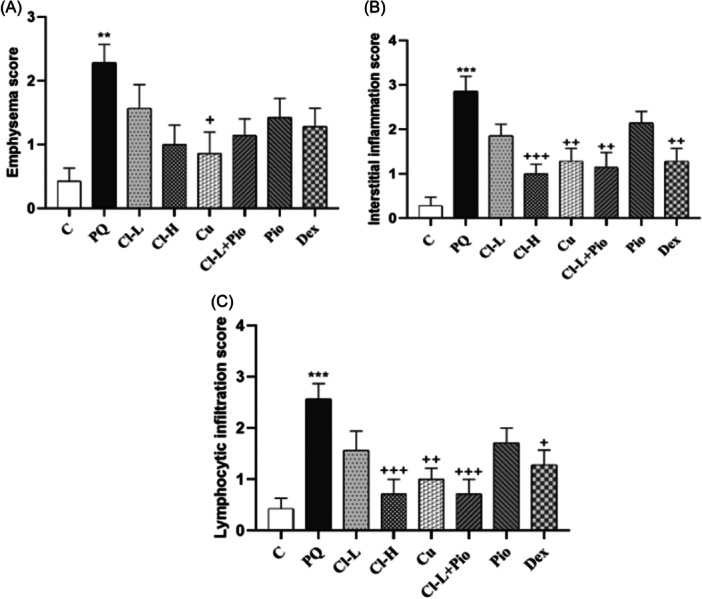
Results: WBC counts (Total and differential), malondialdehyde level, tracheal responsiveness (TR), IL-10, TNF-α and histopathological changes of the lung were markedly elevated but total thiol content and the activities of catalase and superoxide dismutase were decreased in the BALF in the PQ group. Both doses of Cl, Cu, Pio, Cl-L + Pio, and Dex markedly improved all measured variables in comparison with the PQ group.

Conclusion: CI, Pio, and Cl-L + Pio improved PQ-induced lung inflammation and oxidative damage comparable with the effects of Dex.

Keywords: Curcuma longa; inflammation; lung injury; oxidative stress; paraquat.


Conflict of interest statement

The authors declare no conflict of interest.

Figures

Figure 1
Figure 1
Protocol of animal exposure to PQ aerosol (A) and treated groups (B). In the control group (group C), rats were exposed to saline aerosol. Seven groups were exposed to PQ aerosol at the dose of 54 mg/m3 and treated with: (1) Salin (PQ group), (2 and 3) 150 and 600 mg/kg/day of Cl extract (Cl‐L and Cl‐H groups), (4) 120 mg/kg of curcumin (Cu), (5) 5 mg/kg/day of pioglitazone (Pio), (6) Combination of Pio + Cl‐L (Pio + Cl‐L), and (7) 0.03 mg/kg/day of dexamethasone (Dex) for 16 days during exposure to PQ by gavage except for Pio which was administered by i.p. Rats were exposed to saline or PQ aerosol, 8 times in every other day order, each day for 30 min.
Figure 2
Figure 2
Exposure to PQ affects total WBC (A), neutrophil (B), and eosinophil (C) counts in the BALF (Count/ml) in comparison with the control group (Ctrl) but treatment with 150 and 600 mg/kg/day Cl, (Cl‐L and Cl‐H),120 mg/kg curcumin (Cu), 5 mg/kg pioglitazone (Pio), combination of Cl‐L + Pio or 0.03 mg/kg dexamethasone (Dex) improved them. PQ versus control group; ***p < .001. Treatment groups versus PQ group; + p < .05, ++p < .01 and +++p < .001. Dex versus other treated groups; ≠p < .05, ≠≠p < .01, and ≠≠≠p < .001. Cl‐H versus Cl‐L; $p < .05 and $$p < .01. Cl‐L + Pio versus Cl‐L and Pio alone; £p < .05 and £££p < .001. In each group, seveen rats were examined and the results were expressed as mean ± SEM One‐way ANOVA followed by Tukey's multiple comparison test was applied for comparisons among different groups. ANOVA, analysis of variance; PQ, paraquat; SEM, standard error of the mean; WBC, white blood cell.
Figure 3
Figure 3
Exposure to PQ affects Monocyte (A)and lymphocyte (B) counts in the BALF (Count/ml) in comparison with the control group (Ctrl) but treatment with 150 and 600 mg/kg/day Cl, (Cl‐L and Cl‐H), 120 mg/kg curcumin (Cu), 5 mg/kg pioglitazone (Pio), combination of Cl‐L + Pio or 0.03 mg/kg dexamethasone (Dex) improved them. PQ versus control group; ***p < .001. Treatment groups versus PQ group; +++p < .001. Dex versus other treated groups; ##p < .01 and ###p < .001. Cl‐H versus Cl‐L; $$p < .01 and $$$p < .001. Cl‐L + Pio versus Cl‐L and Pio alone; £p < .05, ££p < .01 and £££p < .001. In each group, seven rats were examined and the results were expressed as mean ± SEM One‐way ANOVA followed by Tukey's multiple comparison tests was applied for comparisons among different groups. ANOVA, analysis of variance; PQ, paraquat; SEM, standard error of the mean; WBC, white blood cell.
Figure 4
Figure 4
Exposure to PQ affects oxidant and antioxidant biomarkers. CAT (A), SOD (B), Thiol (C), and MDA (D) in the BALF (per mL) in comparison with the control group (Ctrl) but treatment with 150 and 600 mg/kg/day Cl, (Cl‐L and Cl‐H), 120 mg/kg curcumin (Cu), 5 mg/kg pioglitazone (Pio), combination of Cl‐L + Pio or 0.03 mg/kg dexamethasone (Dex) improved them. PQ versus control group; ***p < .001. Treatment groups versus PQ group; +++p < .001. Dex versus other treated groups; ##p < .01 and ###p < .001. Cl‐H versus Cl‐L; $p < .05. Cl‐L + Pio versus Cl‐L and Pio alone; £p < .05, ££p < .01 £££p < .001. Cu versus Cl‐H; €p < .05. In each group, 7 rats were examined and the results were expressed as mean ± SEM One‐way ANOVA followed by Tukey's multiple comparison tests was applied for comparisons among different groups. ANOVA, analysis of variance; BALF, bronchoalveolar lavage; CAT, catalase; MDA, malondialdehyde; PQ, paraquat; SOD, superoxide dismutase; SEM, standard error of the mean; WBC, white blood cell.
Figure 5
Figure 5
Exposure to PQ affects cumulative concentration‐response curves to methacholine (A) and values of EC50 (B) in comparison with the control group (Ctrl) but treatment with 150 and 600 mg/kg/day Cl, (Cl‐L and Cl‐H), 120 mg/kg curcumin (Cu), 5 mg/kg pioglitazone (Pio), combination of Cl‐L + Pio or 0.03 mg/kg dexamethasone (Dex) improved them. PQ versus control group; ***p < .001. Treatment groups versus PQ group ++p < .01, +++p < .001. Cl‐L + Pio versus Cl‐L and Pio alone; £p < .05. In each group seven rats were examined and the results were expressed as mean ± SEM One‐way ANOVA followed by Tukey's multiple comparisontestst was applied for comparisons among different groups. ANOVA, analysis of variance; PQ, paraquat; SEM, standard error of the mean.
Figure 6
Figure 6
Exposure to PQ affects the levels of IL‐10 (A) and TNF‐a (B) in the lung tissue (per ml) in comparison with the control group (Ctrl) but treatment with 150 and 600 mg/kg/day Cl, (Cl‐L and Cl‐H), 120 mg/kg curcumin (Cu), 5 mg/kg pioglitazone (Pio), a combination of Cl‐L + Pio or 0.03 mg/kg dexamethasone (Dex) improved them. PQ versus control group; ***p < .001. Treatment groups versus PQ group; +++p < .001. Dex versus other treated groups; #p < .05 and ###p < .001. Cl‐H versus Cl‐L; $p < .05 and $$$p < .001. Cl‐L + Pio versus Cl‐L and Pio alone; £p < .05 and £££p < .001. In each group, 7 rats were examined and the results were expressed as mean ± SEM One‐way ANOVA followed by Tukey's multiple comparison test was applied for comparisons among different groups. ANOVA, analysis of variance; PQ, paraquat; SEM, standard error of the mean.
Figure 7
Figure 7
Exposure to PQ affects the score of emphysema (A), interstitial inflammation (B) and lymphocytic infiltration (C) in the lung tissue in comparison with the control group (Ctrl) but treatment with 600 mg/kg/day Cl, (Cl‐H), 120 mg/kg curcumin (Cu), combination of Cl‐L + Pio or 0.03 mg/kg dexamethasone (Dex) improved them. PQ versus control group; ***p < .001 and **p < .01. Treatment groups versus PQ group; +++p < .001, ++p < .01 and + p < .05. In each group, seven rats were examined and the results were expressed as mean ± SEM One‐way ANOVA followed by Tukey's multiple comparison test was applied for comparisons among different groups. ANOVA, analysis of variance; PQ, paraquat; SEM, standard error of the mean.
Figure 8
Figure 8
Hematoxylin and eosin (H&E) staining shows pathological changes in lung tissues in rats after PQ inhalation (Scale bar = 100 μm (magnification, ×100). (A), control group. (B), PQ‐treated group. (C), Cl‐L group. (D), Cl‐H group. (E), Cu group. (F), Cl‐L+Pio group. (G), Pio group. (H), Dex group. EM, Emphysema; I, Inflammation; LI, Lymphocyte infiltration.

Similar articles

References

    1. Walsh A, Kingwell R. Economic implications of the loss of glyphosate and paraquat on Australian mixed enterprise farms. Agricult Sys. 2021;193:103207.
    1. Deroco PB, Wachholz Junior D, Kubota LT. Silver Inkjet‐Printed electrode on paper for electrochemical sensing of paraquat. Chemosensors. 2021;9(4):61.
    1. Marambe B, Herath S. Banning of herbicides and the impact on agriculture: the case of glyphosate in Sri Lanka. Weed Sci. 2020;68(3):246‐252.
    1. Todd NW, Luzina IG, Atamas SP. Molecular and cellular mechanisms of pulmonary fibrosis. Fibrogenesis Tissue Repair. 2012;5(1):11. - PMC - PubMed
    1. Wang T, Ou L, Li X, et al. Inhibition of Galectin‐3 attenuates silica particles‐induced silicosis via regulating the GSK‐3β/β‐catenin signal pathway‐mediated epithelial‐mesenchymal transition. Chem Biol Interact. 2022;368:110218. - PubMed

Publication types

MeSH terms

LinkOut - more resources