. 2024 Dec 2;14(12):2450-2470.
doi: 10.1158/2159-8290.CD-24-0168.

TCR-Engineered T Cells Directed against Ropporin-1 Constitute a Safe and Effective Treatment for Triple-Negative Breast Cancer

Affiliations

TCR-Engineered T Cells Directed against Ropporin-1 Constitute a Safe and Effective Treatment for Triple-Negative Breast Cancer

Dian Kortleve et al. Cancer Discov. .

Abstract

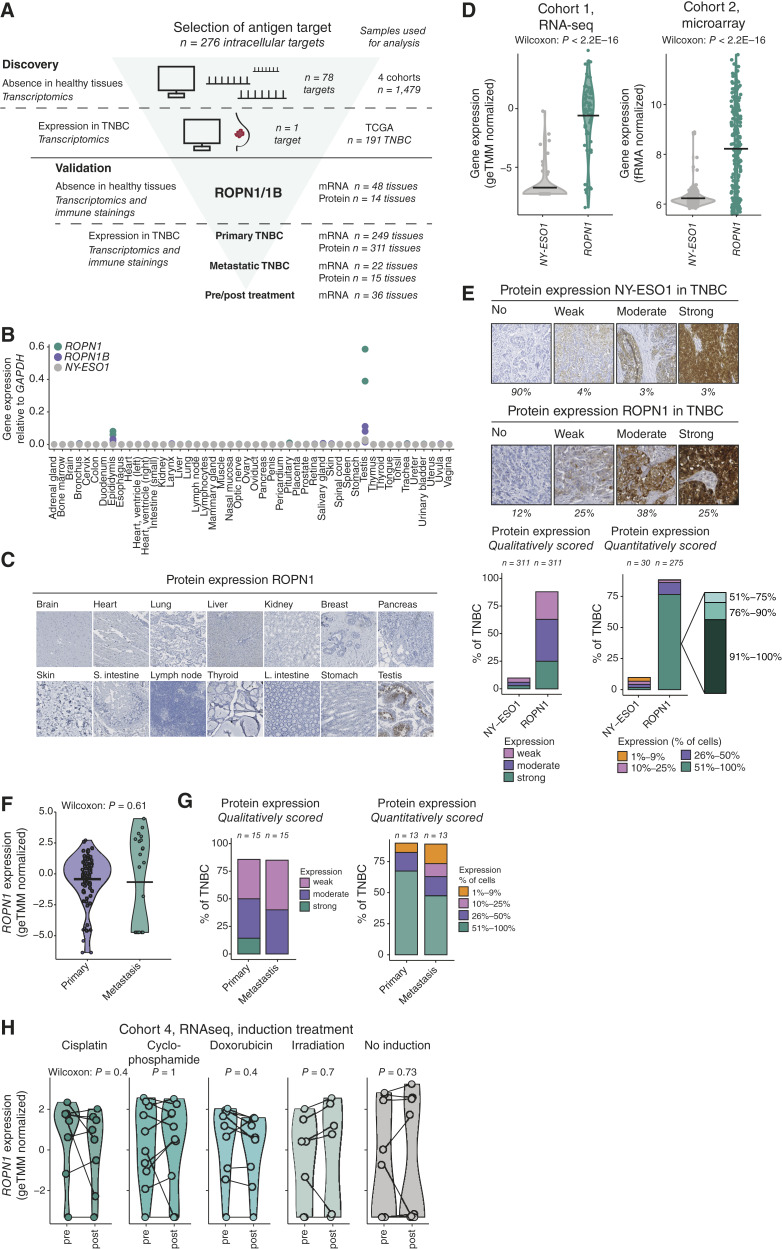
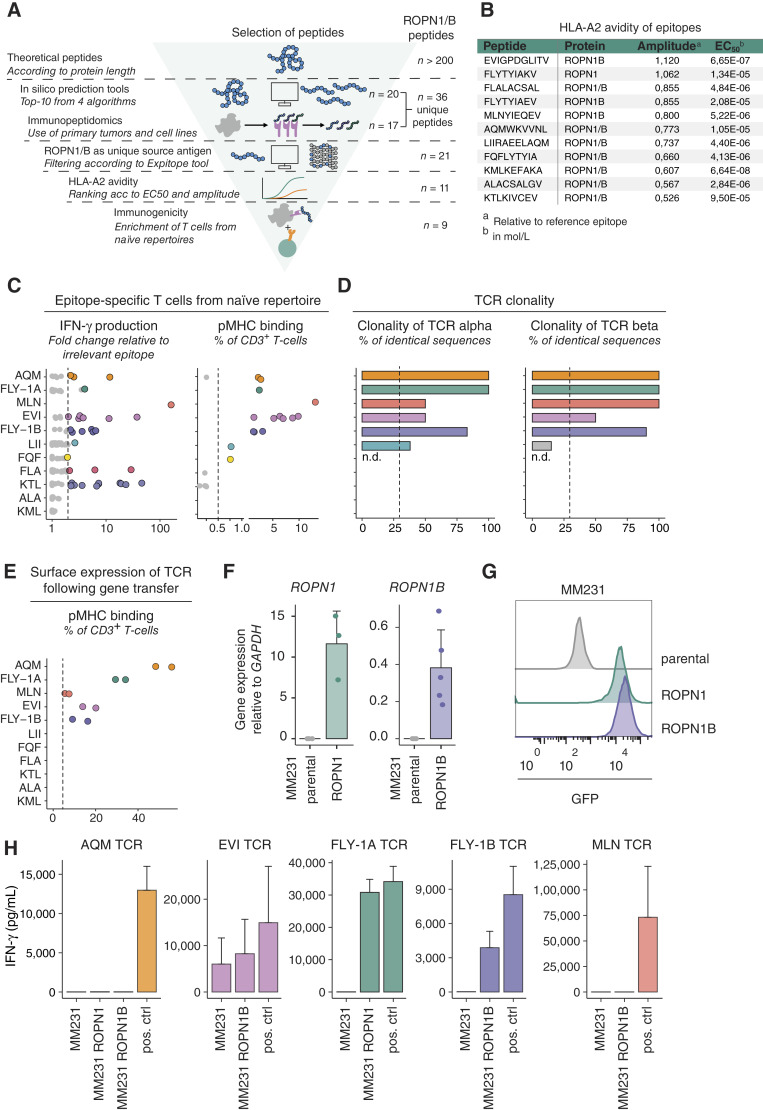
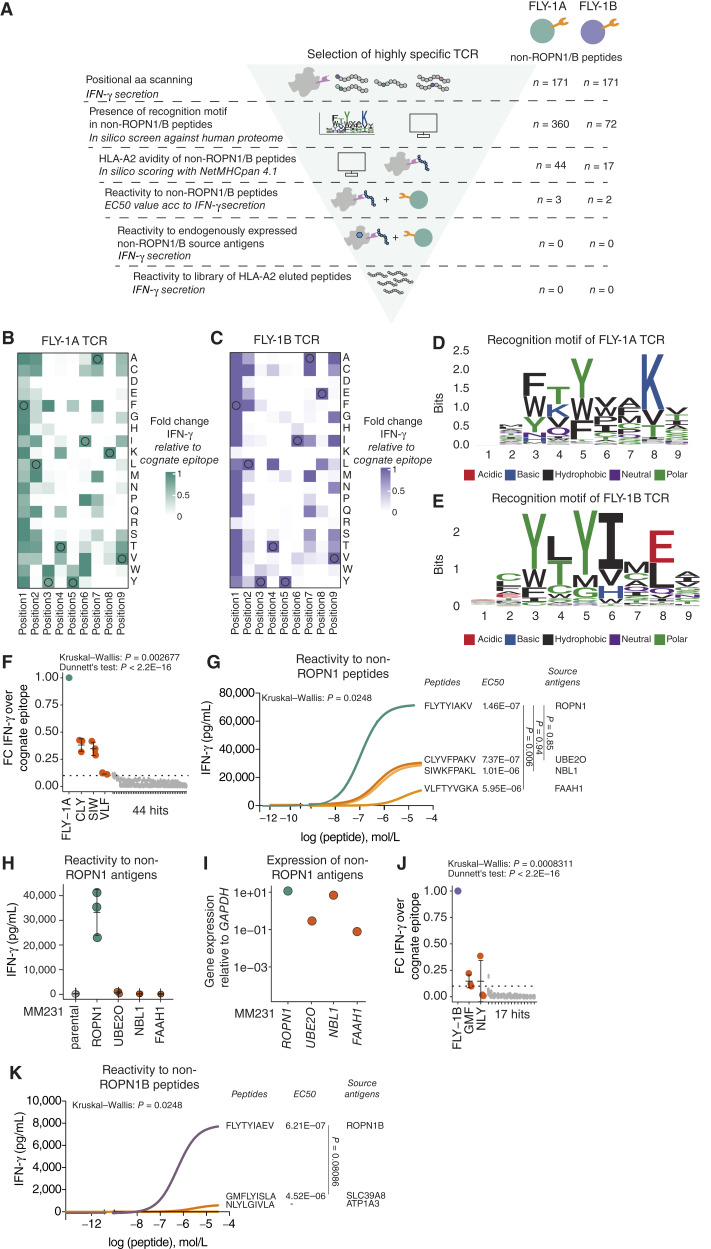
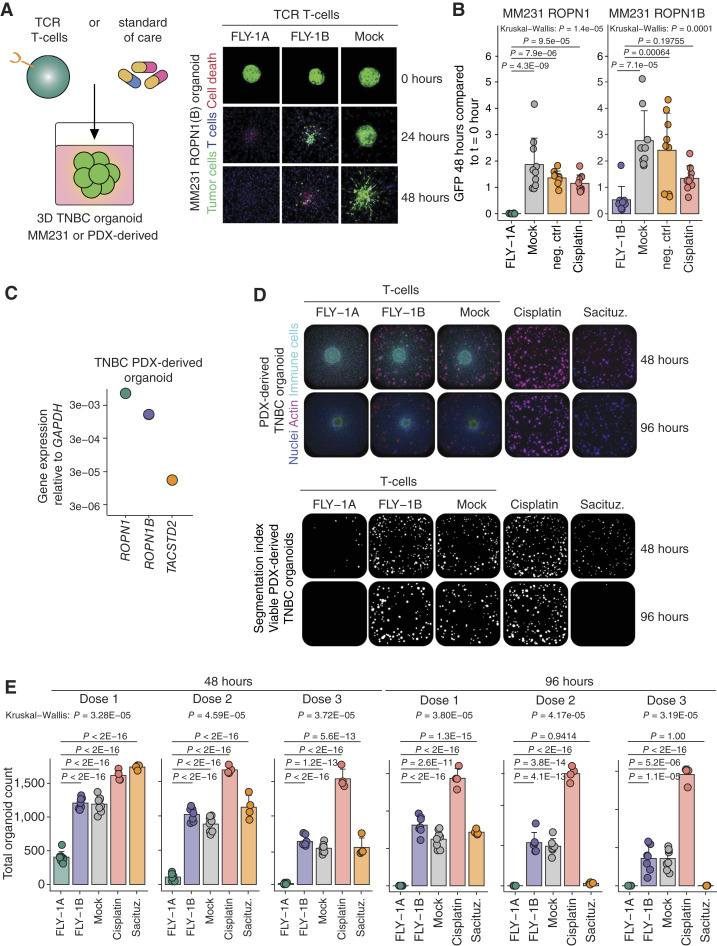
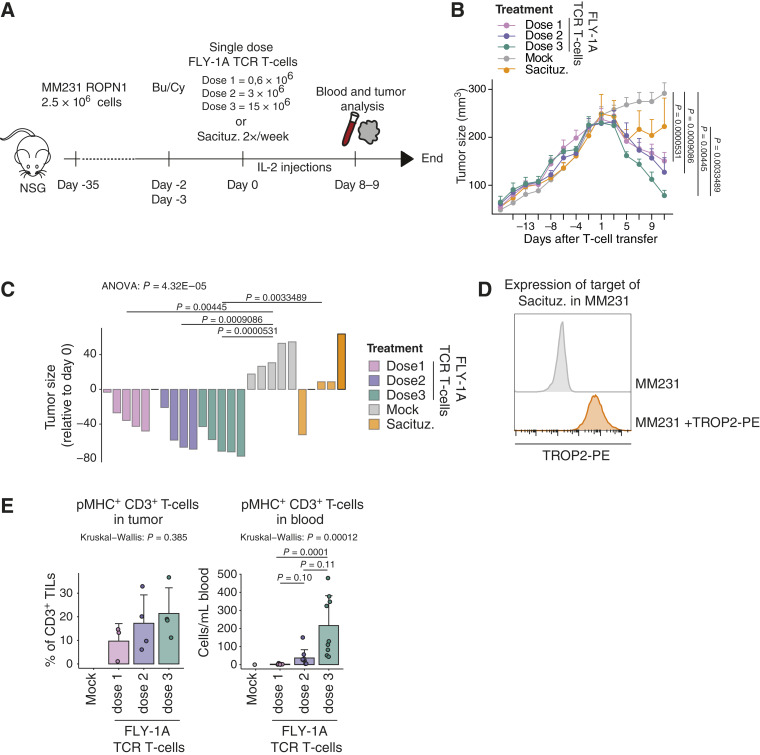
Triple-negative breast cancer (TNBC) has an urgent need for new therapies. We discovered Ropporin-1 (ROPN1) as a target to treat TNBC with T cells. ROPN1 showed high and homogenous expression in 90% of primary and metastatic TNBC but not in healthy tissues. Human leukocyte antigen-A2-binding peptides were detected via immunopeptidomics and predictions and used to retrieve T-cell receptors (TCR) from naïve repertoires. Following gene introduction into T cells and stringent selection, we retrieved a highly specific TCR directed against the epitope FLYTYIAKV that did not recognize noncognate epitopes from alternative source proteins. Notably, this TCR-mediated killing of three-dimensional (3D) tumoroids in vitro and tumor cells in vivo and outperformed standard-of-care drugs. Finally, the T-cell product expressing this TCR and manufactured using a clinical protocol fulfilled standard safety and efficacy assays. Collectively, we have identified and preclinically validated ROPN1 as a target and anti-ROPN1 TCR T cells as a treatment for the vast majority of patients with TNBC. Significance: Metastatic TNBC has a dismal prognosis. This study discovers Ropporin-1 as a target for T-cell therapy for most patients. The selected TCR is highly specific and sensitive in advanced models, and preclinical testing shows that the T-cell product expressing this TCR, manufactured according to good manufacturing practice, has favorable safety and potency.


Conflict of interest statement

D. Hammerl reports grants from Dutch Cancer Society and Health Holland Public-private partnership during the conduct of the study and has a patent for P128827EP00 pending. M.T.A. de Beijer reports personal fees from the Dutch Ministry of Health, Welfare and Sport and personal fees from Erasmus University Medical Center outside the submitted work and has a patent for WO 2021/110919 pending to ISA Pharmaceuticals B.V. and Erasmus University Medical Center. S.I. Buschow reports grants and nonfinancial support from ISA Pharmaceuticals BV, and Merus BV, Pfizer Inc. and grants and nonfinancial support from Numab therapeutics AG outside the submitted work. M. Kok reports grants from Bristol Myers Squibb, Roche, and AZ, other support from MSD, AZ, and Gilead, and other support from BioNTech outside the submitted work. E.H.J. Danen reports grants from Genmab B.V. outside the submitted work. J.W.M. Martens reports grants from the Dutch Cancer Society during the conduct of the study and grants from the Dutch Cancer Society, Netherlands Organisation for Scientific Research (NWO), European Research Council, S. Komen Foundation, Erasmus University Medical Center Rotterdam, the Netherlands, breast cancer Now, MLDS NL, GSK, Pfizer, Philips, Cergentis, Therawis, Pamgene, Cytrotrack, and Menarini and personal fees from Novartis outside the submitted work. R.J.M. Abbott reports grants from Health∼Holland, other support from Swanbridge Capital, Van Herk Ventures, and Thuja Capital during the conduct of the study, and personal fees and other support from Enara Bio Ltd. and Adaptimmune Ltd. outside the submitted work. R. Debets reports grants from Health∼Holland Public-Private Partnership award EMC-TKI LSH20020, Erasmus MC Daniel den Hoed Foundation, and the Dutch Cancer Society KWF 2014-7087 during the conduct of the study and grants from MSD, Bayer, and Pan Cancer T outside the submitted work, as well as has patents for P128827EP00 and P136875EP00 pending and licensed to Pan Cancer T and a patent for P130556EP00 pending. No disclosures were reported by the other authors.

Figures

Figure 1.
Figure 1.
ROPN1/B is absent in healthy tissues and highly and homogenously present in primary and metastatic TNBC independent of pretreatment. A, Flowchart of the discovery of ROPN1/B as a target for T-cell treatment of TNBC and validation of its tumor-restricted expression using healthy tissues, as well as primary and metastatic TNBC tissues. Intracellular targets (CGAs: n = 276) were screened for absent expression in healthy tissues (n = 1,479 tissues) and expression in TNBC (n = 191 tissues). ROPN1/B mRNA and protein expression was further validated in multiple sets of healthy tissues (two additional cohorts) and four different cohorts of patient tumor tissues (see “Methods” for details). B, Dot plot shows gene expressions as fold changes relative to GAPDH (2−dCt) according to RT-qPCR using a cDNA library of 48 healthy tissue samples. NY-ESO1 was used as a reference. Green, ROPN1; purple, ROPN1B; gray, NY-ESO1 (CTAG1B), n = 2 to 3 per target antigen. C, Representative immune stainings of ROPN1/B using an array of 14 healthy tissues (2–6 donors per tissue, total n = 66). D, Violin plots show the distribution of gene expression of NY-ESO1 (CTAG1B, gray) and ROPN1 (green) in TNBC cohort 1 (n = 66, geTMM normalized) and cohort 2 (n = 183, fRMA-normalized; see “Methods” for details on cohorts). Data were analyzed using the Wilcoxon signed-rank test: cohort 1: P < 2.2E16; cohort 2: P < 2.2E16. E, Representative immune stainings of TNBC categorized according to staining intensity with different intensities for NY-ESO1 (top) and ROPN1/B (bottom). Stacked bar graphs (middle) show the fraction of TNBC tumors with weak, moderate, and strong immune staining of NY-ESO1 or ROPN1/B [tissue microarrays (TMA), n = 311]. Stacked bar graphs (right) show fractions of TNBC tumors with either 1% to 9%, 10% to 25%, 26% to 50%, or 51% to 100% of tumors cells positive for NY-ESO1 or ROPN1/B protein; the latter category of 51% to 100% ROPN1-stained cells is further subdivided into the fractions: 51% to 75%, 76% to 90%, and 91% to 100% (in zoomed-in stacked bar). F, Violin plot shows the distribution of gene expressions of ROPN1/B in primary and metastatic TNBC from TNBC cohort 1 (n = 66, geTMM normalized) and cohort 3 (n = 22) following batch correction. Data were analyzed using the Wilcoxon signed-rank test: P = 0.61. G, Stacked bar graphs (left) show the fraction of primary and metastatic TNBC with weak, moderate, and strong immune staining of ROPN1/B (whole tissue sections, n = 15 paired samples). Stacked bar graphs (right) show the fraction of primary and metastatic TNBC with either 1% to 9%, 10% to 25%, 26% to 50%, or 51% to 100% of tumor cells positive for ROPN1/B. H, Violin plots show the distribution of gene expression of ROPN1/B in pre- and post-induction treatment biopsies of metastatic TNBC retrieved from cohort 4 (n = 53 of which n = 44 are paired samples, geTMM normalized). Data of paired pre/postsamples was analyzed using the Wilcoxon signed-rank test: cisplatin: n = 8, P = 0.4; cyclophosphamide: n = 10, P = 1; doxorubicin: n = 9, P = 0.4; irradiation: n = 7, P = 0.7; no induction: n = 10, P = 0.73. ACT: L. intestine, Large intestine; S. intestine, small intestine.
Figure 2.
Figure 2.
Retrieval and selection of ROPN1/B peptides according to uniqueness and HLA-A2 avidity, as well as natural TCRs against endogenously processed epitopes. A, Flowchart of retrieval and selection of ROPN1/B peptides according to in silico predictions (n = 20) and peptide elution (n = 17), resulting in n = 37 identified peptides, as well as non-cross-reactivity (n = 21, avidity for HLA-A2 (n = 11) and immunogenicity (n = 9; Methods for details on each tool/assay and Supplementary Table S1 for an overview of the results per tool). B, The table presents the overview of HLA-A2 binding characteristics for the 11 shortlisted peptides that went into T-cell enrichments. The gp100 epitope YLEPGPVTA (YLE) served as a reference epitope. Amplitudes are expressed as FC of median fluorescent intensity (MFI) of anti-HLA-A2-PE relative to YLE at highest peptide concentrations, and EC50 values (mean, calculated via GraphPad Prism 5.0) are listed in molarity (mol/L). C, Dots represent enriched T-cell populations (with peptides from B and each dot representing a single enrichment) according to FC of IFN-γ production compared with irrelevant epitope (RP; left). Epitope stimulated T cells which produced minimally 200 pg/mL, and 2× more IFN-γ than RP stimulated T cells were stained for pMHC binding, which is shown as percentage of CD3+ T cells (right). D, Clonality of TCRα and TCRβ sequences from epitope-specific T-cell populations (from C) are shown as percentage of total number of sequences. E, TCRαβ combinations derived from clonal populations (from D) were introduced into T cells and tested for pMHC binding, again shown as percentage of CD3+ T cells. Each epitope in CE is shown with a unique color, and when dots are presented in gray, these epitopes did not meet the selection criteria for further characterization (Methods; Supplementary Fig. S8). F, Bar plots represent gene expression of ROPN1/B using MM231 transfectants depicted as FC relative to GAPDH (2−∆Ct) according to RT-qPCR. ROPN1-expressing MM231 cells are visualized in green (n = 3), ROPN1B-expressing MM231 cells in purple (n = 5), and parental MM231 cells (not expressing ROPN1/B) in gray (n = 5). Mean and SD are shown. G, Representative histograms show MFI of GFP expression of ROPN1-expressing MM231 (green), ROPN1B-expressing MM231 (purple), and parental MM231 (not expressing GFP, gray). H, Bar plots display the ability of TCR T cells (from E) to recognize endogenously processed and presented cognate epitope. IFN-γ levels (in pg/mL) were measured upon stimulation of TCR T cells with ROPN1/B-expressing or parental MM231 (F and G). Positive controls are BSM cells loaded with cognate epitope. Mean and SD are shown.
Figure 3.
Figure 3.
TCRs directed against FLY-1A and FLY-1B have a strict recognition motif and specifically recognize cognate but not alternative epitopes. A, Schematic overview of experiments performed to determine TCR specificity (see “Methods” for details). Heatmap shows the relative IFN-γ production by (B) FLY-1A TCR T cells or (C) FLY-1B TCR T cells upon positional amino acid scanning of the cognate epitope. TCR T cells were cocultured with BSM cells loaded with single amino acid variants that cover all amino acids at every position of the cognate epitope (n = 171). T-cell IFN-γ production is expressed as FC compared with the cognate FLY-1A epitope (n = 3). Original amino acids from the cognate epitope are circled. D, Sequence logo of the recognition motif of FLY-1A TCR T cells. E, Sequence logo of the recognition motif of FLY-1B TCR T cells. The height of each letter is scaled in bits using the R package ggseqlogo and represents the probability of that amino acid at that position. The colors of the amino acids represent the chemical properties explained below the logo. Motifs were queried against a human protein database using ScanProsite, which yielded 44 non-ROPN1 for FLY-1A TCR T cells and 17 non-ROPN1B peptides for FLY-1B TCR T cells, respectively, that harbored the recognition motif and were predicted to bind to HLA-A2 according to NetMHCpan 4.1. F, Dot plot shows IFN-γ production by FLY-1A TCR T cells upon stimulation with 44 peptides (from D, 10 μg/mL) expressed as FC compared with the cognate epitope (n = 3). Mean and SD are shown. The Kruskal–Wallis rank test was performed followed by Dunnett’s multiple comparisons test: P < 2.2E16. G, Representative dose response curves of FLY-1A TCR T cells following exposure to non-ROPN1 peptides from D with FC > 0.1. These peptides included CLYVFPAKV (CLY), SIWKFPAKL (SIW), and VLFTYVGKA (VLF; depicted in orange); the cognate FLY-1A epitope was included as a comparator (green; n = 3). Mean EC50 values (in mol/L, n = 3) and source antigens of peptides are shown on the right side of the plot. The Kruskal–Wallis rank test was performed followed by Dunnett’s multiple comparisons test: CLY vs. FLY-1A: P = 0.85; SIW vs. FLY-1A: P = 0.94; VLF vs. FLY-1A: P = 0.0060. H, Dot plots display the lack of ability of FLY-1A TCR T cells to recognize endogenously expressed non-ROPN1 source antigens. IFN-γ levels (in pg/mL) were measured upon stimulation of FLY-1A TCR T cells with MM231 expressing one of the three non-ROPN1 antigens (shown in orange) or ROPN1 (used as a comparator, shown in green; n = 3). I, Dot plot represents gene expression of the non-ROPN1 antigens in transfected MM231 cells. Gene expression of the source antigens is depicted as FC relative to GAPDH (2−∆Ct) according to RT-qPCR; colors are as in F (n = 1). J, Dot plot shows IFN-γ production by FLY-1B TCR T cells upon stimulation with 17 peptides (from in silico screen against human proteome using the recognition motif from E, 10 μg/mL), expressed as FC compared with the cognate epitope (n = 3). The Kruskal–Wallis rank test was performed followed by Dunnett’s multiple comparisons test: P < 2.2E16. Individual points, mean, and SD are shown. K, Representative dose response curves of FLY-1B TCR T cells following exposure to non-ROPN1B peptides from J with FC > 0.1. These peptides included GMFLYISLA (GMF) and NLYGIVLA (NLY; depicted in orange); the cognate FLY-1B epitope was included as a comparator (purple; n = 3). Mean EC50 values (in mol/L, n = 3) and source antigens of peptides are shown on the right side of the plot. The EC50 value could not be calculated for the NLY peptide. Data were analyzed using the Wilcoxon signed-rank test: FLY-1B vs. GMF: P = 0.08086.
Figure 4.
Figure 4.
FLY-1A TCR T cells recognize 3D breast tumoroids and outperform standard-of-care in vitro. A, Cartoon depicting the assay setup to test TCR T cells or standard-of-care therapies for their reactivity to three-dimensional (3D) extracellular matrix (ECM)-embedded organoids (left). Representative confocal fluorescence microscopy images of organoids derived from ROPN1/B-overexpressing MM231 cells at t = 0 hour, t = 24 hours, and t = 48 hours after coculture with TCR T cells (n = 3 experiments; n = 4 replicates per experiment; right). FLY-1A and FLY-1B TCR T cells were tested against MM231 cells expressing ROPN1 or ROPN1/B, and mock T cells were included as a negative control. The green color indicates GFP-expressing organoid, the blue color represents TCR T cells, and the red color represents binding by PI. B, Bar graphs display differences in GFP signal from the MM231 ROPN1/B-derived organoids at 48 hours after addition of T cells relative to 0 hour. Cisplatin (20 μmol/L) or medium (negative control) was used as comparators. Individual points, mean, and SD are shown. C, Dot plot represents gene expression of ROPN1 (green), ROPN1B (purple), and TACSTD2 (TROP2, orange) in TNBC PDX-derived organoid. Gene expression of these targets is depicted as FC relative to GAPDH (2−∆Ct) according to RT-qPCR (n = 1). D, Representative images of TNBC PDX-derived organoids at 48 and 96 hours after the addition of T cells. Cisplatin (Dose 1: 0.1 μmol/L; Dose 2: 1.0 μmol/L; Dose 3: 10 μmol/L) or sacituzumab govitecan (Dose 1: 0.1 μmol/L; Dose 2: 1.0 μmol/L; Dose 3: 10 nmol/L) was used as a comparator. Left, actin shown in pink and nuclei visualized in blue represent living organoids, whereas immune cells are visualized in green. Right, segmented images show the viable organoids (white) from the images of the left at 48 and 96 hours. E, Bar plots represent total cell count of TNBC PDX-derived organoids at 48 hours (left) and 96 hours (right) after the addition of three different doses of T cells or drug compounds (n = 2 donors, 4 replicates per donor). Individual points, mean, and SD are shown. The Kruskal–Wallis rank test was performed followed by Dunnett’s multiple comparisons test. Sacituz., sacituzumab govitecan.
Figure 5.
Figure 5.
FLY-1A TCR T cells lead to dose-dependent regression of large TNBC tumors and significantly outperform standard-of-care treatment in vivo. A, Scheme depicting the in vivo study design (see “Methods” for details). NSG mice bearing palpable subcutaneous tumors derived from MM231 ROPN1 cells were treated with either 1 transfer of FLY-1A TCR T cells (0.6, 3, or 15 × 106 TCR+ CD3+ T cells), mock T cells (equal to the no. of cells given for highest TCR T-cell dose), or sacituzumab govitecan (0.4 mg/kg) 2 times per week. Blood (n = 9 per group) and tumors (n = 4 per group) were collected at day 8/9. B, Line graph shows tumor size over time in mice treated with FLY-1A TCR T cells (dose 1: pink; dose 2: purple; dose 3: green), mock T cells (gray), or sacituzumab govitecan (orange; n = 5 per group). C, Waterfall plot represents tumor size at day 11 relative to day −1 per mouse per group (the same colors as in B). ANOVA test was performed followed by Tukey’s post hoc test. Only significant differences are shown. D, Flow cytometric determination of TROP2 protein expression in parental MM231 cells stained with antibody (depicted in orange) or not (negative control, depicted in gray). E, Presence of TCR T cells in tumor (left) and blood (right). T cells binding pMHC that were either present in single tumor cell suspensions or peripheral blood samples were detected by flow cytometry (see “Methods” for details). Individual points, mean, and SD are shown. The Kruskal–Wallis rank test was performed followed by Dunn’s multiple comparisons test. Significant differences between different treatments vs. mock T cells were not calculated because of low numbers. Bu/Cy, busulfan and cyclophosphamide; Sacituz., sacituzumab govitecan.
Figure 6.
Figure 6.
FLY-1A TCR is not prone to mispair, and small-scale clinical product of non-modified FLY-1A TCR T cells passes safety and potency assays. A, Schematic principle of mispairing between transgenic and endogenous TCRα and TCRβ chains following TCR engineering of T cells. B, Representative flow cytometry plot shows wild-type (wt) FLY-1A TCR expression following staining with pMHC (left) or anti-TCRVβ13.1 (middle) of CD3+ T cells. The percentages of pMHC (green) and TCR-Vβ (purple) binding T cells are not statistically different (right, n = 5 donors, individual data points are shown). Data were analyzed using the Wilcoxon signed-rank test: P = 1. C, Representative histogram shows MFI of pMHC+ CD3+ T cells transduced with wt FLY-1A TCR (green) compared with modified FLY-1A TCR that incorporates an extra cysteine bridge (Cys, purple) or the LRY motif (pink; right, n = 2 donors). D, Bar graph shows wt FLY-1A TCR expression according to % binding of pMHC within CD3+ (green), CD4+ (purple), and CD8+ (pink) T cells following an established GMP process performed at two different sites (Erasmus MC and NecstGen, n = 5 donors). Individual data points, mean, and SD are shown. E, Cell numbers of wt FLY-1A TCR T cells at manufacturing days 2, 4, 7, 9, and 11 of T-cell products from D. F, Wild-type FLY-1A TCR T-cell products do not recognize healthy tissue-derived primary cells. IFN-γ production by FLY-1A TCR was measured upon stimulation with cell cultures derived from 11 different HLA-A2+ healthy tissues without (green) or with (purple) preloading with FLY-1A peptide at 10 mmol/L (n = 3 donors). Individual data points and the mean of three biologic replicates are shown. Note that all healthy cell types tested were able to elicit a response by FLY-1A TCR T cells when preloaded with cognate epitope. Mock T cells (in gray) served as a negative control. The Wilcoxon signed-rank test was performed to test healthy tissue-derived cell cultures in the no peptide conditions: FLY-1A TCR vs. mock T cells for all cultures, P > 0.05. G, Wild-type FLY-1A TCR T-cell products recognize TNBC PDX. IFN-γ production by FLY-1A TCR was measured upon coculture with single-cell suspensions derived from TNBC PDX samples (n = 26 of 8 different ROPN1+ HLA-A2+ PDXs). Samples that were ROPN1+ HLA-A2 (n = 6 of 3 different PDX’s) or ROPN1 HLA-A2 (n = 4 of 2 different PDXs) served as additional specificity controls. Mock T cells (in gray) served as a negative control. Individual data points, mean, and SD are shown. The Wilcoxon signed-rank test was performed to test significance between FLY-1A TCR vs. mock T cells, and only significant differences are shown: ROPN1+ HLA-A2+, P = 8.58E05; ROPN1+ HLA-A2, P = 0.589; ROPN1 HLA-A2, P = 0.886. H, CD4+ FLY-1A TCR T cells recognize ROPN1 TNBC. IFN-γ and IL-2 productions by FLY-1A TCR T cells were measured following T-cell sorting into CD4+ and CD8+ T cells using magnetic beads and coculturing with ROPN1-expressing MM231 cells (n = 2 donors, 2 replicates per donor). Mock T cells served as negative controls. Individual data points and mean values are shown. I, Representative dose response curves of FLY-1A (green) and NY-ESO1 (pink) TCR T cells following exposure to titrated amounts of their cognate epitope. Mean EC50 values (in μmol/L, FLY-1A TCR: n = 6, NY-ESO1 TCR: n = 4) are shown above the plot. Data were analyzed using the Wilcoxon signed-rank test: FLY-1A vs. NY-ESO1 TCR T cells: P = 0.26. CD3, CD3+ T cells, CD14, CD14+ monocytes; CD19, CD19+ B cells; HBEPCs, human bronchial epithelial cells; HCAECs, human coronary artery endothelial cells; HCFs, human cardiac fibroblasts; HOBs, human osteoblasts; HPFs, human pulmonary fibroblasts; HWPs, human white preadipocytes (subcutaneous); MFI, median fluorescent intensity; NHDF, normal human dermal fibroblasts; NHEK, normal human epidermal keratinocytes.

References

    1. Yao H, He G, Yan S, Chen C, Song L, Rosol TJ, et al. . Triple-negative breast cancer: is there a treatment on the horizon? Oncotarget 2017;8:1913–24. - PMC - PubMed
    1. Robson M, Im S-A, Senkus E, Xu B, Domchek SM, Masuda N, et al. . Olaparib for metastatic breast cancer in patients with a germline BRCA mutation. N Engl J Med 2017;377:523–33. - PubMed
    1. Litton JK, Rugo HS, Ettl J, Hurvitz SA, Gonçalves A, Lee K-H, et al. . Talazoparib in patients with advanced breast cancer and a germline BRCA mutation. N Engl J Med 2018;379:753–63. - PMC - PubMed
    1. Kuchenbaecker KB, Hopper JL, Barnes DR, Phillips K-A, Mooij TM, Roos-Blom M-J, et al. . Risks of breast, ovarian, and contralateral breast cancer for BRCA1 and BRCA2 mutation carriers. JAMA 2017;317:2402–16. - PubMed
    1. Tung N, Lin NU, Kidd J, Allen BA, Singh N, Wenstrup RJ, et al. . Frequency of germline mutations in 25 cancer susceptibility genes in a sequential series of patients with breast cancer. J Clin Oncol 2016;34:1460–8. - PMC - PubMed

Substances

LinkOut - more resources