

Health Disparities among Patients with Cancer Who Received Molecular Testing for Biomarker-Directed Therapy
- PMID: 39172022
- PMCID: PMC11450693
- DOI: 10.1158/2767-9764.CRC-24-0321
Health Disparities among Patients with Cancer Who Received Molecular Testing for Biomarker-Directed Therapy
Abstract
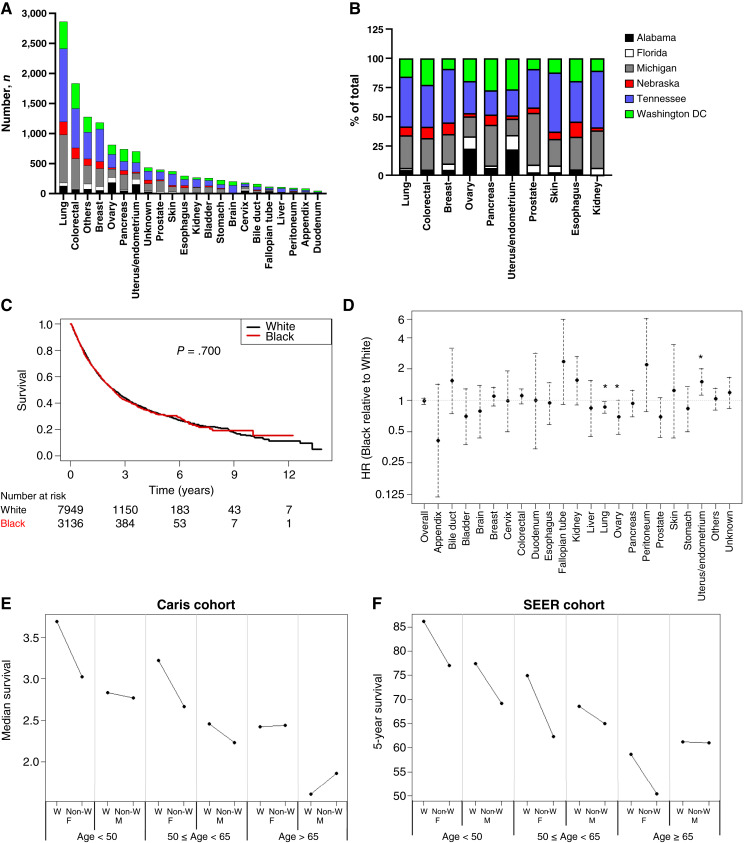
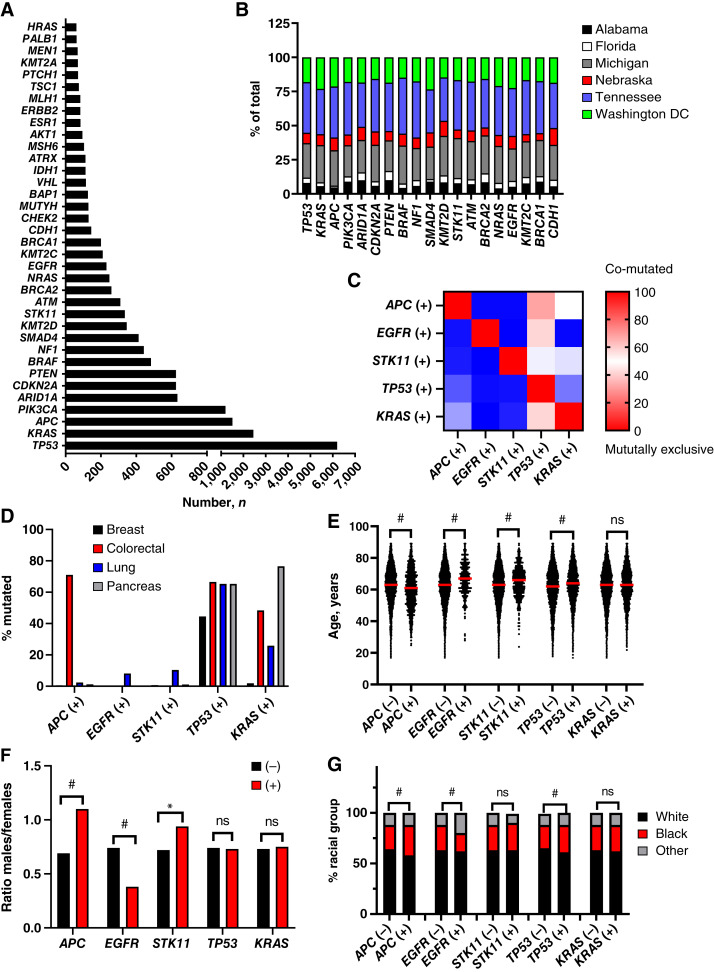
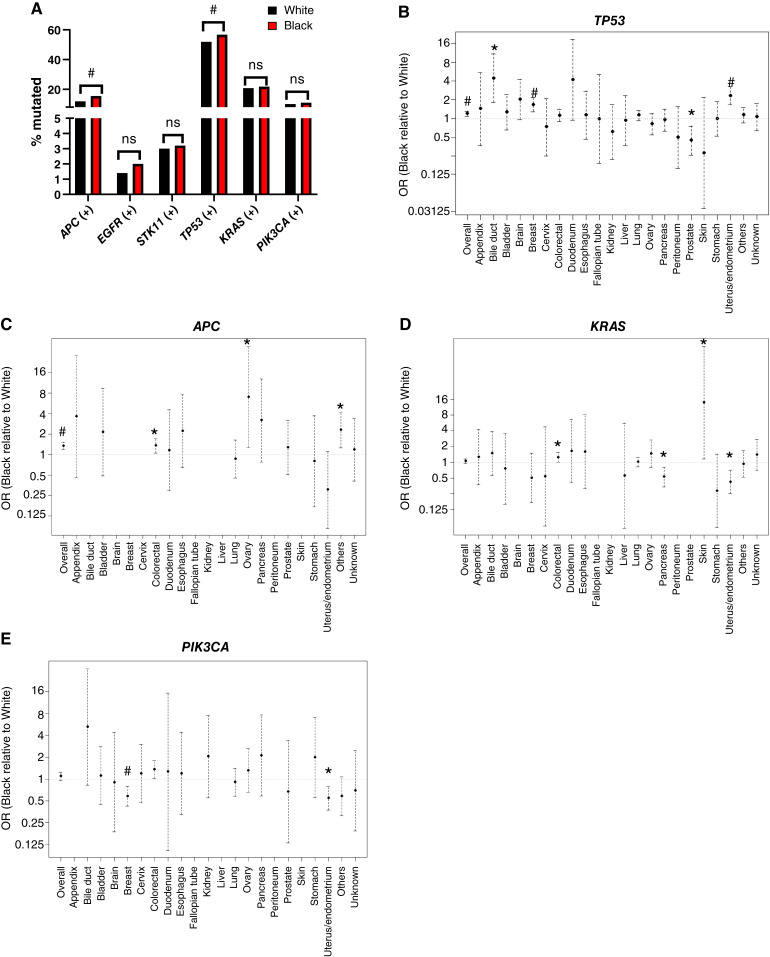
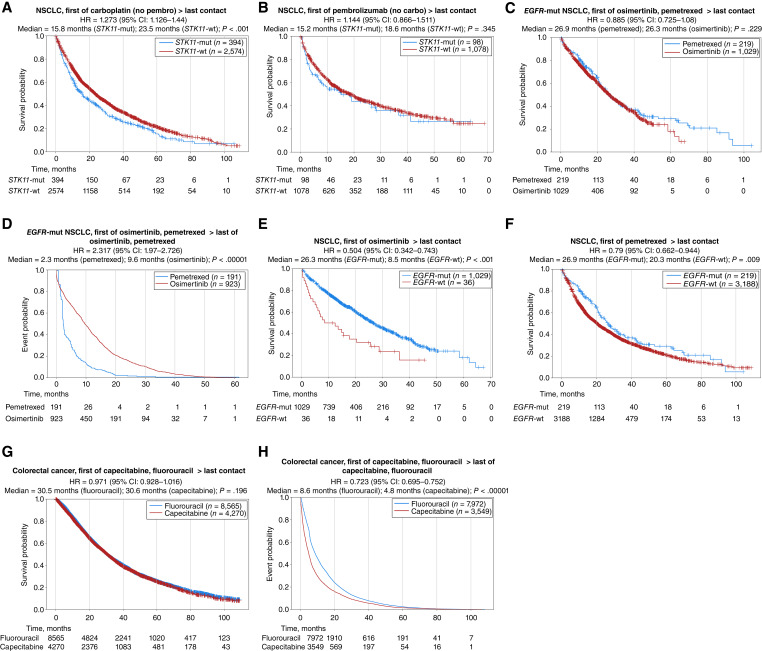
Health disparities present a barrier to successful oncology treatment. The potential for precision oncology to reduce health disparities has not previously been analyzed. We performed a retrospective analysis of 12,627 patients from six major cancer centers whose tumors underwent molecular testing at Caris Life Sciences between 2010 and 2020. Kaplan-Meier and Cox regression were used to describe and analyze overall survival. The molecular and demographic features of the cohort were analyzed by χ2 and ANOVA tests. Black patients composed 25% of the cohort and White patients 63%. Among this molecularly-tested cohort, there were minimal outcome differences based on race, geographic location, or poverty level. When analyzing the interaction of age, race, and sex, racial-based disparities were noted primarily for young non-White women in the study cohort but were more pronounced for men and women of all ages in the broader patient population within the Surveillance, Epidemiology, and End Results database. Mutations in five genes-APC, EGFR, STK11, TP53, and KRAS-were found to affect overall survival among our cohort, and their prevalence varied by race in specific tumor types. Real-world outcomes data in mutation-defined cohorts also provided additional context to previously reported therapeutic response trends. Our study shows that patients who undergo molecular testing display reduced racial health disparities compared with the general population, whereas persistent racial disparities are influenced by age and sex. Genomic-driven racial disparities should be examined at a tumor lineage-specific level. Increased access to molecular testing for all eligible patients may play a role in improving health equity. Significance: This study is the largest of its kind to analyze health disparities and genomic features among a diverse multiinstitutional cohort of patients who underwent molecular testing. Continuing to increase awareness of and access to molecular testing approaches may help to reduce cancer health disparities and improve outcomes for all patients.
©2024 The Authors; Published by the American Association for Cancer Research.
Conflict of interest statement
E. Heath reports advisory/consulting: Astellas, AstraZeneca, Bayer, EMD Serono, Gilead, Novartis, and Sanofi; steering committee: Janssen; honararia/paid travel: Astellas, Bayer, Caris, Sanofi, and Seattle Genetics; speaker’s bureau: Sanofi; and research support: Astellas, Arvinas, AstraZeneca, Bayer, BioXcel, Bristol Myers Squibb, Calibr, Calithera, Caris, Corcept, Corvis, Daiichi Sankyo, Eisai, Exelixis, Five Prime, Fortis, GlaxoSmithKline, Gilead Sciences, Harpoon, Hoffmann-La Roche, Infinity, iTeos, Janssen, Merck Sharp & Dohme, Merck, Mirati, Modra, Novartis, Oncolys, Peloton, Pfizer, Pharmacyclics, POINT Biopharma, and Seattle Genetics. J.R. Ribeiro reports personal fees from Caris Life Sciences during the conduct of the study, as well as personal fees from Caris Life Sciences outside the submitted work. J. Xiu reports other support from Caris Life Sciences during the conduct of the study. K. Poorman reports personal fees from Caris Life Sciences during the conduct of the study, as well as personal fees from Caris Life Sciences outside the submitted work. H. Mamdani reports other support from Daiichi Sankyo, AstraZeneca, and Genentech and grants from AstraZeneca outside the submitted work. A.F. Shields reports personal fees from Caris Life Sciences outside the submitted work. G.L. Lopes reports stock and other ownership interests with Lucence Diagnostics, Xilis, Biomab, Morphometrix, and CDR-Life; honoraria from Boehringer Ingelheim, Blueprint Medicines, AstraZeneca, Merck, and Janssen; consulting or advisory role with Pfizer and AstraZeneca; research funding (to G.L. Lopes) from AstraZeneca, Lucence, Xilis, and E.R. Squibb & Sons LLC; research funding (to institution) from Merck Sharp & Dohme, EMD Serono, AstraZeneca, Blueprint Medicines, Tesaro, Bavarian Nordic, Novartis, G1 Therapeutics, Adaptimmune, Bristol Myers Squibb, GSK, AbbVie, Rgenix, Pfizer, Roche, Genentech, Eli Lilly and Company, and Janssen; travel and accommodations from Boehringer Ingelheim, Pfizer, E.R. Squibb & Sons LLC, Janssen, Seattle Genetics, Celgene, Ipsen, Pharmacyclics, Merck, AstraZeneca, and Seagen; and other relationship with Mirati Therapeutics. S.A. Kareff reports personal fees from Ipsen, i3 Health, Sermo, M3, All Global Circle, Pathway MD, HealthCourse Inc., PrecisCa, Academy for Continued Healthcare Education, and Research To Practice outside the submitted work, as well as travel grants from FLASCO and IASLC. M. Radovich reports other support from Caris Life Sciences during the conduct of the study, as well as other support from Caris Life Sciences outside the submitted work. G.W. Sledge reports other from Caris Life Sciences outside the submitted work. G.A. Vidal reports other from Guardant360, grants and other from Gilead, other from BillionToOne, Genentech/Roche, and GSK, and personal fees and other from AstraZeneca during the conduct of the study. J.L. Marshall reports personal fees from Caris outside the submitted work. No other disclosures were reported by the other authors.
Figures
References
-
- Chakravarty D, Johnson A, Sklar J, Lindeman NI, Moore K, Ganesan S, et al. . Somatic genomic testing in patients with metastatic or advanced cancer: ASCO provisional clinical opinion. J Clin Oncol 2022;40:1231–58. - PubMed
-
- DeSantis CE, Siegel RL, Sauer AG, Miller KD, Fedewa SA, Alcaraz KI, et al. . Cancer statistics for African Americans, 2016: progress and opportunities in reducing racial disparities. CA Cancer J Clin 2016;66:290–308. - PubMed
-
- Siegel RL, Miller KD, Fuchs HE, Jemal A. Cancer statistics, 2022. CA Cancer J Clin 2022;72:7–33. - PubMed
Publication types
MeSH terms
Substances
Grants and funding
LinkOut - more resources
Full Text Sources
Medical
Research Materials
Miscellaneous
