. 2024 Aug 22;9(19):e179854.
doi: 10.1172/jci.insight.179854.

Hypoxia-induced complement component 3 promotes aggressive tumor growth in the glioblastoma microenvironment

Affiliations

Hypoxia-induced complement component 3 promotes aggressive tumor growth in the glioblastoma microenvironment

Rebecca Rosberg et al. JCI Insight. .

Abstract

Glioblastoma (GBM) is the most aggressive form of glioma with a high rate of relapse despite intensive treatment. Tumor recurrence is tightly linked to radio-resistance, which in turn is associated with hypoxia. Here, we discovered a strong link between hypoxia and local complement signaling using publicly available bulk, single-cell, and spatially resolved transcriptomic data from patients with GBM. Complement component 3 (C3) and the receptor C3AR1 were both associated with aggressive disease and shorter survival in human glioma. In a genetically engineered mouse model of GBM, we found C3 specifically in hypoxic tumor areas. In vitro, we found an oxygen level-dependent increase in C3 and C3AR1 expression in response to hypoxia in several GBM and stromal cell types. C3a induced M2 polarization of cultured microglia and macrophages in a C3aR-dependent fashion. Targeting C3aR using the antagonist SB290157 prolonged survival of glioma-bearing mice both alone and in combination with radiotherapy while reducing the number of M2-polarized macrophages. Our findings establish a strong link between hypoxia and complement pathways in GBM and support a role of hypoxia-induced C3a/C3aR signaling as a contributor to glioma aggressiveness by regulating macrophage polarization.

Keywords: Cancer; Complement; Hypoxia; Oncology.


Conflict of interest statement

Conflict of interest: The authors have declared that no conflict of interest exists.

Figures

Figure 1
Figure 1. C3 is associated with aggressive GBM.
(A) TCGA data analyzed for C3 expression in glioma grades II, III, and IV. (B) TCGA data analyzed for C3 expression in IDH-WT (IDHwt) glioma compared with IDH mutant (IDHmut) with or without 1p/19q codeletion. (C) TCGA data analyzed for C3 expression in GBM compared with nontumor. (D) Kaplan-Meier curve showing survival of glioma patients with either high (red) or low (blue) C3 expression based on TCGA data. (E) Kaplan-Meier curve showing survival of IDHwt GBM with high (red) or low (blue) C3 expression based on TCGA data. (F) Murine GBM stained for C3, Olig2, GFAP, and DAPI as indicated. T indicates tumor, and H indicates healthy brain tissue. (G) UMAP displaying C3 expression in single-cell sequencing data from 16 independent data sets compiled in GBmap (25). (H) Malignant cell population divided into C3 (86.4%) or C3+ (13.6%) cells. (I) Gene set enrichment signature pathways associated with C3 expression in malignant cells. Red bars indicate significant Benjamini-Hochberg adjusted P values (Padj < 0.05). *P < 0.05, **P < 0.01, or ***P< 0,001. Statistical tests were 1-way ANOVA, or unpaired t test (in case of comparison between 2 groups) with Tukey post hoc test.
Figure 2
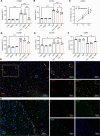
Figure 2. Hypoxia is associated with local complement signaling in GBM tumors.
(A and B) Immunofluorescence detection of C3 (red), Nestin (yellow), Nuclei (DAPI, blue), GFAP (green), or Olig2 (cyan) in the perivascular (A) or hypoxic (B) niches of murine RCAS-PDGFB– and RCAS-shp53–induced gliomas. (C and D) HALLMARK_HYPOXIA (C) and HALLMARK_COMPLEMENT (D) signatures mapped on spatially resolved transcriptomics from human GBM samples, displayed with Z score. (E) Spatial correlation between HALLMARK_HYPOXIA and HALLMARK_COMPLEMENT in 1 representative tumor (UKF242). P values were corrected for multiple hypothesis testing using the Holm method. (F) Distribution of R values for the correlation between HALLMARK_HYPOXIA and HALLMARK_COMPLEMENT in a total of 19 human GBM tissue samples with an average correlation score of R = 0.54 (26). (G and H) Pearson correlation coefficient between HALLMARK_COMPLEMENT and HALLMARK_HYPOXIA signatures in the TCGA GBMLGG (G) or TCGA GBM (H) data set. (IK) Expression of CA9, C3, and C3AR1 mRNA in human primary astrocytes (n = 3), HMC3 microglia (n = 4), or primary human glioma cells U3082MG (n = 3), U3065MG (n = 3), or U3084MG (n = 3) in response to normoxia (21% O2), hypoxia (1% O2), or severe hypoxia (0.1% O2). Data are shown as mean ± SEM. *P < 0.05, **P < 0.01, or ***P< 0,001. Statistical tests were 1-way ANOVA, with Tukey post hoc test, or unpaired t test in case of 2 sample comparisons. Statistical tests were 1-way ANOVA (I and K), with Tukey post hoc test, or unpaired t test in case of 2-sample comparisons (J).
Figure 3
Figure 3. Limited effects of C3 on glioma cell growth under stressful conditions.
(AD) U3082MG (n = 5), U3065MG (n = 3), U30884MG (n = 3), and U3020MG (n = 3) glioma cell proliferation under normoxic (21% O2) and severe hypoxic (0.1% O2) conditions with or without the presence of human serum-purified C3 as measured by the WST-1 assay. (E) Representative images of immunofluorescence detection of Ki67+ cells in U3082MG glioma cells grown under severe hypoxia (0.1% O2) with or without the presence of C3 (180 ng/mL). Scale bars: 50 µm. (FI) Quantification of Ki67+ cells (n = 3). (J) Representative image of clonal survival of U251MG glioma cells after 4 Gy irradiation with or without presence of human C3 (180 ng/mL) in the medium in triplicate wells. (KM) Quantification of number of colonies in U251MG (n = 7), U3020MG (n = 3), and U3082MG (n = 3) cells. Data are shown as mean ± SEM. *P < 0.05, **P < 0.01 from unpaired t tests.
Figure 4
Figure 4. C3AR1 is associated with aggressive GBM.
(A) C3AR1 expression of Pan-Cancer TCGA data of common cancer types (n = 33). (B) C3AR1 expression in relation to glioma grade as analyzed in TCGA data. (C) C3AR1 expression in IDHwt glioma compared with IDHmut with or without 1p/19q codeletion (Tukey post hoc test) as analyzed in TCGA data. (D) C3AR1 expression in GBM compared with nontumor as analyzed in TCGA data. (E) Kaplan-Meier curve showing survival of patients with glioma with either high (red) or low (blue) C3AR1 expression based on TCGA data. (F) Kaplan-Meier curve showing survival of IDHwt GBM with high (red) or low (blue) C3AR1 expression based on TCGA data. (G) UMAP displaying C3AR1 expression in single-cell RNA-Seq data from 26 independent data sets compiled in GBmap (25). (H) C3AR1 expression of malignant cells divided into C3AR1+ (3.1%) or C3AR1 (96.9%) cells. (I) GSEA of the C3AR1-expressing malignant cells. Red bars indicate significant Benjamini-Hochberg adjusted P values (Padj < 0.05). (J) Log-fraction plot of a combination of independent extreme limiting dilution sphere formation assays (n = 4) of U3082MG glioma cells treated with SB290157. *P < 0.05, **P < 0.01, or ***P< 0,001. One-way ANOVA (B and C), or unpaired t test (D) (in case of comparison between 2 groups) with Tukey post hoc test.
Figure 5
Figure 5. C3a promotes M2 polarization of microglia and macrophages.
(A and B) Flow cytometry for indicated markers of M2 polarization in HMC3 microglia cells treated as indicated with SB290157 (SB), DMSO, and C3a (n = 4). (C) Proliferation of HMC3 cells treated or not with SB290157 as measured by the WST-1 assay (n = 3). (DF) Flow cytometry for indicated markers of M2 (CD206, CD163) and M1 (CD86) polarization in primary murine macrophages treated as indicated with SB290157 (SB), DMSO, and C3a (n = 3). (G) Representative image of immunofluorescence staining of CD31 and CD206 in murine gliomas induced through RCAS-PDGFB and RCAS-shp53 in Nestin/tv-a mice. Scale bars: 100 μm, 50 μm (insets). (H) Representative image of immunofluorescence staining of C3 and F4/80 in murine gliomas induced through RCAS-PDGFB and RCAS-shp53 in Nestin/tv-a mice. Scale bars: 50 μm.
Figure 6
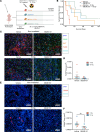
Figure 6. C3AR1 is a possible therapeutic target in GBM.
(A) Illustration (created with BioRender.com) of study design for treatment with SB290157 (1 mg/kg) with or without combination with 10 Gy radiotherapy of murine gliomas induced through RCAS-PDGFB and RCAS-shp53 in Nestin/tv-a mice. (B) Kaplan-Meier curve showing the survival of mice treated with vehicle (red, n = 5), SB290157 (blue, n = 4), vehicle + 10 Gy (orange, n = 6), or SB290157 + 10 Gy (green, n = 8) as indicated. (C) Representative image of immunofluorescence staining of macrophages/microglia (F4/80), tumor cells (Olig2), and astrocytes (GFAP) in mice treated as indicated. (D) Quantitative analysis of F4/80+ cells/area (μm2) as indicated (n = 11 for untreated and n = 9 for SB290157 treated). (E) Representative images of immunofluorescence staining of tumor cells (Olig2) and CD206+ macrophages/microglia in mice treated as indicated. (F) Quantitative analysis of CD206+ cells/Area (μm2) as indicated (n = 11 for untreated and n = 9 for SB290157 treated). *P < 0.05, **P < 0.01, or ***P < 0.001. Statistical analysis was performed using the Mann-Whitney U test. Scale bars: 100 μm.

References

    1. Ostrom QT, et al. CBTRUS statistical report: primary brain and other central nervous system tumors diagnosed in the United States in 2016-2020. Neuro Oncol. 2023;25(12 suppl 2):iv1–iv99. doi: 10.1093/neuonc/noad149. - DOI - PMC - PubMed
    1. De Silva MI, et al. Neuronal and tumourigenic boundaries of glioblastoma plasticity. Trends Cancer. 2023;9(3):223–236. doi: 10.1016/j.trecan.2022.10.010. - DOI - PubMed
    1. Yabo YA, et al. Cancer cell heterogeneity and plasticity: a paradigm shift in glioblastoma. Neuro Oncol. 2022;24(5):669–682. doi: 10.1093/neuonc/noab269. - DOI - PMC - PubMed
    1. Tan AC, et al. Management of glioblastoma: state of the art and future directions. CA Cancer J Clin. 2020;70(4):299–312. doi: 10.3322/caac.21613. - DOI - PubMed
    1. Wolf KJ, et al. Dissecting and rebuilding the glioblastoma microenvironment with engineered materials. Nat Rev Mater. 2019;4(10):651–668. doi: 10.1038/s41578-019-0135-y. - DOI - PMC - PubMed

MeSH terms