. 2024 Sep 20;5(3):103274.
doi: 10.1016/j.xpro.2024.103274. Epub 2024 Aug 21.

Protocol for quantifying drug sensitivity in 3D patient-derived ovarian cancer models

Affiliations

Protocol for quantifying drug sensitivity in 3D patient-derived ovarian cancer models

Kathrin B Labrosse et al. STAR Protoc. .

Abstract

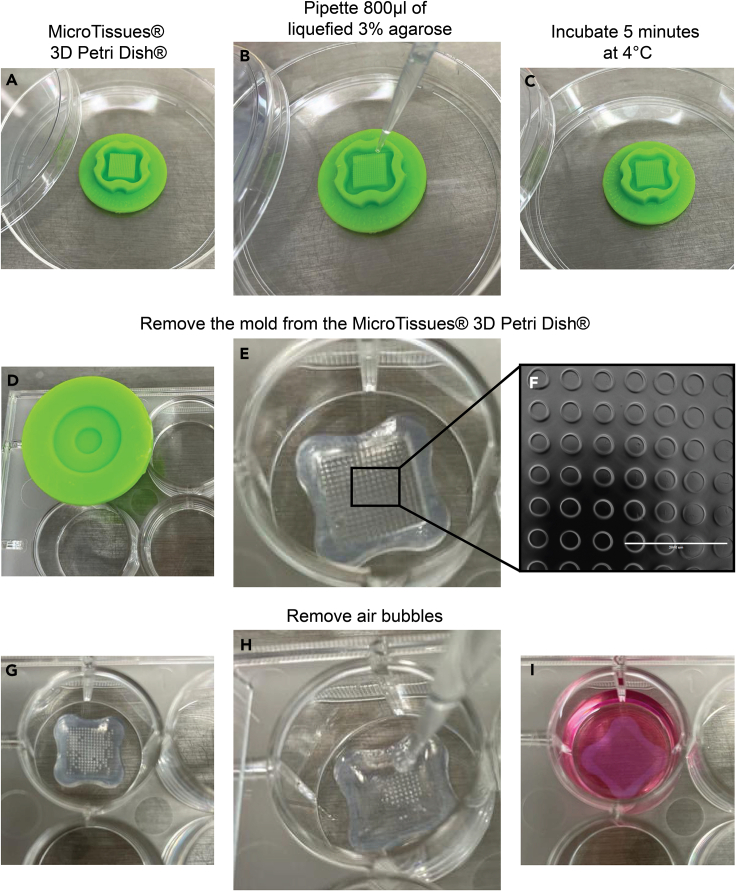
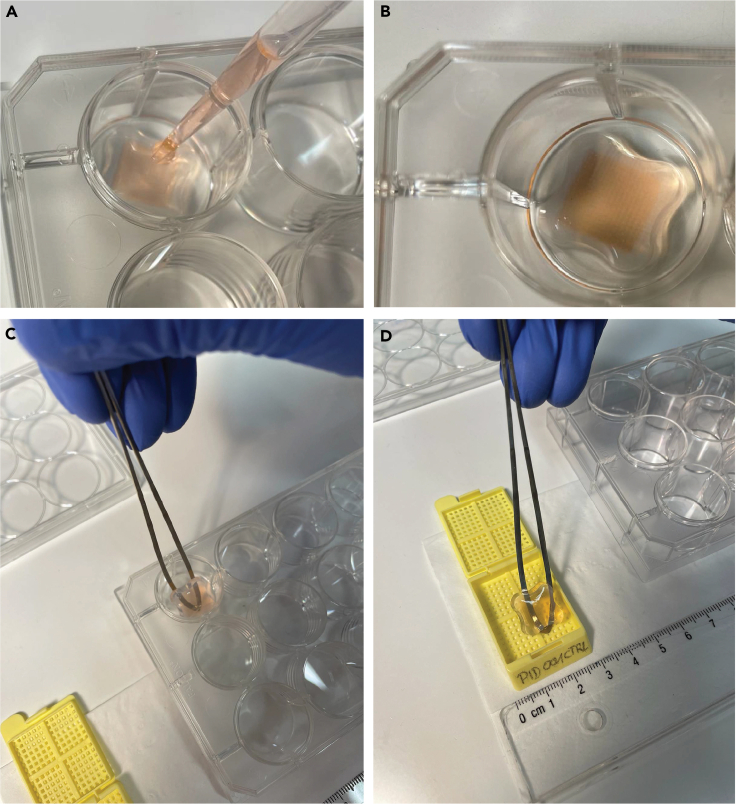
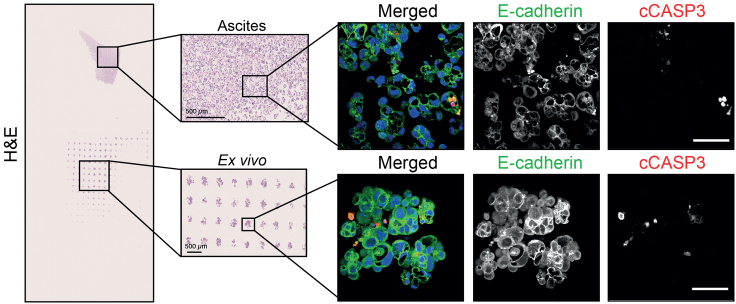
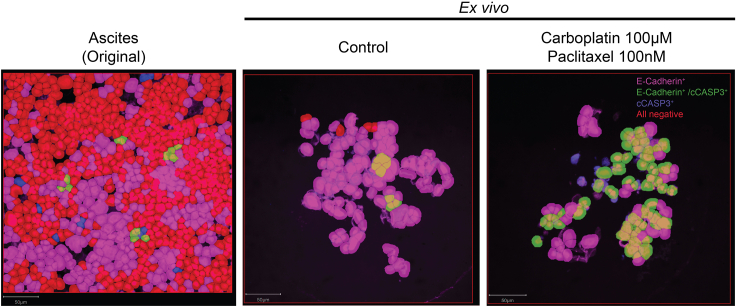
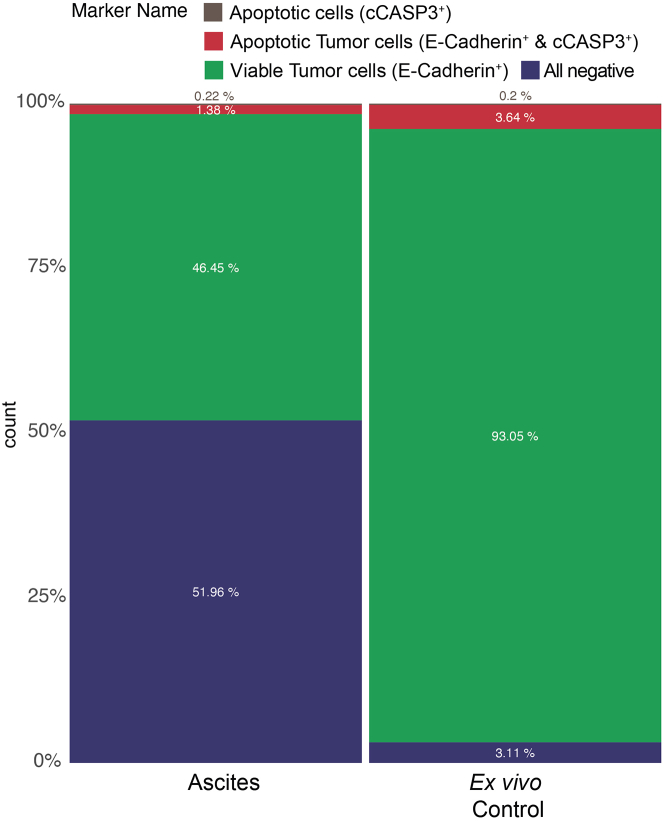
Three-dimensional (3D) ex vivo cultures allow the study of cancer progression and drug resistance mechanisms. Here, we present a protocol for measuring on-target drug sensitivity in a scaffold-free 3D culture system through quantification of apoptotic tumor cells. We provide detailed steps for sample processing, immunofluorescence staining, semi-high-throughput confocal imaging, and imaged-based quantification of 3D cultures. This protocol is versatile and can be applied in principle to any patient-derived material.

Keywords: Cancer; Cell culture; Single Cell.


Conflict of interest statement

Declaration of interests The authors declare no competing interests.

Figures

None
Graphical abstract
Figure 1
Figure 1
Agarose 3D Petri Dish micro-chip preparation Autoclaved MicroTissues 3D Petri Dish (A). Pipette 800 μL of the liquefied agarose onto MicroTissues 3D Petri Dish (B). Allow the agarose 3D Petri Dish chip to solidify for 5–10 min at 4°C (C). Remove the agarose chip gently from the MicroTissues 3D Petri Dish (D) and place it into one of the wells of a 12-well plate (E). Check under the microscope if all micro-wells are intact (F), add 200 μL of PBS, and check for air bubbles (G). Remove air bubbles by carefully pipetting the PBS up and down (H). Add 2000 μL of Ovarian TumorMACS medium to each well of the 12-well plate (I).
Figure 2
Figure 2
Sample handling for enzymatic tissue digestion Fresh tissue obtained from the surgery room is initially placed in a Petri dish (A). Subsequently, the tissue is cut into a 1 cm³ piece using a scalpel (B) and further fragmented into smaller portions using surgical scissors (C).
Figure 3
Figure 3
Flow cytometry evaluation of immune cell and tumor cell content and cell viability Flow cytometry plot showing the initial gating strategy based on forward scatter height (FSC_H) and side scatter area (SSC_A) to exclude debris and ensure single-cell events. The gated population is subsequently analyzed for immune and tumor cell content.
Figure 4
Figure 4
3D Petri Dish micro-chips containing patient-derived cells The cells are adequately distributed at the bottom of the micro-chip wells (A and B). An image of a damaged micro-chip with a leak, depicting cells that are outside of the micro-chip wells, which needs to be discarded (C–E).
Figure 5
Figure 5
3D Petri Dish micro-chips handling for paraffin embedding Application of Histogel (A and B). Transfer of the 3D Petri Dish micro-chip to a pre-labeled histological cassette (C and D).
Figure 6
Figure 6
Deparaffinization and rehydration process for FFPE sections with embedded samples Place the slides containing cells into a slide holder. Transfer the slide holder to a container filled with xylene (A) for 5 min, followed by another container with xylene (B) for an additional 5 min. Subsequently, move the slide holder to a container containing 100% ethanol (C) for 10 min, then to 95% ethanol (D) for another 10 min, followed by 70% ethanol (E) for 10 min, and finally to a container with 50% ethanol (F) for 10 min. Transfer the slide holder to a container with Millipore water (G). This procedure should be conducted under a fume hood.
Figure 7
Figure 7
Representative hematoxylin and eosin (H&E) staining and immunofluorescence staining for tumor (E-Cadherin) and apoptotic (cleaved caspase-3 = cCASP3) cells from ascites (original) and ex vivo cultures Scale bars: 500 μm (H&E) and 50 μm (immunofluorescence).
Figure 8
Figure 8
QuPath classification of different cell types DAPI only positive cells are displayed in red, E-Cadherin only positive cells are displayed in magenta and double-positive cells (E-Cadherin+ and cCASP3+) are displayed in green. Scale bar: 50 μm.
Figure 9
Figure 9
Quality control plots Different QuPath classifiers analyzing the intensity of the nucleus area (A), the nucleus cell area ratio (B), E-Cadherin (C), and cCASP3 (D).
Figure 10
Figure 10
Cell composition of the original sample (ascites) and ex vivo (control) in percentage On the left is the cell composition of the original sample (ascites) depicted with a balanced distribution of other cells, all negative (blue) and tumor cells E-Cadherin positive (green) and only very few double-positive cells (red) and apoptotic cells (brown). Due to the tumor cell enhancing media the ratio between all negative and E-Cadherin positive cells shifts in the ex vivo model.
Figure 11
Figure 11
Drug efficacy normalized to control in an ex vivo model Example for drug efficacy of two different concentrations of carboplatin (CP), olaparib, paclitaxel (PTX), and the combination of carboplatin and paclitaxel (CP PTX) in an ex vivo sample normalized to control. ∗∗p < 0.01, ∗∗∗p < 0.001, ∗∗∗∗p < 0.00001.

References

    1. Lheureux S., Gourley C., Vergote I., Oza A.M. Epithelial ovarian cancer. Lancet. 2019;393:1240–1253. doi: 10.1016/S0140-6736(18)32552-2. - DOI - PubMed
    1. Song H., Cai G.-H., Liang J., Ao D.-S., Wang H., Yang Z.-H. Three-dimensional culture and clinical drug responses of a highly metastatic human ovarian cancer HO-8910PM cells in nanofibrous microenvironments of three hydrogel biomaterials. J. Nanobiotechnology. 2020;18:90. doi: 10.1186/s12951-020-00646-x. - DOI - PMC - PubMed
    1. Clark J., Fotopoulou C., Cunnea P., Krell J. Novel ex vivo models of epithelial ovarian cancer: the future of biomarker and therapeutic research. Front. Oncol. 2022;12 doi: 10.3389/fonc.2022.837233. - DOI - PMC - PubMed
    1. El Harane S., Zidi B., El Harane N., Krause K.-H., Matthes T., Preynat-Seauve O. Cancer spheroids and organoids as novel tools for research and therapy: state of the art and challenges to guide precision medicine. Cells. 2023;12 doi: 10.3390/cells12071001. - DOI - PMC - PubMed
    1. Golan S., Bar V., Salpeter S.J., Neev G., Creiderman G., Kedar D., Aharon S., Turovsky L., Zundelevich A., Shahar H., et al. A clinical evaluation of an ex vivo organ culture system to predict patient response to cancer therapy. Front. Med. 2023;10 doi: 10.3389/fmed.2023.1221484. - DOI - PMC - PubMed

Publication types

MeSH terms

Substances

LinkOut - more resources