. 2024 Aug 27;121(35):e2320804121.
doi: 10.1073/pnas.2320804121. Epub 2024 Aug 22.

DOT1L-mediated RAP80 methylation promotes BRCA1 recruitment to elicit DNA repair

Affiliations

DOT1L-mediated RAP80 methylation promotes BRCA1 recruitment to elicit DNA repair

Huangqi Tang et al. Proc Natl Acad Sci U S A. .

Abstract

Breast Cancer Type 1 Susceptibility Protein (BRCA1) is a tumor-suppressor protein that regulates various cellular pathways, including those that are essential for preserving genome stability. One essential mechanism involves a BRCA1-A complex that is recruited to double-strand breaks (DSBs) by RAP80 before initiating DNA damage repair (DDR). How RAP80 itself is recruited to DNA damage sites, however, is unclear. Here, we demonstrate an intrinsic correlation between a methyltransferase DOT1L-mediated RAP80 methylation and BRCA1-A complex chromatin recruitment that occurs during cancer cell radiotherapy resistance. Mechanistically, DOT1L is quickly recruited onto chromatin and methylates RAP80 at multiple lysines in response to DNA damage. Methylated RAP80 is then indispensable for binding to ubiquitinated H2A and subsequently triggering BRCA1-A complex recruitment onto DSBs. Importantly, DOT1L-catalyzed RAP80 methylation and recruitment of BRCA1 have clinical relevance, as inhibition of DOT1L or RAP80 methylation seems to enhance the radiosensitivity of cancer cells both in vivo and in vitro. These data reveal a crucial role for DOT1L in DDR through initiating recruitment of RAP80 and BRCA1 onto chromatin and underscore a therapeutic strategy based on targeting DOT1L to overcome tumor radiotherapy resistance.

Keywords: BRCA1; DNA damage repair; DOT1L; RAP80; histone modification.


Conflict of interest statement

Competing interests statement:The authors declare no competing interest.

Figures

Fig. 1.
Fig. 1.
BRCA1-A-associated DOT1L is required for DDR. (A) HeLa cells were transfected with Flag-RAP80 and then exposed to IR (10 Gy, release 2 h). The whole cell lysates were subjected to the pull-down assay. The immunoprecipitates were separated by SDS/PAGE before analysis by MS. The table details the proteins identified. (B and C) HeLa cells were exposed to IR (10 Gy, release 2 h). The whole cell lysates were extracted and subjected to immunoprecipitation using anti-DOT1L (B) or anti-RAP80 (C). IgG Rabbit or Mouse was used as a negative control. IP, immunoprecipitates. (D) In situ PLA of the interaction between DOT1L and RAP80 proteins in HeLa cells were exposed or not to IR (10 Gy, release 2 h) using anti-DOT1L (mouse) and anti-RAP80 (rabbit). The red fluorescent dots (Left) show the in situ interaction, and the quantification of the PLA dots per nucleus (Right, n = 200) is also shown. Data represent the means ± SD, unpaired t test, ****P < 0.0001. (Scale bars, 5 μm.) (E) Pull-down assay between full-length (FL) or fragments of GST-DOT1L and His-RAP80. The asterisk (*) indicates the corresponding protein bands, CBB, Coomassie Brilliant Blue staining. (F) Pull-down assay between FL or fragments of GST-RAP80 and Flag-DOT1L. (G) IF staining showing γH2AX foci formation in HeLa parental cells or DOT1L-KO HeLa cells exposed or not to IR (2 Gy) and released at the indicated time points. The number of γH2AX foci (n = 200 cells) was quantified. Data represent the means ± SD, ***P < 0.001, ****P < 0.0001, n.s., not significant. (H) Comet assay showing the DDR efficiency in HeLa parental cells and DOT1L-KO HeLa cells exposed to IR (10 Gy) and released at the indicated time points. Representative images (Left) and the quantification analyzed by ImageJ (Right, n = 100) are shown. (Scale bars, 50 μm.) Data represent the means ± SD, ****P < 0.0001. (I) Colony formation assay of HeLa parental cells and DOT1L-KO HeLa cell survival following the indicated dose of IR. The survival rate was measured. Data represent the means ± SD, ***P < 0.001.
Fig. 2.
Fig. 2.
DOT1L is recruited to DNA damage sites. (A) HeLa cells were released at 2 h after exposure to the indicated doses of IR treatment. Isolated chromatin was analyzed by western blotting. “Ctr,” untreated cells, “Chr,” chromatin fractions, and “WCL,” whole cell lysates. (B) HeLa cells were exposed to 10 Gy IR and released at the indicated time points. Isolated chromatin was analyzed by western blotting. (C) HeLa cells were transfected with GFP-DOT1L or GFP-PARP1 and irradiated with a 365-nm ultraviolet (UV) laser microirradiation. GFP-PARP1 was used as a positive control. The white dotted line indicates the irradiation path. Live cell imaging was performed under a confocal microscope (Top), (Scale bars, 5 μm.) The quantification of GFP-PARP1 and GFP-DOT1L accumulation intensity at DSB stripes (Bottom, n = 10). The curves represent the means ± SEM. (D) U2OS-265 DSB reporter cells were transfected with GFP-DOT1L for 48 h, and cells were induced site-specific DSBs with addition of Shield-1 and 4-OHT and processed for immunofluorescence. (Scale bars, 5 μm.) (E) AsiSI-ER-U2OS-AID cells were pretreated with 300 nM 4-OHT for 4 h to induce DSBs and subjected to the ChIP assay 24 h later with anti-DOT1L (Left) or anti-γH2AX (Right). The γH2AX signal around the AsiSI site served as a positive control. The IP/input% from three independent experiments is shown. Data represent the means ± SD, unpaired t test, *P < 0.05, **P < 0.01. (F) HeLa cells were exposed to 10 Gy IR and released at the indicated time points. The whole cell lysates were prepared and subjected to immunoprecipitation using anti-DOT1L before immunoblotting. (G) HeLa cells were treated with 10 μM KU-55933 (ATM inhibitor), 10 μM VE-821 (ATR inhibitor), 10 μM KU-57788 (DNA-PKcs inhibitor), or 50 μM TBB (CK2 inhibitor) for 2 h; then, the cells were exposed or not to IR (10 Gy, release 2 h). The chromatin fractions and whole cell lysates were extracted for western blotting. (H) HeLa cells were transfected with GFP-DOT1L for 48 h and treated with indicated inhibitors before microirradiation. Representative images after DNA damage are shown (Left). (Scale bars, 5 μm.) Quantification of GFP-DOT1L accumulation intensity at DSB stripes (Right, n = 10). The curves represent the means ± SEM.
Fig. 3.
Fig. 3.
RAP80 is methylated by DOT1L in vivo and in vitro. (A) Cell extracts from HeLa parental or DOT1L-KO HeLa cells were immunoprecipitated using an anti-RAP80 antibody to assess RAP80 pan-methylation (Pan-me). (B) DOT1L-KO HeLa cells were transfected with plasmid backbone pcDNA (invitrogen), Flag-DOT1L-WT, and Flag-DOT1L-MU for 48 h. Whole cell lysates were prepared and subjected to immunoprecipitation with an anti-RAP80 antibody before immunoblotting. (C) HeLa parental and DOT1L-KO HeLa cells were exposed or not to IR (10 Gy, release 2 h). Whole cell lysates were immunoprecipitated with an anti-RAP80 antibody before immunoblotting. (D) HeLa parental and DOT1L-KO HeLa cells transfected with pcDNA, Flag-DOT1L-WT, and Flag-DOT1L-MU for 48 h and then exposed or not to IR (10 Gy, release 2 h). Whole cell lysates were subjected to immunoprecipitation with anti-RAP80 antibody before immunoblotting. Short, short exposure time, Long, long exposure time. (E) In vitro methylation assay using the recombinant GST-DOT1L-D1 fragment as the enzyme. Octamer (Left) and His-RAP80 (Right) served as the substrates for the positive control and to assess RAP80 pan-methylation, respectively. (F) HeLa cells were transfected with Flag-RAP80-WT or indicated Flag-RAP80-mutant plasmids for 48 h. Whole cell lysates were subjected to immunoprecipitation with M2 beads before immunoblotting. (G) In vitro methylation assay using the recombinant GST-DOT1L-D1 fragment as the enzyme. His-RAP80-WT and His-RAP80-4KR were used as the substrate to assess RAP80 pan-methylation.
Fig. 4.
Fig. 4.
RAP80 methylation by DOT1L is indispensable for RAP80 recruitment to chromatin in response to DNA damage. (A) HeLa parental and DOT1L-KO HeLa cells were exposed to 10 Gy IR and released at the indicated time points. The chromatin fraction was isolated and analyzed by western blotting. (B) HeLa parental and DOT1L-KO HeLa cells were transfected with GFP-RAP80 and irradiated with a 365-nm UV laser (Left). (Scale bars, 5 μm.) Quantification of GFP-RAP80 accumulation at DSBs (Right, n = 10). The curves represent the means ± SEM. (C) RAP80 foci formation in HeLa parental cells and DOT1L-KO HeLa cells after exposure to IR (2 Gy, release 2 h). The quantification of RAP80 foci formation per nucleus (n = 200) is shown. Data represent the means ± SD, ****P < 0.0001. (D) HeLa parental and DOT1L-KO HeLa cells were transfected with pcDNA, Flag-DOT1L-WT, and Flag-DOT1L-MU for 48 h. Then, the cells were exposed or not to IR (10 Gy, release 2 h), and the chromatin fractions were extracted for western blotting. (E) HeLa cells were transfected with GFP-RAP80 or GRP-RAP80-4KR and irradiated with a 365-nm UV laser before monitoring GFP-RAP80 and GRP-RAP80-4KR accumulation at DSBs. The white dotted line indicates the irradiation path. Live cell images were captured under a confocal microscope (Left). (Scale bars, 5 μm.) Quantification of GFP-RAP80 and GRP-RAP80-4KR accumulation at DSBs (Right, n = 10). The curves represent the means ± SEM. (F) HeLa parental and DOT1L-KO HeLa cells were transfected with pcDNA, Flag-DOT1L-WT, or Flag-DOT1L-MU and cotransfected (or not) with GFP-RAP80-WT or GFP-RAP80-4KR, as indicated. At 48 h after transfection, the cells were exposed to IR (10 Gy, release 2 h), and the chromatin fractions were extracted for western blotting. (G) HeLa parental and DOT1L-KO HeLa cells were transfected with mCherry-RAP80-WT/4KR alone or mCherry-RAP80-WT/4KR together with GFP-DOT1L-WT or GFP-DOT1L-MU as indicated before irradiation with a UV laser. Quantification of mCherry-RAP80-WT/4KR and GFP-DOT1L-WT/MU accumulation intensity at damaged DNA stripes (n = 10). The curves represent the means ± SD.
Fig. 5.
Fig. 5.
Methylated RAP80 binds to ubiquitinated H2A in response to DNA damage. (A) Volcano plot depicting protein interactions with Flag-RAP80-WT or Flag-RAP80-4KR. The Right panel illustrates proteins exclusively interacting with Flag-RAP80-WT (P < 0.0001). (B) Protein-protein interaction (PPI) network analysis using cytoscape, based on the identified Flag-RAP80-WT vs. Flag-RAP80-4KR which exclusively interacted with Flag-RAP80-WT. (C) HeLa parental and DOT1L-KO HeLa cells were exposed to IR (10 Gy, release 2 h). Whole cell lysates were harvested and immunoprecipitated with an anti-RAP80 antibody. (D) HeLa parental and DOT1L-KO HeLa cells were transfected with pcDNA, Flag-DOT1L-WT, or Flag-DOT1L-MU for 48 h. Then, the cells were exposed to IR (10 Gy, release 2 h), and the whole cell lysates were immunoprecipitated with an anti-RAP80 antibody. (E) HeLa cells were transfected with pcDNA, Flag-RAP80-WT, or Flag-RAP80-4KR for 48 h. Then, the cells were exposed to IR (10 Gy, release 2 h), and the whole cell lysates were subjected to immunoprecipitation with M2 beads. (F) In vitro methylation assay using the recombinant GST-DOT1L-D1 fragment as the enzyme and His-RAP80-WT and His-RAP80-4KR as the substrate. Unmethylated RAP80 or methylated RAP80 was then incubated with whole HeLa cell lysates that had been exposed to IR (10 Gy, release 2 h), at 4 °C for 3 h. Then, a His pull-down was performed before western blotting to detect the interaction between RAP80 and UbH2A.
Fig. 6.
Fig. 6.
Chromatin-enriched RAP80 recruits the BRCA1-A complex to chromatin in response to DNA damage. (A) HeLa parental and DOT1L-KO HeLa cells were exposed to IR (10 Gy) and released at the indicated time points. Chromatin fractions were extracted and then subjected to western blotting. (B) HeLa parental and DOT1L-KO HeLa cells were transfected with pcDNA, Flag-DOT1L-WT, and Flag-DOT1L-MU for 48 h. Then, the cells were exposed or not to IR (10 Gy, release 2 h). The chromatin fractions were extracted and analyzed by western blotting. (C) HeLa cells were transfected with siRAP80 or a nonspecific siRNA (siNC) for 24 h and then transfected with Flag-RAP80-WT or Flag-RAP80-4KR, as indicated, for 48 h. Then, the cells were exposed or not to IR (10 Gy, release 2 h) before the chromatin fractions were extracted and analyzed by western blotting. (D) HeLa cells were transfected with siRAP80 for 24 h and then transfected with Flag-RAP80-WT or Flag-RAP80-4KR for 48 h. The cells were exposed to IR (2 Gy, release 2 h) and then stained with an anti-Flag (red) and an anti-BRCA1 antibody (green). Representative images are shown (Left). (Scale bars, 10 μm.) The quantification of Flag-RAP80 and BRCA1 foci formation per cell (Right, n = 200) are shown. Data represent the means ± SD, ****P < 0.0001. (E) HeLa parental and DOT1L-KO HeLa cells were transfected with pcDNA, Flag-DOT1L-WT, or Flag-DOT1L-MU for 48 h. Then, the cells were exposed to IR (10 Gy, release 1 h or 6 h) and then subjected to the comet assay. The tail moments of cells (n = 100) were quantified using ImageJ. Data represent the means ± SD, n.s., not significant, ****P < 0.0001. (F) HeLa parental and shRAP80 HeLa cells were transfected with the indicated plasmids for 48 h. Then, the cells were exposed to IR (10 Gy, release 1 h or 6 h) and then subjected to the comet assay. The tail moments of cells (n = 100) were quantified using ImageJ. Data represent the means ± SD, n.s., not significant, ****P < 0.0001.
Fig. 7.
Fig. 7.
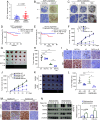
DOT1L is a potential candidate for anticancer combination regimens. (A) DOT1L expression was evaluated by the German semiquantitative scoring system according to the staining intensity; the proportion of DOT1L expression was compared between radiotherapy-sensitive (n = 36, mini-0, max-1.8, center-0.9, lower quartile-0.8, upper quartile-1) and radiotherapy-resistant tissues (n = 36, mini-0, max-3, center-1.2, lower quartile-1, upper quartile-1.4) of cervical cancer patient samples. P = 0.0007. (B and C) A cervical cancer tissue microarray was stained with anti-DOT1L by immunohistochemistry, and the relationship between DOT1L expression and radiotherapy sensitivity (B) and the tumor grade gradually increased from Left to Right (C). [Scale bars, 500 μm (Top) and 100 μm (Bottom).] (D and E) Kaplan–Meier estimates of overall survival (P = 0.0008) (D) and progression-free survival (P = 0.0011) (E) of cervical cancer patients after radiotherapy with different expression levels of DOT1L. The log-rank test was used to compare the survival curves. (FH) HeLa cells were injected into nude mice and treated with vehicle, EPZ5676 (6.5 mg/kg), IR (3 Gy), or EPZ5676 (6.5 mg/kg) together with IR (3 Gy). EPZ5676 injection or local IR was performed every other day from day 15, and the tumor size was subsequently measured at the indicated time points. The tumor volumes (F), tumor images (G), and tumor weights (H) were measured as indicated. Data represent the means ± SD (n = 5). n.s., not significant, ***P < 0.001, ****P < 0.0001. (Scale bars, 10 μm.) (I) Immunohistochemistry staining for Ki-67 and γH2AX of the xenograft tumors shown in G. (Scale bars, 50 μm.) (JL) HeLa cells stably expressing RAP80-WT or RAP80-4KR were injected into nude mice exposed or not to IR (3 Gy, every other day from day 15). The tumor size was measured at the indicated time points. The tumor volumes (J), tumor images (K), and tumor weights (L) were measured as indicated. Data represent the means ± SD (n = 5). n.s., not significant, *P < 0.05, **P < 0.01, and ***P < 0.001. (M) Immunohistochemistry staining for Ki-67 and γ-H2AX of the xenograft tumors shown in K. (Scale bars, 50 μm.) (N) DOT1L expression and RAP80 methylation levels in radiotherapy-sensitive and radiotherapy-resistant cervical cancer patient tissues (Left), and the quantification (Right) of the proportion of DOT1L expression (DOT1L band density vs. α-tubulin band density) (P = 0.0259) and the proportion of RAP80 methylation levels (RAP80 band density vs. pan-me band density) (P = 0.0475). Data represent the means ± SEM (n = 5).

References

    1. Ciccia A., Elledge S. J., The DNA damage response: Making it safe to play with knives. Mol. Cell 40, 179–204 (2010). - PMC - PubMed
    1. Jackson S. P., Bartek J., The DNA-damage response in human biology and disease. Nature 461, 1071–1078 (2009). - PMC - PubMed
    1. Lord C. J., Ashworth A., The DNA damage response and cancer therapy. Nature 481, 287–294 (2012). - PubMed
    1. Silver D. P., Livingston D. M., Mechanisms of BRCA1 tumor suppression. Cancer Discov. 2, 679–684 (2012). - PMC - PubMed
    1. Tarsounas M., Sung P., The antitumorigenic roles of BRCA1-BARD1 in DNA repair and replication. Nat. Rev. Mol. Cell Biol. 21, 284–299 (2020). - PMC - PubMed

MeSH terms

LinkOut - more resources