

Real-time AIoT platform for monitoring and prediction of air quality in Southwestern Morocco
- PMID: 39172803
- PMCID: PMC11340891
- DOI: 10.1371/journal.pone.0307214
Real-time AIoT platform for monitoring and prediction of air quality in Southwestern Morocco
Abstract
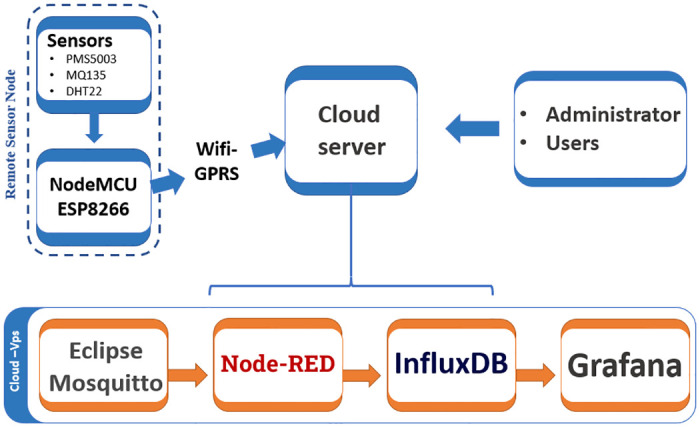
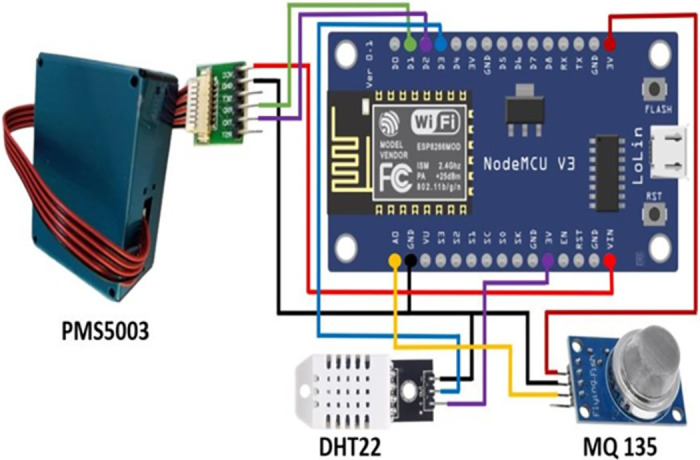
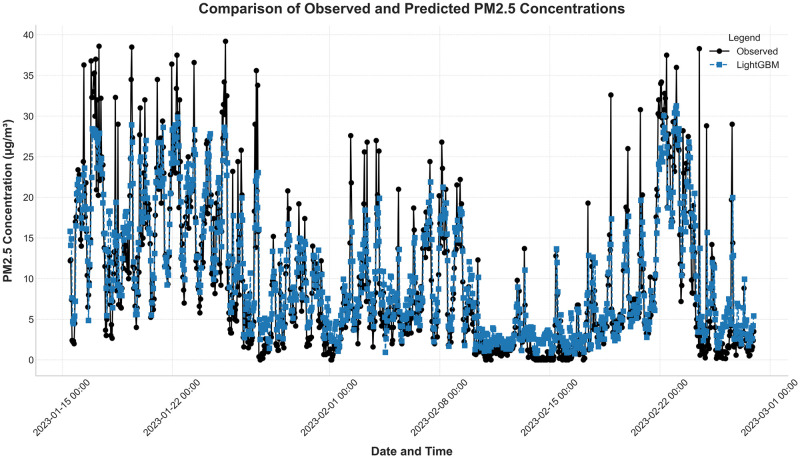
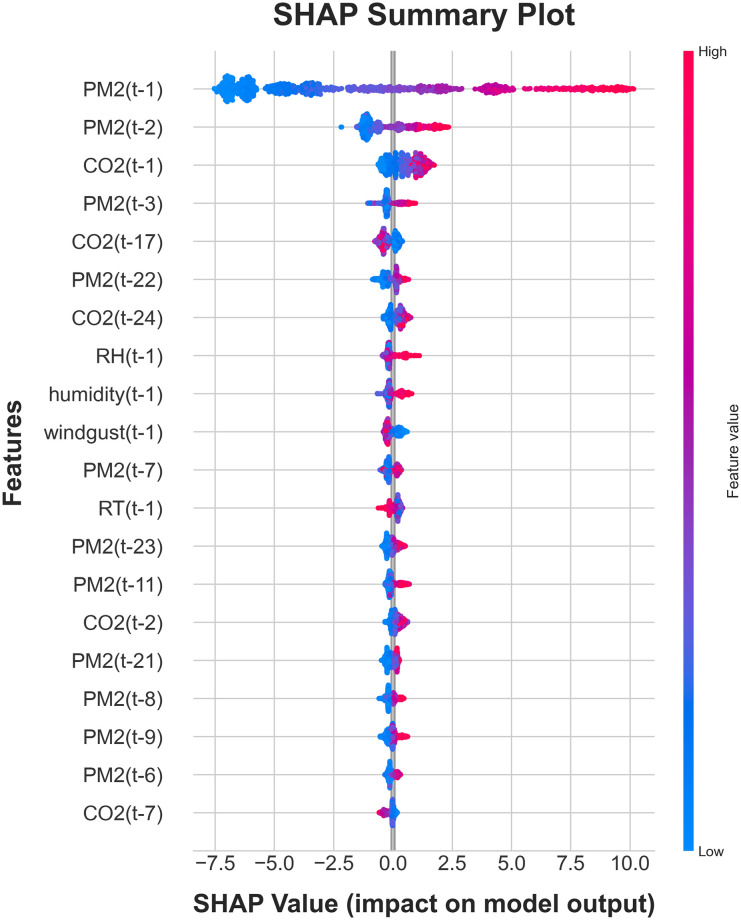
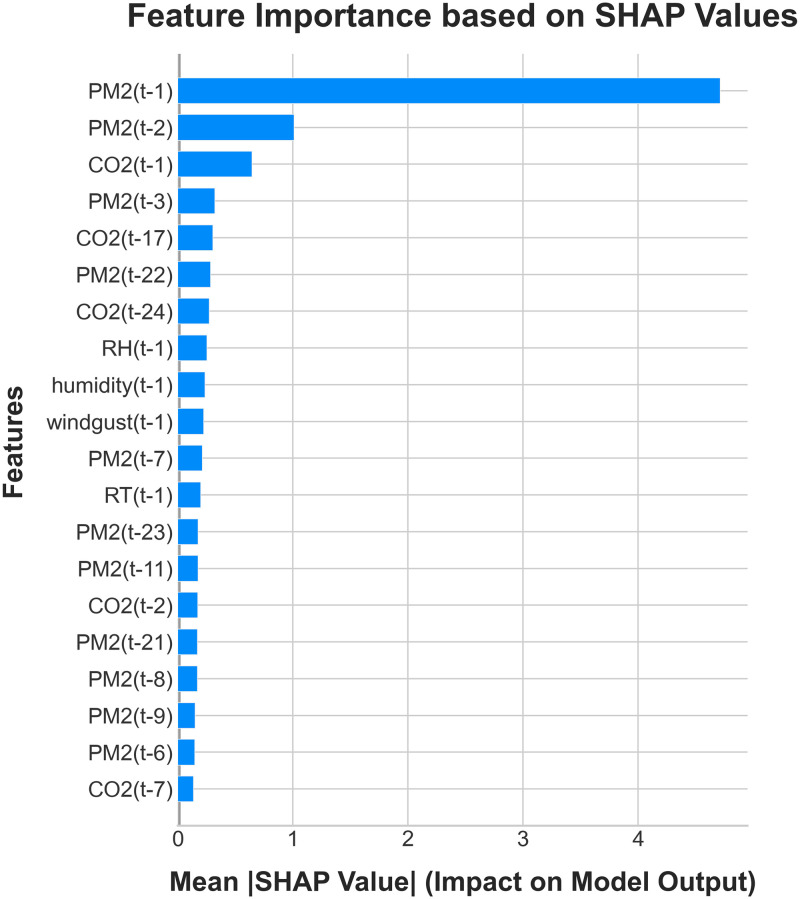
Urbanization and industrialization have led to a significant increase in air pollution, posing a severe environmental and public health threat. Accurate forecasting of air quality is crucial for policymakers to implement effective interventions. This study presents a novel AIoT platform specifically designed for PM2.5 monitoring in Southwestern Morocco. The platform utilizes low-cost sensors to collect air quality data, transmitted via WiFi/3G for analysis and prediction on a central server. We focused on identifying optimal features for PM2.5 prediction using Minimum Redundancy Maximum Relevance (mRMR) and LightGBM Recursive Feature Elimination (LightGBM-RFE) techniques. Furthermore, Bayesian optimization was employed to fine-tune hyperparameters of popular machine learning models for the most accurate PM2.5 concentration forecasts. Model performance was evaluated using Root Mean Square Error (RMSE), Mean Absolute Error (MAE), and the coefficient of determination (R2). Our results demonstrate that the LightGBM model achieved superior performance in PM2.5 prediction, with a significant reduction in RMSE compared to other evaluated models. This study highlights the potential of AIoT platforms coupled with advanced feature selection and hyperparameter optimization for effective air quality monitoring and forecasting.
Copyright: © 2024 Bekkar et al. This is an open access article distributed under the terms of the Creative Commons Attribution License, which permits unrestricted use, distribution, and reproduction in any medium, provided the original author and source are credited.
Conflict of interest statement
The authors have declared that no competing interests exist.
Figures


References
-
- United Nations. (2018). World Urbanization Prospects 2018 [Report]. Retrieved June 22, 2023, from https://www.un.org/en/desa/2018-revision-world-urbanization-prospects.
-
- World Economic Forum. (2015). Global Risks 2015 [Report]. Retrieved June 22, 2023, from https://www.weforum.org/reports/global-risks-2015.
-
- World Health Organization. (2018). 9 out of 10 people worldwide breathe polluted air, but more countries are taking action [Report]. Retrieved June 22, 2023, from https://www.who.int/news/item/02-05-2018-9-out-of-10-people-worldwide-br....
-
- Khafaie M. A., Yajnik C. S., Salvi S. S., & Ojha A. (2016). Critical review of air pollution health effects with special concern on respiratory health. Journal of air pollution and health, 1(2), 123–136.
MeSH terms
Substances
LinkOut - more resources
Full Text Sources
Medical
