. 2024 Aug 23;385(6711):eabm6131.
doi: 10.1126/science.abm6131. Epub 2024 Aug 23.

Restoring hippocampal glucose metabolism rescues cognition across Alzheimer's disease pathologies

Affiliations

Restoring hippocampal glucose metabolism rescues cognition across Alzheimer's disease pathologies

Paras S Minhas et al. Science. .

Abstract

Impaired cerebral glucose metabolism is a pathologic feature of Alzheimer's disease (AD), with recent proteomic studies highlighting disrupted glial metabolism in AD. We report that inhibition of indoleamine-2,3-dioxygenase 1 (IDO1), which metabolizes tryptophan to kynurenine (KYN), rescues hippocampal memory function in mouse preclinical models of AD by restoring astrocyte metabolism. Activation of astrocytic IDO1 by amyloid β and tau oligomers increases KYN and suppresses glycolysis in an aryl hydrocarbon receptor-dependent manner. In amyloid and tau models, IDO1 inhibition improves hippocampal glucose metabolism and rescues hippocampal long-term potentiation in a monocarboxylate transporter-dependent manner. In astrocytic and neuronal cocultures from AD subjects, IDO1 inhibition improved astrocytic production of lactate and uptake by neurons. Thus, IDO1 inhibitors presently developed for cancer might be repurposed for treatment of AD.


Figures
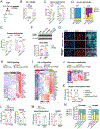
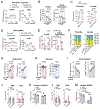
Figure 1.
Figure 1.. Activation of astrocytic IDO1 in response to amyloid Aß42 and tau oligomers suppresses astrocytic glycolysis
Data are mean ± s.e.m. and analyzed using two-way ANOVA with Tukey post hoc tests: *P<0.05, **P<0.01, ***P<0.001 and ****P<0.0001. Hierarchical clustering is represented in terms of distance from the mean, or Z-score. (A) The kynurenine pathway (KP): the essential amino acid tryptophan (TRP) is metabolized to kynurenine (KYN) by IDO1. The specific IDO1 inhibitor PF06840003 (PF068) prevents KYN production. (B) qRT-PCR of Ido1 expression in mouse astrocytes stimulated with oAβ+oTau (100nM, 20h) +/− PF068 (100 nM, 20h; n=12/group) (C) Primary mouse astrocytes were stimulated with veh or oAβ+oTau (100nM, 20h) +/− PF068 (100nM, 20h). LC-MS quantification of TRP and KYN (n=5/group). (D) Isotope tracing of 13C-TRP [M+11] to KYN [M+10] in mouse astrocytes (n=5/group). Similar mass labeling occurs in human astrocytes (Supplementary Fig. 1G) (E) iPSC derived human iAstrocytes were stimulated with veh or oAβ+oTau (100 nM, 20h) +/− PF068 (100 nM, 20h). LC-MS quantification of TRP and KYN (n=5/group). (F) Coimmunoprecipitation (CoIP) of AhR and ARNT in mouse astrocytes. (Top) Representative immunoblot. (Bottom) Quantification of co-immunoprecipitated AhR:ARNT in astrocytes treated with oAβ+oTau +/− PF068 (100 nM, 20h). (G) Immunocytochemical detection of AhR (red) in primary mouse astrocytes (GFAP, blue) shows nuclear localization following stimulation with oAβ+oTau (100 nM, 20h) that is prevented with PF068 (100 nM, 20h). Scale bars=50μM. (H) qRT-PCR of AhR-dependent gene transcripts significantly altered in mouse astrocytes +/− oAβ+oTau (q < 0.05). (I) qRT-PCR of Hif-1α-dependent gene transcripts significantly altered in mouse astrocytes +/− oAβ+oTau (q < 0.05). (J) LC/MS of glycolytic metabolites in primary astrocytes +/− oAβ+oTau (100 nM, 20h) and +/− PF068 (100 nM, 20h); n=5/group). (K) Realtime oxygen consumption rate (OCR) in mouse astrocytes +/− oAβ+oTau (100 nM, 20h) +/− PF068 (100nM, 20h; n=6/group). Cells were treated with 1 μM oligomycin (olig), 2 μM carbonyl cyanide-p-trifluoromethoxyphenylhydrazone (FCCP) and 0.5 μM rotenone and antimycin (rot/an), as indicated by the three arrows. (L) Quantification of basal respiration and extracellular acidification rate (ECAR) from (K), n=6/group. (M) Mouse astrocytes were transfected with either scrambled siRNA (Scr) or siRNA to Ido1. Quantification of basal respiration (left) and ECAR (right), n=5/group. (N) Pyruvate and lactate levels from isotope-tracing of 13C-glucose administered to mouse astrocytes transfected with either siRNA (Scr) or siRNA to Ido1 and stimulated with veh or oAβ+oTau (100 nM, 20h; n=5/group).
Figure 2.
Figure 2.. IDO1 inhibition regulates lactate levels in astrocytes and in hippocampus of mutant APP mice.
Data are mean ± s.e.m. and analyzed using two-way ANOVA with Tukey post hoc tests: *P<0.05, **P<0.01, ***P<0.001 and ****P<0.0001, unless otherwise specified. (A) Realtime ECAR and OCR tracings in mouse astrocytes stimulated with increasing concentrations of KYN (n=5 per group, 20h). (B) Quantification of ECAR and basal respiration from (A), 1-way ANOVA with Tukey post hoc test (n=5 per group). (C) LC/MS quantification of pyruvate and lactate in mouse astrocytes stimulated +/− oAß+oTau (100 nM each, 20h) and supplemented +/− KYN (25 mM, 20 hours). (D) Real-time OCR and ECAR traces in mouse astrocytes transfected with shRNA to AhR and stimulated with veh or oAβ+oTau (100nM each, 20h; n = 5/group). (E) Mouse astrocytes were transfected with either scrambled shRNA (Scr) or shRNA to AhR (AhR). Quantification of ECAR (left) and basal respiration (right), n=5/group. (F) Isotope-tracing of 13C-glucose administration and quantification of pyruvate and lactate in mouse astrocytes transfected with either shRNA (Scr) or shRNA to AhR and stimulated with veh or oAβ+oTau (100 nM each, 20h; n=5/group). (G) Real-time changes in ECAR and OCR in mouse astrocytes stimulated with increasing doses of PF068 (n=5/group, 20h). One-way ANOVA, Tukey post-hoc test, ****P<0.001. (H) Real-time changes in ECAR and OCR in mouse hippocampal neurons stimulated with increasing doses of PF068 (n=6-9/group, 20h). (I) LC-MS quantification of hippocampal KYN and lactate in 6 mo old WT mice (n=6 mice/group) treated with increasing doses of PF068 for 4h. One-way ANOVA, Tukey post-hoc test, ****P<0.001. (J) Hippocampal TRP and KYN levels in APP/PS1 male mice +/− PF068 at 15 mg/kg orally for one month (n=5-7/group). (K) Hippocampal lactate levels in APP/PS1 male mice from (J). (L) Hippocampal TRP and KYN levels in 5xFAD female mice +/− PF068 at 15 mg/kg orally for one month (n=5-6/group). (M) Hippocampal lactate levels in 5X FAD female mice from (L)
Figure 3.
Figure 3.. IDO1 inhibition restores hippocampal memory and long-term potentiation in mutant APP models.
Wild type and 5XFAD mice (5-6 mo females/group), and WT and APP/PS1 mice (10-12 mo males/group) were treated with vehicle or PF068 (15 mg/kg/day for 1 month); APP/PS1 mice were crossed onto an Ido1 null background to generate APP/PS1 mice deficient in Ido1. Data are mean ± s.e.m. and are analyzed using two-way ANOVA with Tukey post hoc tests: *P<0.05, **P<0.01, ***P<0.001 and ****P<0.0001, unless otherwise specified. Hierarchical clustering is represented in terms of distance from the mean, or Z-score. (A) Representative tracings of the test trial day in the Barnes Maze in APP/PS1 male mice +/− PF068; escape hole in target quadrant (TQ) is in green. (B) Percentage of time in the TQ from (A) (n=9-10/group). (C) Discrimination index in the Novel Object Recognition (NOR) task for the number of interactions with the novel object in APP/PS1 male mice +/− PF068 (n=9-10/group). (D) Long-term potentiation, measured as the change in field excitatory postsynaptic potential (fEPSP) in the CA1 hippocampal region over 150 min in APP/PS1 male mice +/− PF068 (15 mg/kg/day, 1 month). Three episodes of theta-burst stimulation (3 × TBS; black arrows) were applied. Two-way ANOVA, effects of time and genotype P < 0.0001; Sidak’s multiple comparisons test with Geisser–Greenhouse correction ***P<0.05 (n = 8-9 slices, 4-5 mice per group). (E) Morris water maze testing and time in the TQ for 10-12 mo male APP/PS1 mice with Ido1 deletion (n=11-23/group). (F) KYN levels in hippocampus of APP/PS1 male mice +/− Ido1 deletion (n=6-7 mice per group). (G) Lactate levels in hippocampus of APP/PS1 male mice +/− Ido1 deletion (n=6-7 mice/group). (H) Barnes maze for 5XFAD female mice +/− PF068. Quantification of time in the target quadrant (TQ), n=10/group. (I) Discrimination index in the Novel Object Recognition (NOR) task in 5XFAD female mice +/− PF068; n=10/group. (J) Long-term potentiation, measured as the change in field excitatory postsynaptic potential (fEPSP), in the CA1 hippocampal region over 140 min in 5XFAD female mice +/− 1 month of PF068 treatment (15 mg/kg/day). Two-way ANOVA, effects of time and genotype: P < 0.0001; Sidak’s multiple comparisons test with Geisser–Greenhouse correction; ***P<0.001 (n = 8-9 slices, 4-5 mice per group). (K) Immunostaining for ThioS, 6E10 and BACE1 in subiculum of 5-8 mo 5XFAD male mice +/− PF068; scale bar = 50 μm. (L) Quantification of area immunostained for ThioS, 6E10, and BACE1 in subiculum (top row) and cerebral cortex (bottom row); Student’s unpaired t-test, n=6-7 per group. (M) qRT-PCR of AhR-dependent gene transcripts significantly altered in hippocampus of 5XFAD female mice administered PF068; 2-way ANOVA with Bonferroni post hoc test (q < 0.05). (N) qRT-PCR of Hif-1α-dependent gene transcripts significantly altered in hippocampus of 5XFAD female mice administered PF068; 2-way ANOVA with Bonferroni post hoc test (q < 0.05).
Figure 4.
Figure 4.. IDO1 inhibition rescues hippocampal memory and plasticity in mutant Tau PS19 mice.
Wild type and PS19 mice (8-9 months old, n=7-10/group, males and females) were treated with vehicle or PF068 (15 mg/kg/day for 1 month). Data are mean ± s.e.m. and are analyzed using two-way ANOVA with Tukey post hoc tests: *P<0.05, **P<0.01, ***P<0.001 and ****P<0.0001, unless otherwise specified. Hierarchical clustering is represented in terms of distance from the mean, or Z-score. (A) LC-MS quantification of TRP and KYN in hippocampus of PS19 mice (n=6/group) (B) Lactate levels in hippocampus of PS19 mice (n=5/group) (C) Representative tracings of path to escape hole (green) in PS19 mice +/− PF068 on the day of testing in the Barnes maze. (D) Time to the escape hole in the TQ in PS19 mice. (E) Long-term potentiation, measured as the change in field excitatory postsynaptic potential (fEPSP) in the CA1 hippocampal region over 80 min in PS19 mice +/− PF068 treatment (15 mg/kg for one month). Two-way ANOVA, effects of time and genotype P < 0.0001; Sidak’s multiple comparisons test with Geisser–Greenhouse correction **P<0.01 (n = 8-9 slices, 4-5 mice per group). (F) qRT-PCR of AhR-dependent gene transcripts (left heat map) and Hif-1α-dependent gene transcripts (right heat map) significantly altered in hippocampus of PS19 mice administered PF068 (q < 0.05). (G) Representative immunoblot of hippocampal soluble total tau, Thr-181 phospho-tau, and Thr-231 phospho-tau in PS19 mice administered PF068. (H) Quantification of soluble total tau, Thr-181 phospho-tau, and Thr-231 phospho-tau; unpaired t-test with Welch’s correction (n=5-6 mice/group). (I) Representative immunoblot of hippocampal sarkosyl-insoluble total tau, Thr-181 phospho-tau, and Thr-231 phospho-tau in PS19 mice administered PF068. (J) Quantification of sarkosyl-insoluble total tau, Thr-181 phospho-tau, and Thr-231 phospho-tau; unpaired t-test with Welch’s correction (n=5-6 mice/group).
Figure 5.
Figure 5.. IDO1 inhibition restores hippocampal glucose metabolism across amyloid and tau pathologies.
5XFAD and WT littermates (5-6 months old, female), APP/PS1 and WT littermates (10-12 months old, male), PS19 and WT littermates (8-9 months old, n=7-10/group, males and females) were treated with veh or PF068 at 15 mg/kg/day for one month. Hierarchical clustering of significantly regulated metabolites (1 way ANOVA, FDR <0.05) is represented in terms of distance from the mean, or Z-score. Metabolic maps are represented by the average Z-score. (A) Venn diagram depicting number of significant metabolites (q < 0.05) detected by untargeted metabolomics from hippocampi in PF068-treated vs. veh-treated APP/PS1, 5XFAD, and PS19 mice. 13 metabolites are shared across the three comparisons of amyloid and tau pathologies. (B) Enrichment pathway analysis of 13 shared metabolites from (A) using MetaboAnalyst. (C) Hierarchical clustering of the 13 shared hippocampal metabolites in 5XFAD and WT littermates +/− PF068. (D-E) Schematic depicting levels of glycolytic and TCA metabolites and their average Z-score value from (C). Note the rescue of glycolysis and TCA with IDO1 inhibition in 5XFAD mice. (F) Hierarchical clustering of the 13 shared hippocampal metabolites In APP/PS1 littermates +/− PF068. (G) Glycolytic and TCA cycle metabolomic profiling of hippocampi isolated from WT (n=7), Ido1−/− (n=6), APP/PS1 (n=7), APP/PS1;Ido1−/− (n=7) male littermates at 10-12 months of age. (H) Hierarchical clustering of the 13 shared hippocampal metabolites in PS19 and WT littermates +/− PF068. (I-J) Schematic depicting levels of glycolytic and TCA metabolites and their average z-score value from (H). Note the rescue of glycolysis and TCA with IDO1 inhibition in PS19 mice.
Figure 6.
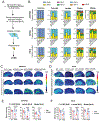
Figure 6.. In vivo mass-labeling reveals that IDO1 inhibition rescues glucose incorporation into the TCA cycle in hippocampi of AD model mice.
APP/PS1 mice (10-12 months old, male, n=5/group), 5xFAD mice (5-6 months old, female, n=5/group) and PS19 mice (8-9 months old, male and female n=5/group) and age-matched WT littermates were treated +/− PF068 for one month. Mice subsequently underwent heavy isotope-labeling experiments and MALDI imaging. Data are mean ± s.e.m. and analyzed using two-way ANOVA with Tukey post hoc tests: *P<0.05, **P<0.01, ***P<0.001 and ****P<0.0001. (A) Schematic depicting carotid catheterization and infusion of 13C-glucose to achieve steady-state isotope labeling of glucose in vivo in AD model mice. (B) Isotope tracing of 13C-glucose metabolism in hippocampi of APP/PS1 (top row), 5XFAD (middle row), and PS19 (bottom row) mice treated with veh or PF068. IDO1 inhibition with PF068 restores glucose incorporation into glycolytic and TCA metabolites across both amyloid and tau pathologies. (C-D) Representative images of matrix-assisted laser desorption/ionization (MALDI) of coronal hippocampal sections from APP/PS +/−PF068 and PS19 +/−PF068 mice showing rescue in 13C-labeled glycolytic intermediate fructose1,6-BP [M+6], lactate [M+3], and TCA intermediate malate [M+4]. (E-F) Mean fluorescent intensity (MFI) quantification of C-D.
Figure 7.
Figure 7.. IDO1 inhibition rescues lactate-dependent LTP in hippocampi of AD model mice.
APP/PS1 mice (10-12 months old, male), 5xFAD mice (5-6 months old, female) and PS19 mice (8-9 months old, male and female) and WT littermates were treated +/− PF068 at 15 mg/kg/day for one month and hippocampal slices were assessed by electrophysiology and mass labeling. Data are mean ± s.e.m. (A-C) LTP, measured as the change in field excitatory postsynaptic potential (fEPSP) in the CA1 hippocampal region over 180 min. Hippocampal slices from PF068-treated AD and WT mice were stimulated with monocarboxylate transporter-1/2 inhibitor (MCTi, 50μM) beginning 15 minutes after the start of the recording (blue arrow) and 45 minutes before theta-burst stimulation (3 × TBS; black arrows) and continuing for the whole recording interval. Two-way ANOVA, effects of time and genotype P < 0.0001; Sidak’s multiple comparisons test with Geisser–Greenhouse correction **P<0.01, ***P<0.001, ****P<0.0001 (n = 8-9 slices/hippocampus). (A) Comparison between APP/PS+PF068 and APP/PS+PF068+MCTi, **P<0.01 (n=5 mice/group). (B) Comparison between 5XFAD+PF068 and 5XFAD+PF068+MCTi, ***P<0.001 (n=6 mice/group). (C) Comparison between PS19+PF068 and PS19+PF068+MCTi, ****P<0.0001 (n=6-8 mice/group). (D) Schematic detailing tracing of 13C-glucose labeling from the capillary to the neuron. The capillary contains [M+6] glucose. [M+6] glucose is taken up by the astrocyte foot process and metabolized to [M+3] lactate, which is then transported out of the astrocyte by MCT4 and into the neuron by MCT1/2. In the neuron, [M+3] lactate is converted to [M+3] pyruvate and then enters the TCA to fuel oxidative phosphorylation for generation of ATP for synaptic transmission. (E-G) Isotope tracing of 13C-glucose in hippocampal slices that had undergone LTP derived from APP/PS1 (E) 5XFAD (F) and PS19 (G) mice. A rescue in glucose incorporation into the TCA cycle occurs in hippocampi from AD model mice treated with IDO1 inhibitor. This rescue is blocked with administration of MCT1/2 inhibitor (n=5 mice/group, MCTi, 50μM).
Figure 8.
Figure 8.. IDO1 inhibition restores lactate transfer from hAstrocytes to hNeurons in late-onset AD.
(A) LC-MS quantification of TRP and KYN in middle frontal gyrus from non-demented Braak I-II, demented non-AD Braak stages I-II, AD Braak III-IV and AD Braak V-VI brain (n=12 donors per group). One way ANOVA, *P<0.05. (B) LC-MS quantification of TRP and KYN in cognitively normal (CN) and AD hNeurons (n=6 CN, n=4 AD). (C) LC-MS quantification of TRP and KYN in CN and AD hAstrocytes (n=6 CN, n=4 AD). 2-way ANOVA with Tukey’s post-hoc test, ***P<0.001, ****P<0.0001. (D) Schematic depicting experimental design for mass labeling of hAstrocytes and subsequent co-culture with hNeurons. hAstrocytes were paired with isogenic hNeurons derived from n=4 AD and n=6 CN subjects. hAstrocytes from CN and AD patients were labeled with 13C-glucose and stimulated with veh or PF068 (100nM, 20h). hAstrocytes on well-inlets were then washed, transferred and co-incubated with neurons for 4h. LC/MS was then performed on cell lysates of hAstrocytes and hNeurons. (E) Isotope tracing of 13C-glucose in hAstrocytes +/− PF068 (100nM, 20h) shows rescue of glucose incorporation into glycolytic intermediates and [M+3] lactate (n=6 CN, n=4 AD) (F) 13C-labelled hAstrocytes from (E) were washed, transferred, and co-incubated with hNeurons for 4 hours. Mass-labelled astrocytic [M+3] lactate is taken up by hNeurons via the MCT1/2 transporter, and [M+3] lactate metabolism and incorporation into hNeuron pyruvate and TCA intermediates was measured. Glucose flux is restored to CN levels in AD hNeurons co-cultured with hAstrocytes that had been treated with PF068 (n=6 CN, n=4 AD). (G) Principal component analysis of RNA-seq DEGs from hAstrocytes derived from CN and AD subjects +/− PF068 (100 nM, 20h; n=2 CN subjects and n=3 AD subjects with technical triplicates). (H) Principal component analysis of DEGs from CN and AD hNeurons that were co-cultured with congenic hAstrocytes stimulated +/− PF068 (100 nM, 20h; n=2 CN and n=3 AD, technical triplicates) (I) (Left) Box plots of kynurenine pathway (KP) transcripts from hAstrocytes derived from CN or LOAD subjects. Wald test, * P<0.05, ****P<0.001 (n=2 CN and n=3 AD, technical triplicates). (Right) Diagram of the KP highlighting enzymatic steps corresponding to transcripts increased in LOAD hAstrocytes. (J) Top significantly enriched gene ontology terms in LOAD hAstrocytes of transcripts significantly regulated by PF068 versus vehicle. (K) Top significantly enriched gene ontology terms from differentially regulated transcripts in LOAD hNeurons co-cultured with isogenic hAstrocytes that had been treated with PF068 versus vehicle. Note enrichment of pyruvate and TCA metabolic pathways.

Update of

Comment in

  • Alzheimer's and metabolism wed with IDO1.
    Johnson LA, Macauley SL. Johnson LA, et al. Science. 2024 Aug 23;385(6711):826-827. doi: 10.1126/science.adr5836. Epub 2024 Aug 22. Science. 2024. PMID: 39172856 Free PMC article.
  • Targeting the kynurenine pathway.
    Crunkhorn S. Crunkhorn S. Nat Rev Drug Discov. 2024 Nov;23(11):816. doi: 10.1038/d41573-024-00160-x. Nat Rev Drug Discov. 2024. PMID: 39333710 No abstract available.

References

    1. Knopman DS et al. , Alzheimer disease. Nature Reviews Disease Primers 7, 33 (2021). - PMC - PubMed
    1. Hebert LE, Scherr PA, Bienias JL, Bennett DA, Evans DA, Alzheimer disease in the US population: prevalence estimates using the 2000 census. Arch Neurol 60, 1119–1122 (2003). - PubMed
    1. Dewanjee S et al. , Altered glucose metabolism in Alzheimer's disease: Role of mitochondrial dysfunction and oxidative stress. Free Radical Biology and Medicine 193, 134–157 (2022). - PubMed
    1. Butterfield DA, Halliwell B, Oxidative stress, dysfunctional glucose metabolism and Alzheimer disease. Nature Reviews Neuroscience 20, 148–160 (2019). - PMC - PubMed
    1. Johnson ECB et al. , Large-scale proteomic analysis of Alzheimer's disease brain and cerebrospinal fluid reveals early changes in energy metabolism associated with microglia and astrocyte activation. Nat Med 26, 769–780 (2020). - PMC - PubMed

MeSH terms