. 2024 Aug 22;20(8):e1011219.
doi: 10.1371/journal.pgen.1011219. eCollection 2024 Aug.

A conserved protein tyrosine phosphatase, PTPN-22, functions in diverse developmental processes in C. elegans

Affiliations

A conserved protein tyrosine phosphatase, PTPN-22, functions in diverse developmental processes in C. elegans

Shaonil Binti et al. PLoS Genet. .

Abstract

Protein tyrosine phosphatases non-receptor type (PTPNs) have been studied extensively in the context of the adaptive immune system; however, their roles beyond immunoregulation are less well explored. Here we identify novel functions for the conserved C. elegans phosphatase PTPN-22, establishing its role in nematode molting, cell adhesion, and cytoskeletal regulation. Through a non-biased genetic screen, we found that loss of PTPN-22 phosphatase activity suppressed molting defects caused by loss-of-function mutations in the conserved NIMA-related kinases NEKL-2 (human NEK8/NEK9) and NEKL-3 (human NEK6/NEK7), which act at the interface of membrane trafficking and actin regulation. To better understand the functions of PTPN-22, we carried out proximity labeling studies to identify candidate interactors of PTPN-22 during development. Through this approach we identified the CDC42 guanine-nucleotide exchange factor DNBP-1 (human DNMBP) as an in vivo partner of PTPN-22. Consistent with this interaction, loss of DNBP-1 also suppressed nekl-associated molting defects. Genetic analysis, co-localization studies, and proximity labeling revealed roles for PTPN-22 in several epidermal adhesion complexes, including C. elegans hemidesmosomes, suggesting that PTPN-22 plays a broad role in maintaining the structural integrity of tissues. Localization and proximity labeling also implicated PTPN-22 in functions connected to nucleocytoplasmic transport and mRNA regulation, particularly within the germline, as nearly one-third of proteins identified by PTPN-22 proximity labeling are known P granule components. Collectively, these studies highlight the utility of combined genetic and proteomic approaches for identifying novel gene functions.


Conflict of interest statement

The authors have declared that no competing interests exist.

Figures

Fig 1
Fig 1. Loss of ptpn-22 can suppress nekl-associated molting defects.
(A) Merged fluorescence and DIC images of nekl-2(fd91); nekl-3(gk894345) worms in the presence (top) and absence (bottom) of the extrachromosomal array (fdEx286), which contains wild-type nekl-3 and SUR-5::GFP. Note the molting defective nekl-2; nekl-3 double mutant in the lower panel, which exhibits a mid-body constriction due to a failure to shed its old cuticle. (B,C) Bar graphs indicating the percentage of worms that developed into viable adults for the indicated genotypes including ptpn-22 genetic mutations and ptpn-22(RNAi). (D) Diagram highlighting the structural features of human PTPN22 and C. elegans PTPN-22 proteins including the catalytic domains (orange), active sites (turquoise), interdomain (light green; PTPN22 only), and proline-rich regions (PR.1–3; blue). Amino acid sequences of the proline-rich domains are also provided. Also indicated are the locations and effects of ptpn-22 alleles shown in Fig 1B. (E) Bright-field images of a wild-type worm and mutant worm carrying the ptpn-2(S33Stop) mutation. Error bars represent 95% confidence intervals. Fisher’s exact test was used to calculate p-values; ****p < 0.0001. Raw data are available in the S7 File. The sequences for ptpn-22 alleles can be found in the S1 File. aa, amino acid.
Fig 2
Fig 2. TurboID-based proximity labeling identifies the PTPN-22 interactome.
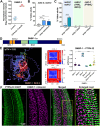
(A) Schematic illustrating the proximity labeling study. The C terminus of PTPN-22 was fused to TurboID::3×-FLAG, leading to the biotinylation of proximal proteins. Proximal proteins are depicted in blue, with the resulting biotin modification highlighted in red, whereas proteins located outside the TurboID labeling radius (~10 nm) are represented in gray. PTPN-22::TurboID or N2 control animals were cultured on plates, and subsequent protein extraction was carried out. Biotinylated proteins were pulled down using streptavidin-coated magnetic beads (orange), whereas non-biotinylated proteins were removed through washing steps. Enriched biotinylated proteins were subjected to on-bead digestion, followed by Data-Independent Acquisition (DIA) LC-MS/MS analysis. (B) Western blot (WB; left) shows the input fractions of representative N2 and PTPN-22::TurboID samples probed with streptavidin-HRP. Note additional bands in the PTPN-22::TurboID lysate versus the N2 control. The expression of PTPN-22::TurboID was visualized through an anti-FLAG western blot; antibodies against β-actin were used as a loading control. The pull-down fraction (IP, right) shows N2 and PTPN-22::TurboID samples probed with streptavidin-HRP after enriching for biotinylated proteins using streptavidin-coated beads. (C) Volcano plot highlighting proteins enriched (>2-fold and p-value <0.05) in PTPN-22::TurboID samples (red) versus N2 (blue). (D) Dot plots show the enrichment of PTPN-22 in PTPN-22::TurboID samples; error bars represent standard deviation. (E) KEGG pathway enrichment analysis was performed using ShinyGO 0.80, and the top 19 biological pathways based on fold enrichment are shown [124]. (F) Venn diagram shows the overlap of enriched proteins between PTPN-22::TurboID samples and P granule proteins (S2 File) (G) The dot plot shows the brood size of individual worms in the indicated backgrounds.
Fig 3
Fig 3. DNBP-1 associates with PTPN-22, and its loss suppresses nekl molting defects.
(A) Dot plot showing DNBP-1 enrichment in all four PTPN-22::TurboID samples; error bars represent standard deviation. (B, C) Bar graphs show the percentage of worms that developed without molting defects in different nekl mutants achieved by reducing DNBP-1 activity through either loss-of-function mutations (B) or RNAi (C). Fisher’s exact test was used to calculate p-values; ****p < 0.0001 and ***p < 0.001. (D) Schematic of DNBP-1A isoform showing structural domains. (E) One of the best predicted models by AlphaFold-multimer showing the predicted binding interaction between PTPN-22 (in blue) and the SH3.3 domain of DNBP-1 (in pink) as displayed in ribbon format. The PTPN-22 proline-rich region is highlighted in green with prolines shown. Colored lines indicate predicted interactions between PTPN-22 and DNBP-1 within 6 Å. Predicted aligned error (PAE) plots of two of the highest-scoring models (rank_1 and rank_2) of PTPN-22 with the SH3.3 domain of DNBP-1. Yellow arrows indicate the region corresponding to the predicted interaction; green arrow indicates the PTPN-22 proline-rich region. ipTM scores for 10 different models (two seeds with six recycles) generated by AlphaFold-multimer were plotted for the indicated domains of DNBP-1 with full-length wild-type PTPN-22 or PTPN-22 containing a mutated PR.1 domain (PR.1 mut). Error bars represent 95% confidence intervals; ****p < 0.0001 based on a t test. (F) Confocal images showing young adults expressing CRISPR-generated PTPN-22::EGFP (green) and DNBP-1::mScarlet (magenta) in the region of the apical epidermis including inset (highlighted in yellow box.) The orange arrow indicates an example overlap (white) between PTPN-22::EGFP and DNBP-1::mScarlet. Sequences for dnbp-1 mutant alleles can be found in the S1 File. Raw data are available in the S7 File.
Fig 4
Fig 4. PTPN-22 is localized to hemidesmosomes and shows a genetic interaction with CeHD proteins.
(A) Cartoon illustration depicting apical (MUA-3, MUP-4, and VAB-10A) and basal (LET-805 and VAB-10A) CeHD structural components within the epidermis. Intermediate filaments (IFs) connecting the complexes are indicated by red lines. The relative sizes of the different layers are not drawn to scale. Muscle cells attach to the basal lamina (extracellular matrix, ECM) separating the muscle and epidermis via α and β integrins (PAT-2 and PAT-3, respectively). (B) Co-localization in transgenic worms expressing endogenously tagged PTPN-22::mScarlet and GFP-tagged CeHD proteins (IFB-1A::GFP, MUP-4::GFP, LET-805::GFP, and VAB-10A::GFP). Note that PTPN-22::mScarlet; IFB-1A::GFP and PTPN-22::mScarlet; MUP-4::GFP transgenic worms exhibited a rolling (twisted) phenotype because of the presence of dominant rol-6 (su1006) transgene in these backgrounds (see S6 File). (C–F) RNAi feeding knockdown (KD) of mup-4 (C), let-805 (D), vab-10 (E), and mua-3 (F) was carried out in wild-type and ptpn-22(S33Stop) worms using the indicated dilution series. Error bars represent 95% confidence intervals. Fisher’s exact test was used to calculate p-values; ****p < 0.0001; *p < 0.05. (G) Dot plots show the enrichment of CeHD proteins in the Phyp7::PTPN-22::TurboID samples. Error bars represent standard deviation. Raw data are available in the S7 File.
Fig 5
Fig 5. PTPN-22 interactions with cell attachment and actin regulatory proteins.
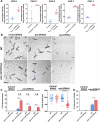
(A) Dot plots showing the enrichment of proteins in the PTPN-22::TurboID and Phyp7::PTPN-22::TurboID samples. Error bars represent standard deviation. (B) Bright-field images of wild-type and ptpn-22(S33Stop) worms on control (empty vector) or pat-2 or cap-2 RNAi feeding plates. Blue arrows indicate paralyzed adults; green arrows indicate arrested L1 larvae. (C) Bar graphs show the percentage of paralyzed worms in the indicated RNAi feeding experiments. Fisher’s exact test was used to calculate p-values. Dot plot shows body length measurement of individual worms of the indicated backgrounds on control (empty vector) and pat-2 RNAi feeding plates. Statistical significance was determined using a two-tailed, unpaired t-test. Error bars represent 95% confidence intervals. (D) Bar graphs show the percentage of embryonic lethality in the indicated RNAi feeding experiments. Fisher’s exact test was used to calculate p-values. Error bars represent 95% confidence intervals. ****p < 0.0001. Raw data are available in the S7 File.

Update of

Similar articles

Cited by

References

    1. Aschner Y, Downey GP. The importance of tyrosine phosphorylation control of cellular signaling pathways in respiratory disease: pY and pY not. American Journal of Respiratory Cell and Molecular Biology: American Thoracic Society; 2018. p. 535–47. doi: 10.1165/rcmb.2018-0049TR - DOI - PMC - PubMed
    1. Manning G, Whyte DB, Martinez R, Hunter T, Sudarsanam S. The protein kinase complement of the human genome. Science (New York, NY). 2002;298(5600):1912–34. doi: 10.1126/science.1075762 - DOI - PubMed
    1. Sacco F, Perfetto L, Castagnoli L, Cesareni G. The human phosphatase interactome: An intricate family portrait. FEBS Letters 2012. p. 2732–9. doi: 10.1016/j.febslet.2012.05.008 - DOI - PMC - PubMed
    1. Shu L, Du C, Zuo Y. Abnormal phosphorylation of protein tyrosine in neurodegenerative diseases. Journal of Neuropathology and Experimental Neurology: Oxford University Press; 2023. p. 826–35. - PubMed
    1. Sivaganesh V, Sivaganesh V, Scanlon C, Iskander A, Maher S, Lê T, et al.. Protein tyrosine phosphatases: Mechanisms in cancer. International Journal of Molecular Sciences: MDPI; 2021. - PMC - PubMed

MeSH terms

Substances

LinkOut - more resources