. 2024 Oct:223:108465.
doi: 10.1016/j.visres.2024.108465. Epub 2024 Aug 22.

Acute ocular hypertension in the living human eye: Model description and initial cellular responses to elevated intraocular pressure

Affiliations

Acute ocular hypertension in the living human eye: Model description and initial cellular responses to elevated intraocular pressure

Christopher A Girkin et al. Vision Res. 2024 Oct.

Abstract

This initial methods study presents the initial immunohistochemical and transcriptomic changes in the optic nerve head and retina from three research-consented brain-dead organ donors following prolonged and transient intraocular pressure (IOP) elevation. In this initial study, research-consented brain-dead organ donors were exposed to unilateral elevation of IOP for 7.5 h (Donor 1), 30 h (Donor 2), and 1 h (Donor 3) prior to organ procurement. Optic nerve tissue and retinal tissue was obtained following organ procurement for immunohistological and transcriptomic analysis. Optic nerve sections in Donor 1 exposed to 7.5-hours of unilateral sub-ischemic IOP elevation demonstrated higher levels of protein expression of the astrocytic marker, glial fibrillary acidic protein (GFAP), within the lamina cribrosa with greatest expression inferior temporally in the treated eye compared to control. Spatial transcriptomic analysis performed on optic nerve head tissues from Donor 2 exposed to 30 h of unilateral IOP elevation demonstrated differential transcription of mRNA across laminar and scleral regions. Immunohistochemistry of retinal sections from Donor 2 exhibited higher GFAP and IBA1 expression in the treated eye compared with control, but this was not observed in Donor 3, which was exposed to only 1-hour of IOP elevation. While there were no differences in GFAP protein expression in the retina following the 1-hour IOP elevation in Donor 3, there were higher levels of transcription of GFAP in the inner nuclear layer, and CD44 in the retinal ganglion cell layer, indicative of astrocytic and Müller glial reactivity as well as an early inflammatory response, respectively. We found that transcriptomic differences can be observed across treated and control eyes following unilateral elevation of IOP in brain dead organ donors. The continued development of this model affords the unique opportunity to define the acute mechanotranscriptomic response of the optic nerve head, evaluate the injury and repair mechanisms in the retina in response to IOP elevation, and enable correlation of in vivo imaging and functional testing with ex vivo cellular responses for the first time in the living human eye.

Keywords: Glaucoma; Inflammation; Intraocular pressure; Lamina cribrosa; Optic nerve; Retina macula; Spatial transcriptomics.


Conflict of interest statement

Declaration of competing interest The authors declare that they have no known competing financial interests or personal relationships that could have appeared to influence the work reported in this paper.

Figures
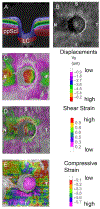
Fig. 1.
Fig. 1.. Axial displacement, shear strain, and compressive strain are greatest in the lamina cribrosa (LC).
Results of in vivo optical coherence tomography (OCT) mechanical testing of the eye exposed to IOP of 30 mmHg for 7.5 hours. A, Custom segmentation layers of the OCT volume by deep learning; LC and peripapillary sclera (ppScl) highlighted. B, En face views of the LC and ppScl surfaces. C, volumetric displacement (Vy) maps. D, shear strain maps. E, compressive strain maps from measurements obtained from the LC and ppScl surface highlighted in A in red. Highest shear strains are in the inferior temporal junction between the LC and ppScl. S, superior; T, temporal; I, inferior; N, nasal.
Fig. 2.
Fig. 2.. Photopic electroretinogram (ERG) traces show selective loss of PhNR wave (arrow) following a prolonged 30 mmHg subischemic intraocular pressure (IOP) elevation.
A, PhNR ERG immediately following 10 mmHg IOP elevation (black). B, PhNR ERG immediately following 30 mmHg IOP elevation (pink), and C, PhNR ERG 4 hours after sustained 30 mmHg elevation (pink, dashed). Reprinted from Exp. Eye Res. 2023 Apr;229:109420, with permission from Elsevier.
Fig. 3.
Fig. 3.. Glial fibrillary acidic protein observed in the human lamina cribosa (LC) following prolonged intraocular pressure elevation.
A-B, En face sections from anterior LC; C-D, posterior LC; A’-D’, insets of boxed areas, respectively were stained for GFAP (green) and DAPI (4’–6-diamidino-2-phenylindole; blue). A-D, Scalebar = 500 μm; A’-D’, Scalebar = 175 μm. S, superior; N, nasal; I, inferior; T, temporal.
Fig. 4.
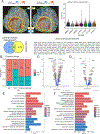
Fig. 4.. 30 hour of elevated intraocular pressure (IOP) induces changes in transcription of genes involved in cellular stress response and cell cycle regulation.
In Donor 2, the left eye was exposed to 30 hours of increased IOP, approximately 30 mmHg. A, Representative images from this donor demonstrating the segmentation of ONH sections to divide posterior lamina cribrosa (PLC), immediate retro lamina (IRL), and sclera based on myelin basic protein (MBP) expression. Spatial distribution of nCount and nFeature (SCT Scaled) with the color scale ranges from blue, indicating lower nCounts or nFeature, through white, representing medium nCounts or nFeature, to red, indicating higher nCounts or nFeature, with corresponding scaled values from 0 to 100. The Venn diagram of overlapping Lamina Cribrosa (GeneCards®) genes (104; blue) with genes in all samples (14,866; yellow), as well as their count distributions (percentage of all the counts/expression belonging to the Lamina Cribrosa (GeneCards®) genes for each spot) in each sample, is shown in a violin plot. B, Plot illustrating the proportion of spots covered by each region on the Visium capture area. C, Volcano plot illustrating differential gene expression in the PLC. D, Volcano plot illustrating differential gene expression in the IRL. E, Gene ontology analysis of top 15 biological processes affected in the PLC. F, Gene ontology analysis of top 15 biological processes affected in the IRL. SVessels = scleral vessels.
Fig. 5.
Fig. 5.. 30 hours, but not 1 hour, of ocular hypertension induces retinal glial reactivity.
Donors 2 (30-hour, 30 mmHg) and Donor 3 (1 hour, 50 mmHg with 7-hour recovery). Immunohistochemistry performed on 5 μm sections using antibodies against glial fibrillary acidic protein (GFAP; green) and ionized calcium binding adaptor molecule 1 (IBA1; red). Nuclei were stained with DAPI (4’–6-diamidino-2-phenylindole; blue). Scalebar = 20 μm. ONL, outer nuclear layer; INL, inner nuclear layer; RGC, retinal ganglion cell layer.
Fig. 6.
Fig. 6.. Glial fibrillary acidic protein (GFAP) transcription in the human macula following exposure to 1 hour of increased intraocular pressure (IOP) to 50 mmHg.
In Donor 3, one eye was exposed to 1 hour of increased IOP at 50 mmHg and GFAP was probed with RNA in situ hybridization in macular sections. A, Quantification of GFAP transcripts across retinal nuclear layers in the macula (error bars represent standard deviation). B, Representative images of GFAP mRNA (white) and the nuclear stain DAPI (4’–6-diamidino-2-phenylindole; blue) for control and treated macular sections. Scalebar = 20 μm. ONL, outer nuclear layer; INL, inner nuclear layer; RGC, retinal ganglion cell layer.
Fig. 7.
Fig. 7.. CD44 transcription in the human macula following exposure to 1 hour of increased intraocular pressure (IOP) to 50 mmHg.
In Donor 3, one eye was exposed to 1 hour of increased IOP at 50 mmHg and CD44 was probed with RNA in situ hybridization in macular sections. A, Quantification of CD44 transcripts across retinal nuclear layers in the macula (error bars represent standard deviation). B, Representative images of CD44 mRNA (white) and the nuclear stain DAPI (4’–6-diamidino-2-phenylindole; blue) for control and treated macular sections. Scalebar = 20 μm. ONL, outer nuclear layer; INL, inner nuclear layer; RGC, retinal ganglion cell layer.

References

    1. Anderson DR, and Hendrickson A (1974). Effect of intraocular pressure on rapid axoplasmic transport in monkey optic nerve. Int Ophthalmol, 13. - PubMed
    1. Bjornson-Hooper ZB, Fragiadakis GK, Spitzer MH, Chen H, Madhireddy D, Hu K, Lundsten K, McIlwain DR, & Nolan GP (2022). A Comprehensive Atlas of Immunological Differences Between Humans, Mice, and Non-Human Primates. Frontiers in Immunology, 13, 867015. 10.3389/fimmu.2022.867015 - DOI - PMC - PubMed
    1. Bouhenni RA, Dunmire J, Sewell A, & Edward DP (2012). Animal models of glaucoma. J Biomed Biotechnol, 2012, 692609. 10.1155/2012/692609 - DOI - PMC - PubMed
    1. Burgoyne CF (2011). A biomechanical paradigm for axonal insult within the optic nerve head in aging and glaucoma. Experimental Eye Research, 93(2), 120–132. 10.1016/j.exer.2010.09.005 - DOI - PMC - PubMed
    1. Chi W, Chen H, Li F, Zhu Y, Yin W, & Zhuo Y (2015). HMGB1 promotes the activation of NLRP3 and caspase-8 inflammasomes via NF-κB pathway in acute glaucoma. Journal of Neuroinflammation, 12(1). 10.1186/s12974-015-0360-2 - DOI - PMC - PubMed

Publication types

Substances

LinkOut - more resources