

Neonatal Adverse Outcomes among Hospital Livebirths in Canada: A National Retrospective Study
- PMID: 39173602
- PMCID: PMC11809516
- DOI: 10.1159/000540559
Neonatal Adverse Outcomes among Hospital Livebirths in Canada: A National Retrospective Study
Abstract
Introduction: In Canada, newborn morbidity far surpasses mortality. The neonatal adverse outcome indicator (NAOI) summarizes neonatal morbidity, but Canadian trend data are lacking.
Methods: This Canada-wide retrospective cross-sectional study included hospital livebirths between 24 and 42 weeks' gestation, from 2013 to 2022. Data were obtained from the Canadian Institute of Health Information's Discharge Abstract Database, excluding Quebec. The NAOI included 15 newborn complications (e.g., birth trauma, intraventricular hemorrhage, or respiratory failure) and seven interventions (e.g., resuscitation by intubation and/or chest compressions), adapted from Australia's NAOI. Rates of NAOI were calculated by gestational age. Unadjusted rate ratios (RR) and 95% confidence interval (CI) were calculated for neonatal mortality, neonatal intensive care unit (NICU) admission, and extended hospital stay, each in relation to the number of NAOI components present (0, 1, 2, 3, 4, or ≥5).
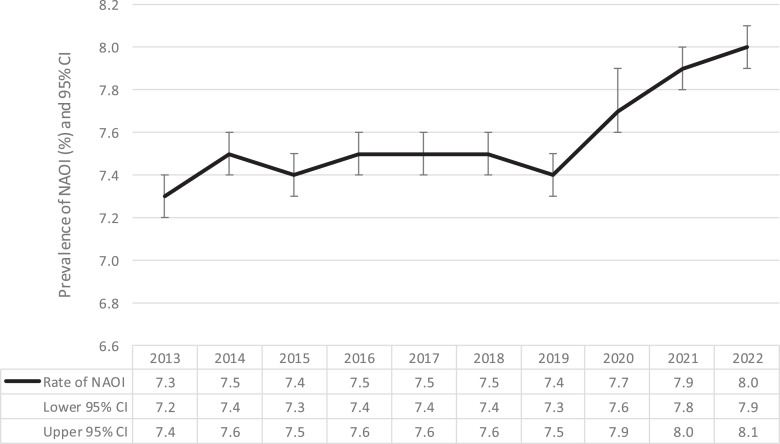
Results: Among 2,821,671 newborns, the NAOI rate was 7.6%. NAOI increased from 7.3% in 2013 to 8.0% in 2022 (p < 0.01). NAOI prevalence was highest in the most preterm infants. Compared to no NAOI, RRs (95% CI) for mortality were 8.5 (7.6-9.5) with 1, 118.1 (108.4-128.4) with 3, and 395.3 (367.2-425.0) with ≥5 NAOI components. Respective RRs for NICU admission were 6.7 (6.6-6.7), 11.2 (10.9-11.3), and 11.9 (11.6-12.2), and RR for extended hospital stay were 6.6 (6.4-6.7), 12.2 (11.7-12.7), and 26.4 (25.2-27.5). International comparison suggested that Canada had a higher prevalence of NAOI.
Conclusion: The Canadian NAOI captures neonatal morbidity using hospitalization data and is associated with neonatal mortality, NICU admission, and extended hospital stay. Newborn morbidity may be on the rise in recent years.
Introduction: In Canada, newborn morbidity far surpasses mortality. The neonatal adverse outcome indicator (NAOI) summarizes neonatal morbidity, but Canadian trend data are lacking.
Methods: This Canada-wide retrospective cross-sectional study included hospital livebirths between 24 and 42 weeks' gestation, from 2013 to 2022. Data were obtained from the Canadian Institute of Health Information's Discharge Abstract Database, excluding Quebec. The NAOI included 15 newborn complications (e.g., birth trauma, intraventricular hemorrhage, or respiratory failure) and seven interventions (e.g., resuscitation by intubation and/or chest compressions), adapted from Australia's NAOI. Rates of NAOI were calculated by gestational age. Unadjusted rate ratios (RR) and 95% confidence interval (CI) were calculated for neonatal mortality, neonatal intensive care unit (NICU) admission, and extended hospital stay, each in relation to the number of NAOI components present (0, 1, 2, 3, 4, or ≥5).
Results: Among 2,821,671 newborns, the NAOI rate was 7.6%. NAOI increased from 7.3% in 2013 to 8.0% in 2022 (p < 0.01). NAOI prevalence was highest in the most preterm infants. Compared to no NAOI, RRs (95% CI) for mortality were 8.5 (7.6-9.5) with 1, 118.1 (108.4-128.4) with 3, and 395.3 (367.2-425.0) with ≥5 NAOI components. Respective RRs for NICU admission were 6.7 (6.6-6.7), 11.2 (10.9-11.3), and 11.9 (11.6-12.2), and RR for extended hospital stay were 6.6 (6.4-6.7), 12.2 (11.7-12.7), and 26.4 (25.2-27.5). International comparison suggested that Canada had a higher prevalence of NAOI.
Conclusion: The Canadian NAOI captures neonatal morbidity using hospitalization data and is associated with neonatal mortality, NICU admission, and extended hospital stay. Newborn morbidity may be on the rise in recent years.
Keywords: Adverse events; Infant; Neonatal morbidity; Neonatal mortality.
© 2024 The Author(s). Published by S. Karger AG, Basel.
Conflict of interest statement
The authors have no conflicts of interest to declare.
Figures
Similar articles
-
Measuring severe neonatal morbidity using hospital discharge data in France.Paediatr Perinat Epidemiol. 2022 Mar;36(2):190-201. doi: 10.1111/ppe.12816. Epub 2021 Nov 19. Paediatr Perinat Epidemiol. 2022. PMID: 34797588
-
Trends in Neonatal Intensive Care Unit Utilization in a Large Integrated Health Care System.JAMA Netw Open. 2020 Jun 1;3(6):e205239. doi: 10.1001/jamanetworkopen.2020.5239. JAMA Netw Open. 2020. PMID: 32556257 Free PMC article.
-
Establishing a composite neonatal adverse outcome indicator using English hospital administrative data.Arch Dis Child Fetal Neonatal Ed. 2019 Sep;104(5):F502-F509. doi: 10.1136/archdischild-2018-315147. Epub 2018 Nov 28. Arch Dis Child Fetal Neonatal Ed. 2019. PMID: 30487299 Free PMC article.
-
Induction of labour at or beyond 37 weeks' gestation.Cochrane Database Syst Rev. 2020 Jul 15;7(7):CD004945. doi: 10.1002/14651858.CD004945.pub5. Cochrane Database Syst Rev. 2020. PMID: 32666584 Free PMC article.
-
Corticosteroids for preventing neonatal respiratory morbidity after elective caesarean section at term.Cochrane Database Syst Rev. 2018 Aug 3;8(8):CD006614. doi: 10.1002/14651858.CD006614.pub3. Cochrane Database Syst Rev. 2018. Update in: Cochrane Database Syst Rev. 2021 Dec 22;12:CD006614. doi: 10.1002/14651858.CD006614.pub4. PMID: 30075059 Free PMC article. Updated.
Cited by
-
Brief Report: Trends of Congenital Syphilis among Neonates in Canada 2012-2023.J Pediatr Clin Pract. 2025 Apr 30;16:200146. doi: 10.1016/j.jpedcp.2025.200146. eCollection 2025 Jun. J Pediatr Clin Pract. 2025. PMID: 40474941 Free PMC article.
-
Maternal Downward Neighborhood Income Mobility and Ensuing Severe Neonatal Morbidity.JAMA Pediatr. 2025 Apr 1;179(4):463-465. doi: 10.1001/jamapediatrics.2024.6667. JAMA Pediatr. 2025. PMID: 39960682 Free PMC article.
-
Severe Neonatal Morbidity Across Gestational Age: Monitoring Infants at High Risk of Mortality.Acta Paediatr. 2025 Aug;114(8):1847-1856. doi: 10.1111/apa.70038. Epub 2025 Feb 24. Acta Paediatr. 2025. PMID: 39989434 Free PMC article.
References
-
- Heaman M, Kingston D, Helewa M, Derksen S, Bogdanovic B, McGowan B. Perinatal services and outcomes in Manitoba. 2012.
-
- Lebreton E, Menguy C, Fresson J, Egorova NN, Crenn Hebert C, Zeitlin J. Measuring severe neonatal morbidity using hospital discharge data in France. Paediatr Perinat Epidemiol. 2022;36(2):190–201. - PubMed
-
- Lain SJ, Algert CS, Nassar N, Bowen JR, Roberts CL. Incidence of severe adverse neonatal outcomes: use of a composite indicator in a population cohort. Matern Child Health J. 2012;16(3):600–8. - PubMed
-
- Public Health Agency of Canada . Perinatal health indicators report. 2008.
MeSH terms
LinkOut - more resources
Full Text Sources
Medical
