. 2024 Sep 5;84(17):3192-3208.e11.
doi: 10.1016/j.molcel.2024.07.032. Epub 2024 Aug 21.

RNA interacts with topoisomerase I to adjust DNA topology

Affiliations

RNA interacts with topoisomerase I to adjust DNA topology

Mannan Bhola et al. Mol Cell. .

Abstract

Topoisomerase I (TOP1) is an essential enzyme that relaxes DNA to prevent and dissipate torsional stress during transcription. However, the mechanisms underlying the regulation of TOP1 activity remain elusive. Using enhanced cross-linking and immunoprecipitation (eCLIP) and ultraviolet-cross-linked RNA immunoprecipitation followed by total RNA sequencing (UV-RIP-seq) in human colon cancer cells along with RNA electrophoretic mobility shift assays (EMSAs), biolayer interferometry (BLI), and in vitro RNA-binding assays, we identify TOP1 as an RNA-binding protein (RBP). We show that TOP1 directly binds RNA in vitro and in cells and that most RNAs bound by TOP1 are mRNAs. Using a TOP1 RNA-binding mutant and topoisomerase cleavage complex sequencing (TOP1cc-seq) to map TOP1 catalytic activity, we reveal that RNA opposes TOP1 activity as RNA polymerase II (RNAPII) commences transcription of active genes. We further demonstrate the inhibitory role of RNA in regulating TOP1 activity by employing DNA supercoiling assays and magnetic tweezers. These findings provide insight into the coordinated actions of RNA and TOP1 in regulating DNA topological stress intrinsic to RNAPII-dependent transcription.

Keywords: DNA supercoiling; RNA-binding protein; TOP1; TOP1 interactome; magnetic tweezers; topology; transcription.


Conflict of interest statement

Declaration of interests E.L.V.N. is co-founder, member of the Board of Directors, on the SAB, equity holder, and paid consultant for Eclipse BioInnovations. E.L.V.N.’s interests have been reviewed and approved by the Baylor College of Medicine in accordance with its conflict-of-interest policies. C.H. is a scientific founder, a member of the scientific advisory board and equity holder of Aferna Bio, Inc. and Ellis Bio Inc., a scientific co-founder and equity holder of Accent Therapeutics, Inc., and a member of the scientific advisory board of Rona Therapeutics and Element Biosciences.

Figures

Figure 1.
Figure 1.. TOP1 enzymatic activity is enriched at active enhancers and gene loci in colon cancer cells.
(A) Metaplot of TOP1cc-seq signal across protein coding genes in SW480 cells. TOP1cc-seq signal is represented as log2-transformed fold change of bins per million (BPM) over Input and spans 3 kb upstream to the TSS and 3 kb downstream to the TES. (B) Heatmaps and metaplots of TOP1cc enrichment at (left) protein coding genes and (right) enhancers (centered on PRO-seq peaks) with low, medium, and high PRO-seq signal in SW480 cells. TOP1cc signal is represented as log2-transformed fold change of BPM over Input and spans 3 kb upstream of the TSS and 3 kb downstream of the TES and ± 3 kb centered on PRO-seq peaks. (C) IGV tracks for TOP1cc, H3K27ac, H3K4me1, and PRO-seq signals at (top) XPO1 gene locus and (bottom) the MYC enhancer in SW480 cells. TOP1cc, H3K27ac, H3K4me1 signal is represented as log2-transformed fold change of BPM over Input. PRO-seq signal is represented as Reads Per Kilobase Million (RPKM). The blue shaded region denotes the XPO1 promoter and MYC enhancer. The analyzed coordinates are shown. (D) TOP1cc-qPCR analyses of IgG and TOP1cc enrichment at (left) XPO1 gene promoter and (right) MYC enhancer in SW480 cells. Data represents the mean and s.e.m. of three independent replicates. Statistical significance was determined by one-tailed Student’s t test. p-value=0.0109 at XPO1 promoter and p-value=0.0037 at MYC enhancer. See also Figure S1.
Figure 2.
Figure 2.. Identification of the TOP1 interactome.
(A) Immunoblot analysis of TOP1 from the 25 collected fractions following sucrose density ultracentrifugation in SW480 cells. A representative image is shown that is representative of three independent experiments. (B) STRING analysis69 of 54 proteins identified by TOP1 IP followed by MS in SW480 cells. All proteins are visualized as nodes with the weight of the edges connecting the nodes indicating the confidence of the interactions. The PPI enrichment is p-value<1.0 e−16. The TOP1-associating proteins present in the most significant GO class that includes RNA binding are shown in red. (C) Bar graphs depicting the 10 most significantly enriched molecular processes (FDR < 0.05) from GO in order of increasing FDR for the proteins identified in Figure 2B. See also Supplementary Table S1.
Figure 3.
Figure 3.. TOP1 is an RBP associated with a broad array of RNAs.
(A) Scatterplot of the TOP1 eCLIP read density (as log normalized RPKM) across two biological replicates. Pearson's correlation is 1.00. (B) Pie chart depicting the different types of RNA species identified by TOP1 eCLIP (n=997) in two independent replicates. TOP1 eCLIP signal was normalized over IgG eCLIP signal (q-value≤0.05 and log2FC≥0.58). eRNAs were identified by overlapping the eCLIP peaks with 7,843 enhancers identified in SW480 cells (Figure S1A). (C) Scatterplot of the TOP1 UV-RIP-seq read density (as log normalized RPKM) across two biological replicates. Pearson's correlation is 0.98. (D) Pie chart depicting the number and type of RNA species identified by TOP1 UV-RIP-seq (n=2,667) in two independent replicates. TOP1 UV-RIP-seq signal was normalized over IgG UV-RIP-seq signal (q-value≤0.05 and log2FC≥0.58). eRNAs were identified by overlapping the UV-RIP-seq peaks with 7,843 enhancers identified in SW480 cells (Figure S1A). (E) IGV tracks for log2 ratio of TOP1 eCLIP and TOP1 UV-RIP-seq signal (RPKM) over IgG (RPKM) at NOTCH1, ADRM1, and CAD gene loci in SW480 cells. The genome coordinates for each region are shown. (F) Bar graphs depicting the 10 most significant (p-value<0.05) enriched MSigDB pathways in Enrichr70 shown in order of decreasing −log10 p-value for the TOP1-associating mRNAs identified by eCLIP (left, n=636 mRNAs) and UV-RIP-seq (right, n=1,995 mRNAs). See also Figure S2, and Supplementary Tables S2 and S3.
Figure 4.
Figure 4.. TOP1 directly binds RNA.
(A) In vitro pull down of in vitro-transcribed 45S rRNA, CCL2 eRNA, MMP9 eRNA, MYC eRNA, and tRNA with FLAG-tagged TOP1 protein as revealed by SYBR Gold staining. A representative image of three independent experiments is shown. (B) EMSA performed with in vitro transcribed and refolded 32P-labeled PNP mRNA (left) and ACSL1 mRNA (right) and titrations (0, 31.25, 62.5, and 125 nM) of recombinant TOP1 protein. Probe length: PNP mRNA=230 bp, ACSL1 mRNA=130 bp. A representative image of three independent experiments is shown. (C) EMSA performed with in vitro transcribed and refolded 32P-labeled PNP ssRNA and PNP dsRNA and titrations (0, 31.25, 62.5, and 125 nM) of recombinant TOP1 protein. A representative image of three independent experiments is shown. (D) EMSA performed with MMP9 dsDNA or in vitro transcribed and refolded 32P-labeled MMP9 eRNA and titrations (0, 62.5, 125, and 250 nM) of recombinant TOP1 protein. Probe length: MMP9 eRNA=260 bp, MMP9 dsDNA=260 bp. A representative image of three independent experiments is shown. The quantification of the three independent autoradiograms is shown. (E) Binding analysis of TOP1 to immobilized biotin-labeled (top) MYC dsDNA and (bottom) in vitro transcribed and refolded MYC eRNA as measured in binding response (nm) by BLI. Representative sensorgrams were obtained from injections of 0.10, 0.25, 0.5, 0.75, and 1.0 μM of TOP1. The KD of three independent experiments is shown. See also Figure S3 and Supplementary Table S4.
Figure 5.
Figure 5.. TOP1 catalytic activity is modulated by RNA in vitro.
(A) Plasmid relaxation assay with TOP1 pre-incubated with 2nM plasmid DNA for 5 min. followed by the addition of increasing amounts (2, 5, 10, 20, and 40 nM) of in vitro transcribed and refolded MYC eRNA, (B) ACSL1 mRNA, or (C) tRNA. Samples were subjected to 0.8% agarose gel electrophoresis and visualized by staining with ethidium bromide after running the gel. A representative image of three independent experiments is shown. (D), (E), and (F) Single-molecule TOP1 relaxation assays in the absence (D) or presence of MYC eRNA (E), or tRNA (F). All experiments were performed at 25°C and 0.5 pN force with the measurements denoted in each subpanel and the 10-point moving average is shown in red. See also Figure S4 and Supplementary Table S4.
Figure 6.
Figure 6.. TOP1-RNA interactions inhibit TOP1 DNA relaxation across protein coding genes.
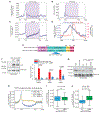
(A) Metaplot of TOP1cc signal at 636 mRNAs that were identified to significantly interact with TOP1 in the TOP1 eCLIP experiment (Figure 3B) in SW480 cells. The TOP1cc-seq signal is represented as log2-transformed fold change of BPM over Input. The purple area represents the coding region between the TSS and TES. (B) Metaplot of PRO-seq signal represented as RPKM and spans 3 kb upstream of the TSS and 3 kb downstream of the TES. (C) Metaplot of eCLIP signal represented as log2-transformed fold change of RPKM over IgG and spans 3 kb upstream of the TSS and 3 kb downstream of the TES. (D) A metaplot focused on the TOP1cc and eCLIP signal 0.5 kb upstream and 0.5 kb downstream of the TSS at the 636 mRNAs eCLIP targets. (E) Schematic of TOP1 constructs including TOP1 WT and TOP1 ΔRBR expressed in SW480 cells for UV-RIP-qPCR as shown in panel (F). TOP1 RNA binding region was determined by RBR-ID in K562 cell line51 to be in the TOP1 core domain (392 to 400 aa, VPSPPPGHK) as denoted. (F) (left) Immunoblot analysis of TOP1 and beta-actin in SW480 cells expressing an pcDNA3.1 (empty vector, EV) or plasmids expressing N-terminal GFP-FLAG-TOP1 WT or GFP-FLAG-TOP1 ΔRBR. A representative image is shown from at least three independent experiments that were performed. (right) qRT-PCR analysis of NOTCH1, CAD and TK1 mRNAs following UV-RIP-qPCR with GFP antibody and cell lysates prepared from SW480 cells transfected with EV or plasmids expressing N-terminal GFP-FLAG-TOP1 WT or GFP-FLAG-TOP1 ΔRBR. Enrichment levels for each IP are relative to the levels of EV. Data represents the mean and s.e.m. that are representative of at least three independent experiments. Statistical significance was determined by one-tailed Student’s t test. NOTCH1 mRNA p-value=0.0032, CAD mRNA p-value=0.0012, and TK1 mRNA p-value=0.0243. (G) (right) Immunoblot analysis of TOP1 and beta-actin in SW480 cells stably expressing TOP1 shRNA and transfected with EV control or shRNA-resistant GFP-FLAG-TOP1 WT or GFP-FLAG-TOP1 ΔRBR. SW480 expressing scramble shRNA which doesn’t target genes was used as positive control. A representative image of three independent experiments is shown. (H) Metaplot analysis of GFP-FLAG-TOP1 WT and GFP-FLAG-TOP1 ΔRBR TOP1cc-seq signal at (n=3,787) protein coding genes. GFP-FLAG-TOP1cc-seq signal is represented as log2-transformed fold change of BPM over Input and spans 3 kb upstream of the TSS and 3 kb downstream of the TES. (I) Box plot showing the log2-transformed fold change (GFP-FLAG-TOP1cc/input) at promoters (+/−0.5 kb of TSS) pertaining to the genes analyzed in (H). Statistical significance was determined by Wilcoxon rank-sum test. (J) Box plot showing the log2-transformed fold change (GFP-FLAG-TOP1cc/input) at CDS regions pertaining to the genes analyzed in (H). Statistical significance was determined by Wilcoxon rank-sum test. See also Figure S5 and Supplementary Table S4.
Figure 7.
Figure 7.. Model for how TOP1-RNA Interactions Regulate TOP1 Activity During RNAPII Transcription.
We propose a model in which TOP1 activity is enriched in the promoter regions and reduced within the bodies of actively transcribed genes. This dichotomy of TOP1 activity is consistent with TOP1 principally operating to relax negative supercoils associated with the regulation of PIC formation and transcription initiation and to a lesser extent to relax transcription-coupled torsional stress. RNA through TOP1-RNA interactions is specifically required for the negative tuning of TOP1 activity over gene bodies. The contributions of RNAPII were not examined in this study but it was included in the model since RNAPII could also contribute to TOP1 recruitment and activity7. See Discussion for details. The TOP1 and RNAPII proteins in the model are adapted from PDB: 1A36, 8H0V.

References

    1. Merino A, Madden KR, Lane WS, Champoux JJ, and Reinberg D (1993). DNA topoisomerase I is involved in both repression and activation of transcription. Nature 365, 227–232. 10.1038/365227a0. - DOI - PubMed
    1. Shykind BM, Kim J, Stewart L, Champoux JJ, and Sharp PA (1997). Topoisomerase I enhances TFIID-TFIIA complex assembly during activation of transcription. Genes Dev 11, 397–407. 10.1101/gad.11.3.397. - DOI - PubMed
    1. Durand-Dubief M, Persson J, Norman U, Hartsuiker E, and Ekwall K (2010). Topoisomerase I regulates open chromatin and controls gene expression in vivo. EMBO J 29, 2126–2134. 10.1038/emboj.2010.109. - DOI - PMC - PubMed
    1. Kouzine F, Gupta A, Baranello L, Wojtowicz D, Ben-Aissa K, Liu J, Przytycka TM, and Levens D (2013). Transcription-dependent dynamic supercoiling is a short-range genomic force. Nat Struct Mol Biol 20, 396–403. 10.1038/nsmb.2517. - DOI - PMC - PubMed
    1. Pedersen JM, Fredsoe J, Roedgaard M, Andreasen L, Mundbjerg K, Kruhoffer M, Brinch M, Schierup MH, Bjergbaek L, and Andersen AH (2012). DNA Topoisomerases maintain promoters in a state competent for transcriptional activation in Saccharomyces cerevisiae. PLoS Genet 8, e1003128. 10.1371/journal.pgen.1003128. - DOI - PMC - PubMed

MeSH terms