. 2025 Jan;82(1):120-133.
doi: 10.1016/j.jhep.2024.07.034. Epub 2024 Aug 22.

Targeting the liver clock improves fibrosis by restoring TGF-β signaling

Affiliations

Targeting the liver clock improves fibrosis by restoring TGF-β signaling

Emilie Crouchet et al. J Hepatol. 2025 Jan.

Abstract

Background & aims: Liver fibrosis is the major driver of hepatocellular carcinoma and liver disease-related death. Approved antifibrotic therapies are absent and compounds in development have limited efficacy. Increased TGF-β signaling drives collagen deposition by hepatic stellate cells (HSCs)/myofibroblasts. Here, we aimed to dissect the role of the circadian clock (CC) in controlling TGF-β signaling and liver fibrosis.

Methods: Using CC-mutant mice, enriched HSCs and myofibroblasts obtained from healthy and fibrotic mice in different CC phases and loss-of-function studies in human hepatocytes and myofibroblasts, we investigated the relationship between CC and TGF-β signaling. We explored hepatocyte-myofibroblast communication through bioinformatic analyses of single-nuclei transcriptomes and performed validation in cell-based models. Using mouse models for MASH (metabolic dysfunction-associated steatohepatitis)-related fibrosis and spheroids from patients with liver disease, we performed proof-of-concept studies to validate pharmacological targetability and clinical translatability.

Results: We discovered that the CC oscillator temporally gates TGF-β signaling and this regulation is broken in fibrosis. We demonstrate that HSCs and myofibroblasts contain a functional CC with rhythmic expression of numerous genes, including fibrogenic genes. Perturbation studies in hepatocytes and myofibroblasts revealed a reciprocal relationship between TGF-β activation and CC perturbation, which was confirmed in patient-derived ex vivo and in vivo models. Pharmacological modulation of CC-TGF-β signaling inhibited fibrosis in mouse models in vivo as well as in patient-derived liver spheroids.

Conclusion: The CC regulates TGF-β signaling, and the breakdown of this control is associated with liver fibrosis in patients. Pharmacological proof-of-concept studies across different models have uncovered the CC as a novel therapeutic target for liver fibrosis - a growing unmet medical need.

Impact and implications: Liver fibrosis due to metabolic diseases is a global health challenge. Many liver functions are rhythmic throughout the day, being controlled by the circadian clock (CC). Here we demonstrate that regulation of the CC is perturbed upon chronic liver injury and this perturbation contributes to fibrotic disease. By showing that a compound targeting the CC improves liver fibrosis in patient-derived models, this study provides a novel therapeutic candidate strategy to treat fibrosis in patients. Additional studies will be needed for clinical translation. Since the findings uncover a previously undiscovered profibrotic mechanism and therapeutic target, the study is of interest for scientists investigating liver disease, clinical hepatologists and drug developers.

Keywords: Liver disease; MASLD; circadian clock; drug discovery; hepatic stellate cells; transcriptional regulation.


Conflict of interest statement

Conflict of interest: The authors declare no conflict of interest. Please refer to the accompanying ICMJE disclosure forms for further details.

Figures

Fig. 1
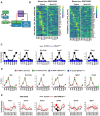
Fig. 1. TGF-β signaling-related genes display circadian rhythmicity in the mouse liver.
(A) Model of the CC-oscillator. (B) Heatmaps showing expression of HALLMARK TGF-β gene sets (left panel) and murine orthologs of human HSC-specific genes[9] (right panel) in liver of control and Bmal1 KO mice (GSE135898)[6]. (C) Normalized transcripts levels of indicated genes in liver of control and Bmal1hep-/- mice[10]. (D) ChIP-qPCR of indicated genes using control and Bmal1hep-/- liver[10] and indicated antibodies. (E) Normalized expression of indicated genes in control and Rev-Erbα/βhep-/- liver (GSE143528)[11]. Data are expressed as mean ±SD. Fig. 1C, D were performed from same control and Bmal1hep-/- mice. 3 mice/ time-point/group. Fig. 1C, D: Unpaired student’s T-test; bold dots: p < 0.05. Fig. 1E: Wald test and Benjamini-Hochberg correction; bold dots: FDR<0.05. Refer to Tables S1 and S2.
Fig. 2
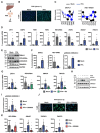
Fig. 2. FFA-drives CC-perturbation and induces TGF-β pathway gene expression in primary human hepatocytes (PHH).
(A) PHH were isolated from non-diseased patient livers and treated with FFA. (B) BODIPY staining confirms lipid accumulation in FFA-treated PHH. Green = neutral lipids. Blue = DAPI. The pictures show representative image (magnification X10). (C-D) FFA treatment perturbs CC gene expression and rhythmicity in PHH. (C) The graphs show relative gene expression of BMAL1 and REV-ERBA from synchronized PHH (low glucose) post-FFA treatment. One representative experiment out of 2 is shown. Unpaired student’s T-test; bold dots represent p < 0.05. (D) The graphs show means ± SD of % of mRNA normalized to GAPDH (mock = 100%) from 3 experiments performed in triplicate (n =9). *p<0.05, **p<0.01, ***p<0.001, Mann-Whitney U test. (E-F) FFA treatment dysregulated CC and activates TGF-β signaling in PHH. One representative experiment in duplicate out of two if shown (see Fig S.17). Quantification of Western blot analysis was performed using ImageLab. *** p < 0.001 (Unpaired student’s T test) (G) TGF-β inhibitor reverts FFA-induced dysregulations in PHH. The graphs show mean ± SD of % of mRNA normalized to GAPDH (mock = 100%) from 3 experiments performed in triplicate (n = 9) *, # p<0.05, **, ## p<0.01, ***, ### p<0.001 Kruskal-Wallis followed by Dunn’s multiple comparison tests (FFA VS mock or FFA-SB VS FFA). (H-K) Perturbation studies in PHH using the REV-ERBα agonist SR9009. (H-I) One representative experiment in duplicate out of two is shown (see Fig S.18). Quantification of Western blot analysis was performed using ImageLab. # or * p < 0.05 (One way ANOVA followed by Tukey’s multiple comparisons tests). (J) BODIPY staining in PHH (magnification X10). (K) SR9009 restores FFA-induces dysregulation of CC gene expression. PHH were treated with FFA and SR9009 or DMSO as control. The graphs show mean ± SD of % of mRNA normalized to GAPDH (mock = 100%) from 3 experiments performed in triplicate (n = 9) *, # p<0.05, **, ## p<0.01, ***, ### p<0.001 Kruskal-Wallis followed by Dunn’s multiple comparison tests (FFA VS mock or FFA SR9009 VS FFA).
Fig. 3
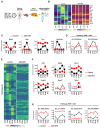
Fig. 3. Diurnal rhythmicity of gene expression is lost in hepatic stellate cells (HSCs) during fibrosis in vivo.
(A) Experimental approach showing HSC and MF isolation from mouse livers at different time points from control (chow diet) or CDA-HFD animals (n = 3 animals per group/time-point). (B-H) Diurnal rhythmicity of gene expression is lost in HSC/MF during MASH in vivo. (B) Heatmap and (C) normalized expression levels of indicated CC-genes in control and CDA-HFD HSCs/MFs (D) Status of circadian pathways (FDR < 0.05) in control and CDA-HFD HSC/MF (E) Heatmap of circadian genes expression in control and CDA-HFD HSC/MF. (F) Pathways enriched (FDR < 0.05) for circadian genes in control HSC. (G) Circadian enrichments of indicated pathways (FDR < 0.05) in control and CDA-HFD HSC. Panels CG: Wald test and Benjamini-Hochberg correction; bold dots: FDR < 0.05. Refer to Tables S1 to S7. (A) Perturbation of CC in LX2 stellate cells induces an increase in fibrotic gene expression. REV-ERBA KO LX2 stellate cells were generated and synchronized. The graphs show mean ± SD of relative mRNA expression normalized to GAPDH mRNA. One representative experiment out of 3 performed in triplicate is shown (see Figure S12-13). (B) HLMF were isolated from patient liver tissues and exposed to FFA. (C-D) FFA treatment perturbs CC gene expression in HLMF and induces fibrotic gene expression. The graphs show means ± SD of % of mRNA normalized to GAPDH (mock = 100%) from 3 experiments performed in triplicate (n =9). *p<0.05, **p<0.01, ***p<0.001, Mann-Whitney U test. (E) Perturbation of CC and fibrotic gene expression are reversed by the TGFβ inhibitor SB505124. The graphs show mean ± SD of % of mRNA normalized to GAPDH (mock = 100%) from 3 experiments performed in triplicate (n = 9) *, # p<0.05, **, ## p<0.01,***, ### p<0.001 Kruskal-Wallis followed by Dunn’s multiple comparison tests (TGFβ VS mock or TGFβ +SB VS TGFβ). (G) SR9009 inhibits TGF-β signaling in HLMFs. One representative experiment out of two if shown (see Fig S.19). Quantification of Western blot analysis was performed using ImageLab.
Fig. 4
Fig. 4. SR9009 inhibits fibrotic gene expression in human liver myofibroblasts (HLMF).
(A) Perturbation of CC in LX2 stellate cells induces an increase in fibrotic gene expression. REV-ERBA KO LX2 stellate cells were generated and synchronized. The graphs show mean ± SD of relative mRNA expression normalized to GAPDH mRNA. One representative experiment out of 3 performed in triplicate is shown (see Figure S12-13). (B) HLMF were isolated from patient liver tissues and exposed to FFA. (C-D) FFA treatment perturbs CC gene expression in HLMF and induces fibrotic gene expression. The graphs show means ± SD of % of mRNA normalized to GAPDH (mock = 100%) from 3 experiments performed in triplicate (n =9). *p<0.05, **p<0.01, ***p<0.001, Mann-Whitney U test. (E) Perturbation of CC and fibrotic gene expression are reversed by the TGFβ inhibitor SB505124. The graphs show mean ± SD of % of mRNA normalized to GAPDH (mock = 100%) from 3 experiments performed in triplicate (n = 9) *, # p<0.05, **, ## p<0.01,***, ### p<0.001 Kruskal-Wallis followed by Dunn’s multiple comparison tests (TGFβ VS mock or TGFβ +SB VS TGFβ). (G) SR9009 inhibits TGF-β signaling in HLMFs. One representative experiment out of two if shown (see Fig S.19). Quantification of Western blot analysis was performed using ImageLab.
Fig. 5
Fig. 5. Crosstalk and communication of the hepatocyte circadian clock (CC) with HLMF
(A) Volcano plot showing differential expression of genes in HSC of control and hepatocyte-specific Rev-Erbα/β knock-out (Rev-Erbα/βhep-/-; LDKO)[11] mice. (B) UMAPs showing expression of Mlxipl in different cell types of liver in control and LDKO mice. Black arrow = Mlxipl expression in HSC. (C-E) PHH-HLMF co-culture model showing that the perturbation of the hepatocyte CC modulates the HLMF phenotype. (C) Experimental approach (see method) (D-E) The graphs show means ± SD of % of mRNA normalized to GAPDH (mock = 100%) from 2 experiments performed in triplicate (n = 6). *p<0.05, **p<0.01, Mann-Whitney U test. Refer to Tables S8.
Fig. 6
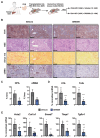
Fig. 6. REV-ERBs agonist SR9009 inhibits liver fibrosis progression in a MASH fibrosis model in vivo.
(A) Study design. Male C57Bl/6 mice fed with standard chow diet or choline-deficient, L-amino acid-defined, high-fat diet (CDA-HFD) for 12 weeks. Animals received vehicle control or SR9009 for 6 weeks. Chow diet n=10; CDA-HFD + vehicle n=15; CDA-HFD + SR9009 n=14. (B) Target engagement assay. SR9009 treatment efficacy was confirmed by the decrease in Bmal1 and Clock expression, the downstream target of Rev-Erba. (C-E) SR9009 treatment improves liver fibrosis. (C) Representative stainings for hematoxylin & eosin (H&E), Sirius red and Oil Red O are shown (scale bar = 100 µm). Fibrosis levels were evaluated by (D) quantitative digital analysis (collagen proportional area, CPA), hydroxyproline quantification and (E) fibrotic gene expression measurement. (F) Lipid accumulation by Oil Red O staining quantification. (G) SR9009 treatment reduced expression of Il1 and Tnfa in mouse liver. The graphs show mean ±SD of % area, µg/mg of tissues or relative mRNA expression normalized to GAPDH mRNA. *, # p<0.05, **, ## p<0.01,***, ### p<0.001, ****, #### <0.0001 (vehicle vs. chow or SR9009 vs. vehicle) Mann-Whitney U test. (H-I) CIBERSORTx -pathway analyses on mouse liver RNA-Seq was used to predict (H) overall liver cell type abundances and (I) hepatocyte CC gene expression in the indicated study groups. Refer to Tables S9 and S10.
Fig. 7
Fig. 7. SR9009 inhibits fibrosis in human liver chimeric mice (HLCM).
(A) Study design. FRG-NOD mice were engrafted with PHH to generate HLCM (see method) and subjected to CDA-HFD for 12 weeks. Animals received vehicle control or SR9009 for 4 weeks. CDA-HFD + Vehicle n = 3; CDA-HFD + SR9009 n = 4. (B-D) SR9009 treatment improves liver fibrosis in HLCM. (B) Representative staining images for hematoxylin & eosin (H&E), Sirius red, Fumarylacetoacetate Hydrolase (FAH) and alpha smooth muscle actin (aSMA) are shown (scale bar = 500 µm). Fibrosis levels were evaluated by (C) quantitative digital analysis (collagen proportional area, CPA) and aSMA quantification (% of area) and (D) fibrotic gene expression measurement. (E) SR9009 treatment reduces liver inflammation. The graphs show mean ± SD of % area or relative mRNA expression normalized to GAPDH mRNA. *p<0.05, **p<0.01, ***p<0.001, Mann-Whitney U test.
Fig. 8
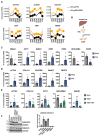
Fig. 8. Expression of CC-genes in MASH patients and pharmacological targeting of the CC in patient liver spheroids.
(A) Transcript levels of indicated CC-genes in patient livers (GSE126848)[22]. Wilcoxon test; *p<0.05, **p<0.01 *** p < 0.001 and **** p < 0.0001. (B) Transcript levels of indicated CC-genes in the liver of patients with varying levels of fibrosis, as indicated (GSE135251)[23]. Wilcoxon test; *p<0.05, **p<0.01. (B-C) SR9009 treatment restores TGF-β induced-CC and pro-fibrotic gene perturbations in patient derived spheroids. (B) Multicellular liver spheroids were generated from patient liver tissue and treated with TGF-β and SR9009 or DMSO treatment The graphs show mean ± SD of % of mRNA normalized to GAPDH (mock = 100%) from 2 experiments performed in triplicate (n = 6). *p<0.05, **p<0.01, ***p<0.001 1 Kruskal-Wallis followed by Dunn’s multiple comparison tests. (C) Multicellular liver spheroids were generated from cirrhotic liver tissue and treated with SR9009 or DMSO. The graphs show mean ± SD of mRNA normalized to GAPDH from 1 experiment performed in triplicate (n = 3).

References

    1. Hagström H, Nasr P, Ekstedt M, et al. Fibrosis stage but not NASH predicts mortality and time to development of severe liver disease in biopsy-proven NAFLD. J Hepatol. 2017;67:1265–73. - PubMed
    1. Roehlen N, Crouchet E, Baumert TF. Liver Fibrosis: Mechanistic Concepts and Therapeutic Perspectives. Cells. 2020;9(4):875. doi: 10.3390/cells9040875. - DOI - PMC - PubMed
    1. Friedman SL, Pinzani M. Hepatic fibrosis 2022: Unmet needs and a blueprint for the future. Hepatology. 2022;75:473–88. doi: 10.1002/hep.32285. - DOI - PMC - PubMed
    1. Sanyal AJ, Van Natta ML, Clark J, et al. Prospective Study of Outcomes in Adults with Nonalcoholic Fatty Liver Disease. N Engl J Med. 2021;385:1559–69. doi: 10.1056/NEJMoa2029349. - DOI - PMC - PubMed
    1. Mukherji A, Bailey SM, Staels B, et al. The circadian clock and liver function in health and disease. J Hepatol. 2019;71:200–11. doi: 10.1016/j.jhep.2019.03.020. - DOI - PMC - PubMed

Substances