. 2024 Aug 22;15(1):7233.
doi: 10.1038/s41467-024-50873-1.

Unravelling large-scale patterns and drivers of biodiversity in dry rivers

Arnaud Foulquier  1 Thibault Datry  2 Roland Corti  2 Daniel von Schiller  3 Klement Tockner  4   5 Rachel Stubbington  6 Mark O Gessner  7   8 Frédéric Boyer  9 Marc Ohlmann  9 Wilfried Thuiller  9 Delphine Rioux  9 Christian Miquel  9 Ricardo Albariño  10 Daniel C Allen  11 Florian Altermatt  12 Maria Isabel Arce  8   13 Shai Arnon  14 Damien Banas  15 Andy Banegas-Medina  16 Erin Beller  17 Melanie L Blanchette  18 Joanna Blessing  19 Iola Gonçalves Boëchat  20 Kate Boersma  21 Michael Bogan  22 Núria Bonada  23 Nick Bond  24 Katherine Brintrup  25 Andreas Bruder  26 Ryan Burrows  27 Tommaso Cancellario  28 Cristina Canhoto  29 Stephanie Carlson  30 Núria Cid  23   31 Julien Cornut  32 Michael Danger  32 Bianca de Freitas Terra  33 Anna Maria De Girolamo  34 Rubén Del Campo  35 Verónica Díaz Villanueva  10 Fiona Dyer  36 Arturo Elosegi  37 Catherine Febria  38 Ricardo Figueroa Jara  39 Brian Four  40 Sarig Gafny  41 Rosa Gómez  13 Lluís Gómez-Gener  42 Simone Guareschi  43 Björn Gücker  20 Jason Hwan  44 J Iwan Jones  45 Patrick S Kubheka  46 Alex Laini  43 Simone Daniela Langhans  47 Bertrand Launay  2 Guillaume Le Goff  2 Catherine Leigh  48 Chelsea Little  12   49 Stefan Lorenz  50 Jonathan Marshall  19   51 Eduardo J Martin Sanz  52 Angus McIntosh  53 Clara Mendoza-Lera  54 Elisabeth I Meyer  55 Marko Miliša  56 Musa C Mlambo  57 Manuela Morais  58 Nabor Moya  59 Peter Negus  19 Dev Niyogi  60 Iluminada Pagán  61 Athina Papatheodoulou  62 Giuseppe Pappagallo  34 Isabel Pardo  63 Petr Pařil  64 Steffen U Pauls  65 Marek Polášek  64 Pablo Rodríguez-Lozano  66 Robert J Rolls  67 Maria Mar Sánchez-Montoya  68 Ana Savić  69 Oleksandra Shumilova  70 Kandikere R Sridhar  71 Alisha Steward  19   51 Amina Taleb  72 Avi Uzan  73 Yefrin Valladares  74 Ross Vander Vorste  75 Nathan J Waltham  76 Dominik H Zak  77 Annamaria Zoppini  34
Affiliations

Unravelling large-scale patterns and drivers of biodiversity in dry rivers

Arnaud Foulquier et al. Nat Commun. .

Abstract

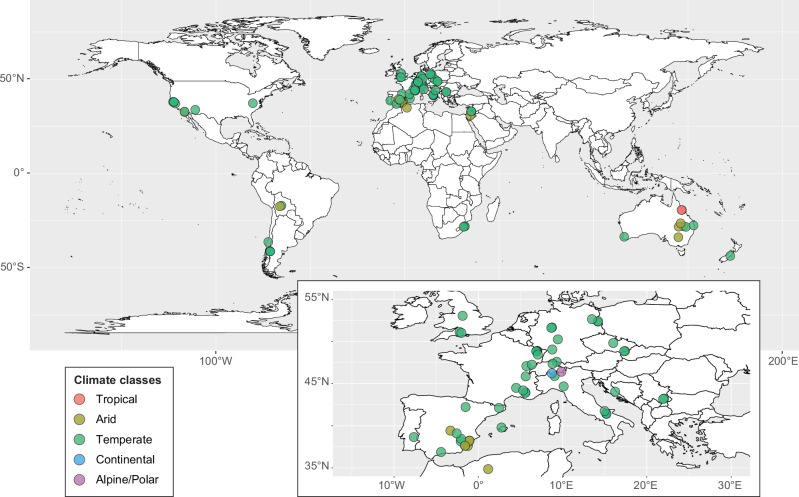
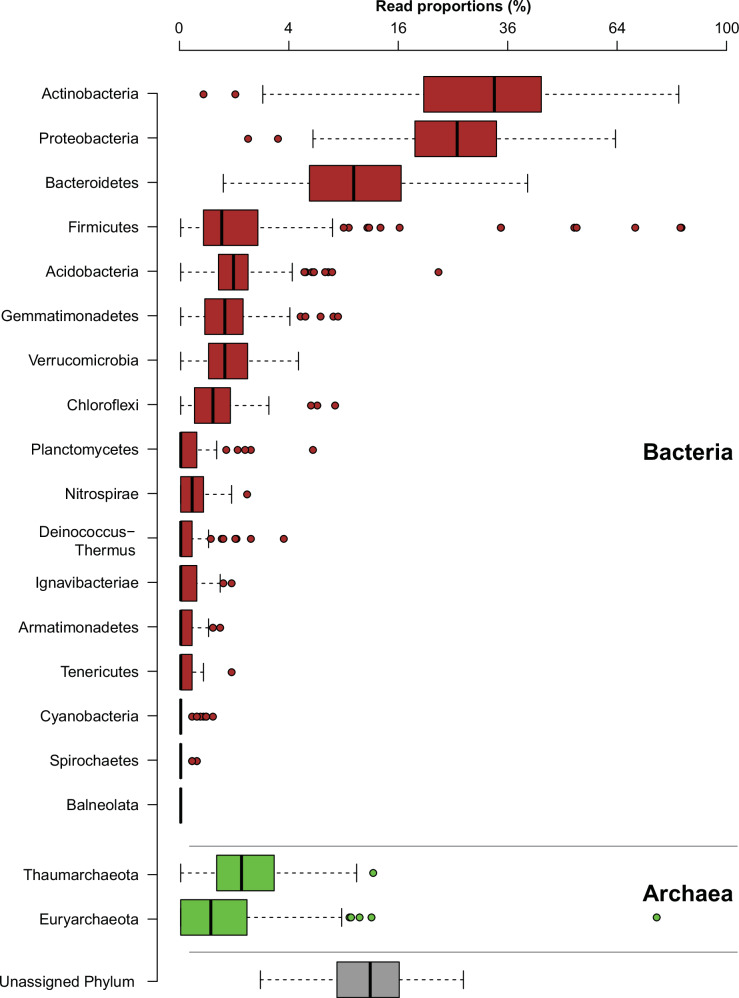
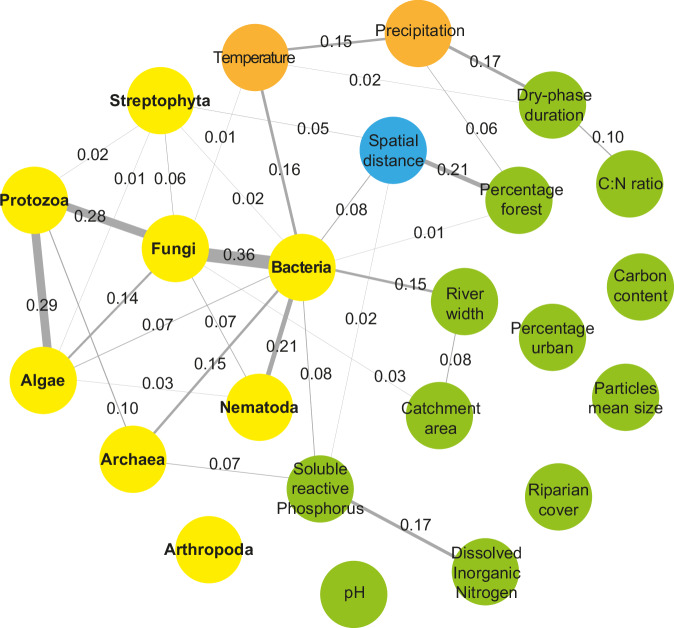
More than half of the world's rivers dry up periodically, but our understanding of the biological communities in dry riverbeds remains limited. Specifically, the roles of dispersal, environmental filtering and biotic interactions in driving biodiversity in dry rivers are poorly understood. Here, we conduct a large-scale coordinated survey of patterns and drivers of biodiversity in dry riverbeds. We focus on eight major taxa, including microorganisms, invertebrates and plants: Algae, Archaea, Bacteria, Fungi, Protozoa, Arthropods, Nematodes and Streptophyta. We use environmental DNA metabarcoding to assess biodiversity in dry sediments collected over a 1-year period from 84 non-perennial rivers across 19 countries on four continents. Both direct factors, such as nutrient and carbon availability, and indirect factors such as climate influence the local biodiversity of most taxa. Limited resource availability and prolonged dry phases favor oligotrophic microbial taxa. Co-variation among taxa, particularly Bacteria, Fungi, Algae and Protozoa, explain more spatial variation in community composition than dispersal or environmental gradients. This finding suggests that biotic interactions or unmeasured ecological and evolutionary factors may strongly influence communities during dry phases, altering biodiversity responses to global changes.


Conflict of interest statement

The authors declare no competing interests.

Figures

Fig. 1
Fig. 1. Location of 84 dry-riverbed sampling sites and their Köppen climate class.
The inset illustrates site locations within the most densely sampled area.
Fig. 2
Fig. 2. Composition of Bacteria and Archaea communities in dry riverbed sediments (n = 84).
Read proportions (square root scale) correspond to the relative abundance of each taxon per sample and were estimated using the 16S marker dataset rarefied to 2311 reads per sample. The vertical bold line within the box represents the median. The upper and lower limits of the box represent the 75th and 25th percentiles. Horizontal dotted lines indicate the range of observed values within 1.5× the interquartile range from the 75th and 25th percentiles. Values outside this range were considered outliers and are indicated as points. Source data are provided as a Source Data file.
Fig. 3
Fig. 3. Composition of eukaryotic communities in dry riverbed sediments (n = 76).
Read proportions (square root scale) correspond to the relative abundances of each taxon per sample and were estimated using the 18S marker dataset rarefied to 15624 reads per sample. Further details are provided in the Fig. 2 legend. Source data are provided as a Source Data file.
Fig. 4
Fig. 4. Influence of environmental variables on the bacterial copiotrophic:oligotrophic ratio.
Partial dependence plots of the relative abundance of bacterial copiotrophic and oligotrophic operational taxonomic units (OTUs), indicating the contribution of five predictor variables to log10(copiotrophic:oligotrophic [copio:oligo] ratio +1) as a function of the predictors (i.e. when the other contributing predictors are held at their mean). Hash marks on x axes indicate the deciles of the predictor variables. Predictors are shown in order of decreasing importance (%IncMse as defined in Table 1).
Fig. 5
Fig. 5. Partial correlation network between the beta-diversity of the eight major taxa contributing to dry-riverbed biodiversity and climatic, physicochemical, land-use, and spatial distances between sites, as inferred from a graphical lasso method.
Each node represents the turnover component of beta-diversity (calculated using the Bray-Curtis index) of a taxon (yellow) or a spatial (blue), climatic (orange), or environmental (green) distance. Line width is proportional to the partial correlations (indicated on each line) between pairs of nodes.

References

    1. He, F. et al. The global decline of freshwater megafauna. Glob. Chang. Biol.25, 3883–3892 (2019). 10.1111/gcb.14753 - DOI - PubMed
    1. Reid, A. J. et al. Emerging threats and persistent conservation challenges for freshwater biodiversity. Biol. Rev.94, 849–873 (2019). 10.1111/brv.12480 - DOI - PubMed
    1. Dudgeon, D. et al. Freshwater biodiversity: importance, threats, status and conservation challenges. Biol. Rev.81, 163–182 (2006). 10.1017/S1464793105006950 - DOI - PubMed
    1. Sánchez-Bayo, F. & Wyckhuys, K. A. G. Worldwide decline of the entomofauna: a review of its drivers. Biol. Conserv.232, 8–27 (2019). 10.1016/j.biocon.2019.01.020 - DOI
    1. Crabot, J. et al. A global perspective on the functional responses of stream communities to flow intermittence. Ecography44, 1511–1523 (2021). 10.1111/ecog.05697 - DOI - PMC - PubMed