. 2024 Aug 22;15(1):7027.
doi: 10.1038/s41467-024-51216-w.

Mutant huntingtin impairs neurodevelopment in human brain organoids through CHCHD2-mediated neurometabolic failure

Affiliations

Mutant huntingtin impairs neurodevelopment in human brain organoids through CHCHD2-mediated neurometabolic failure

Pawel Lisowski et al. Nat Commun. .

Abstract

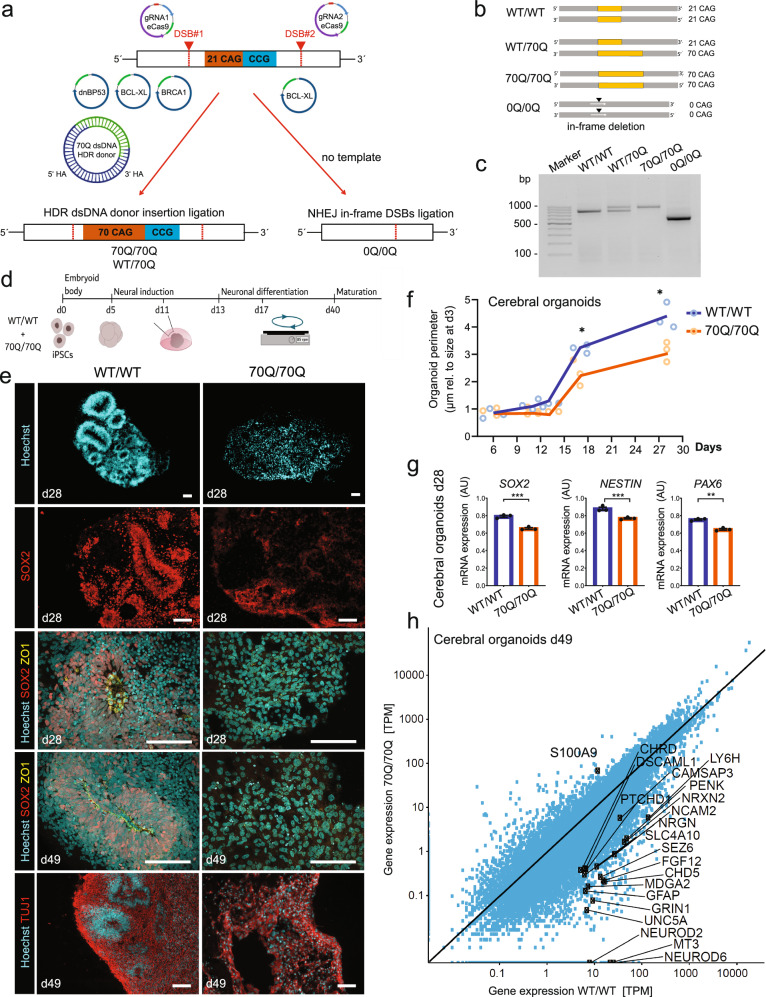
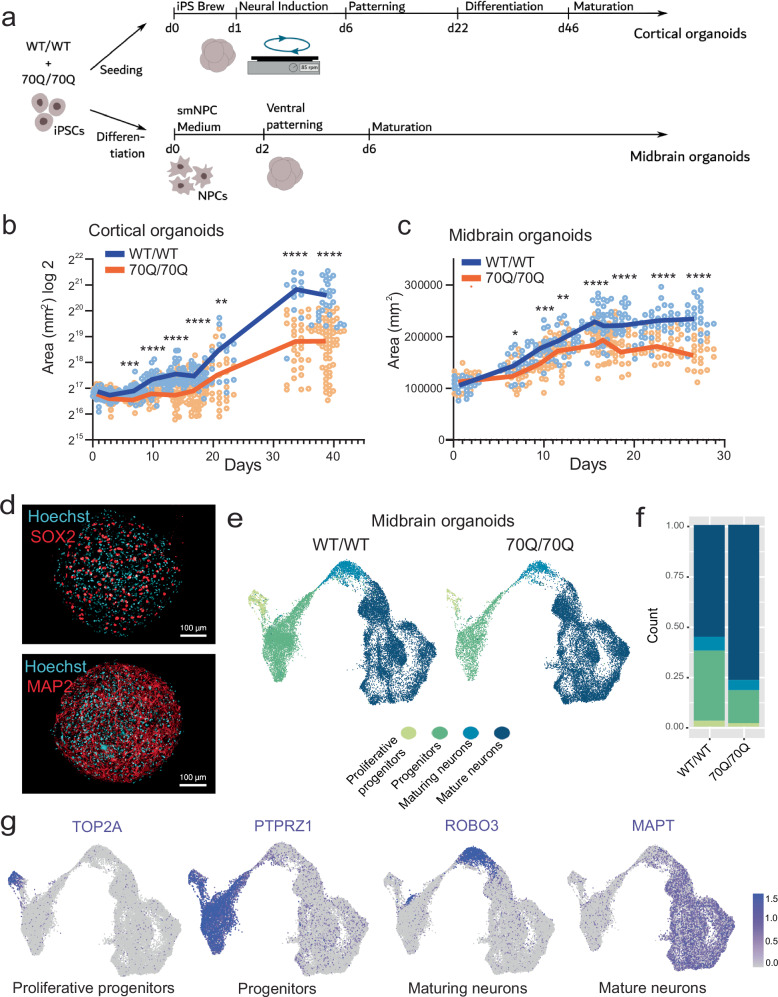
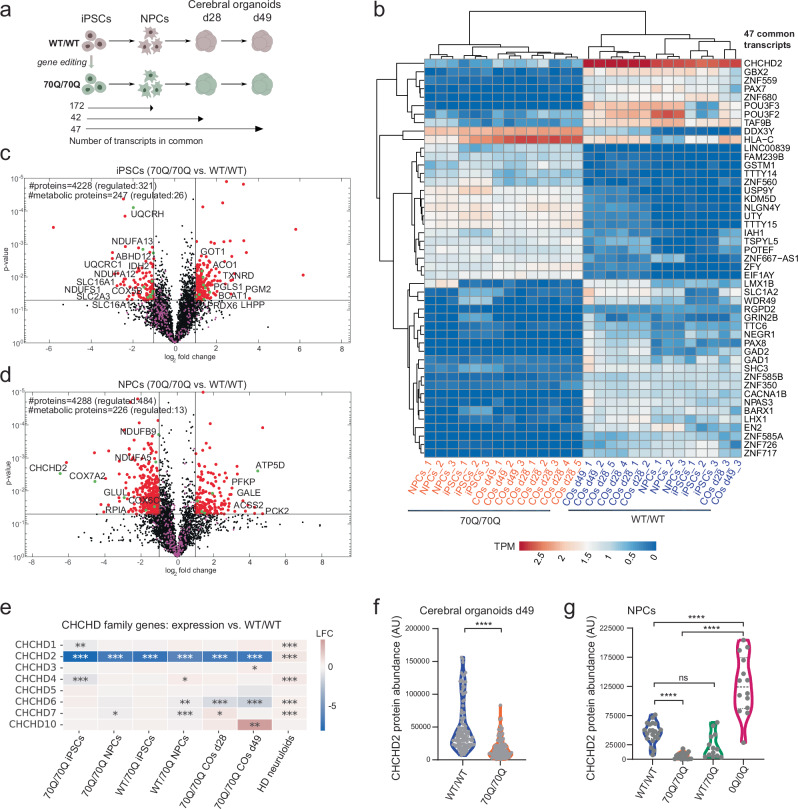
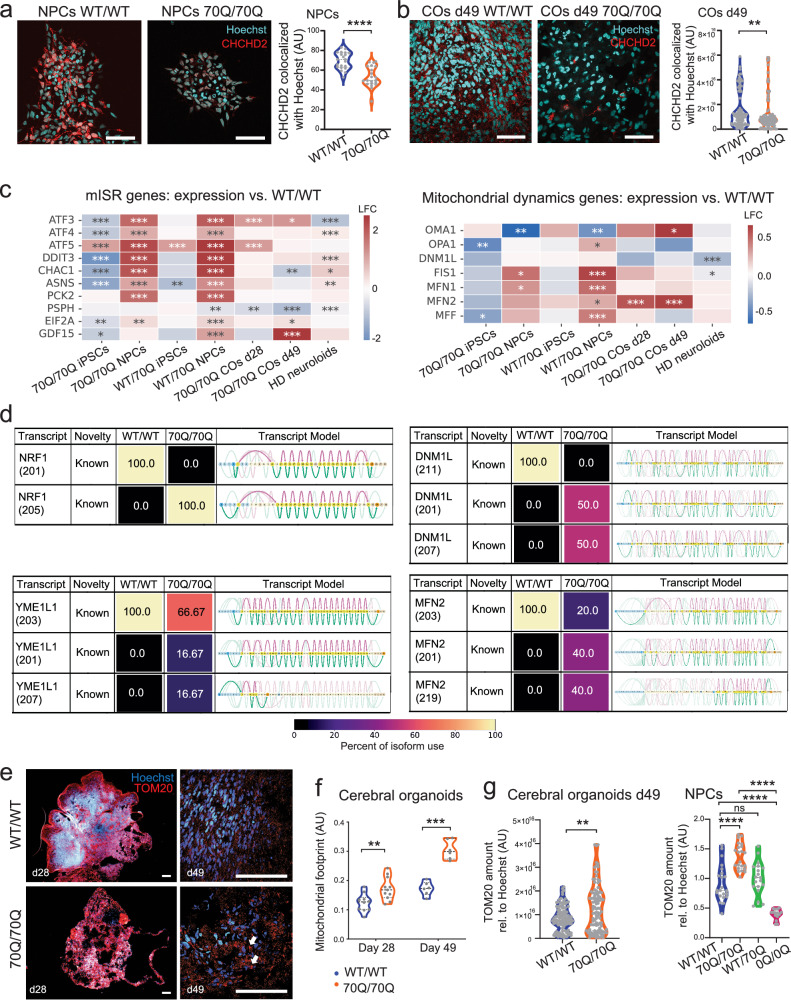
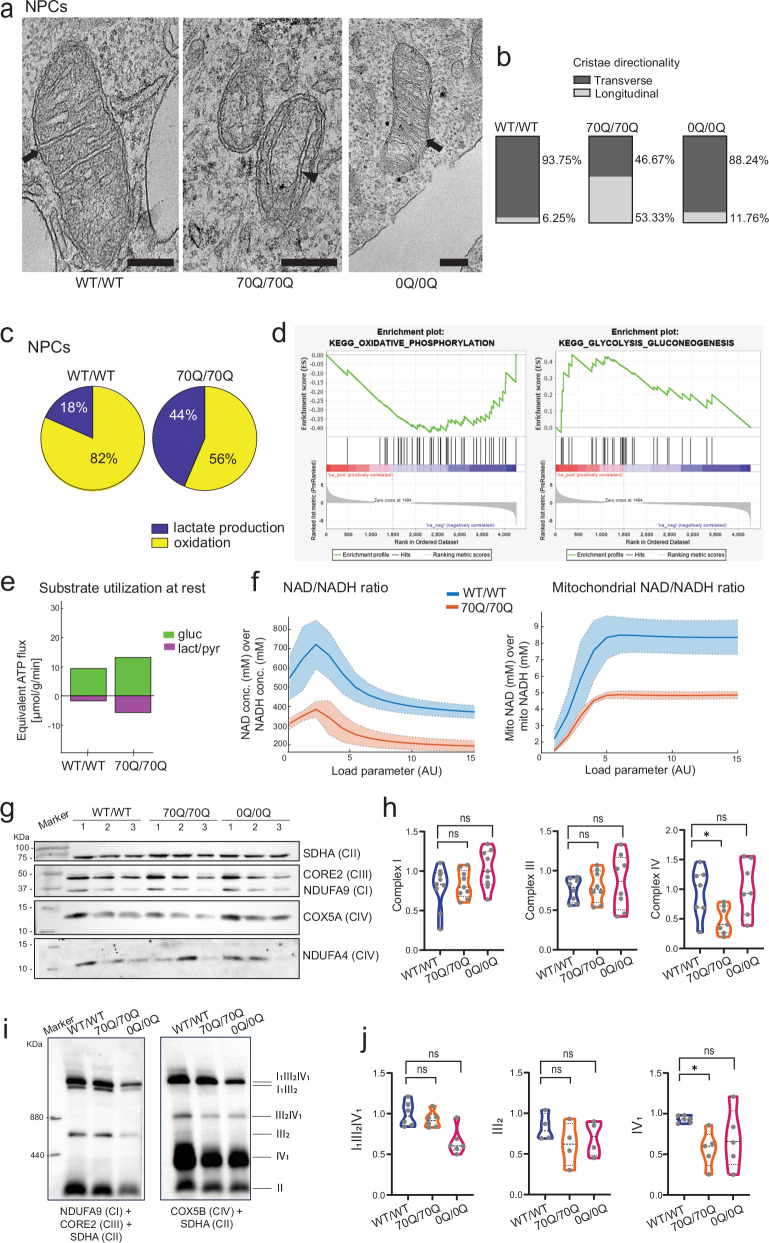
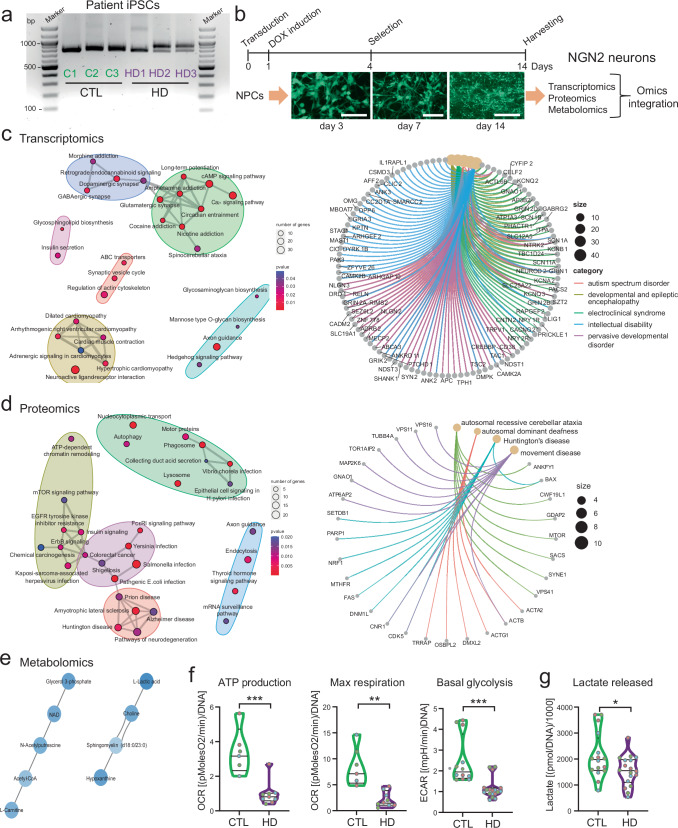
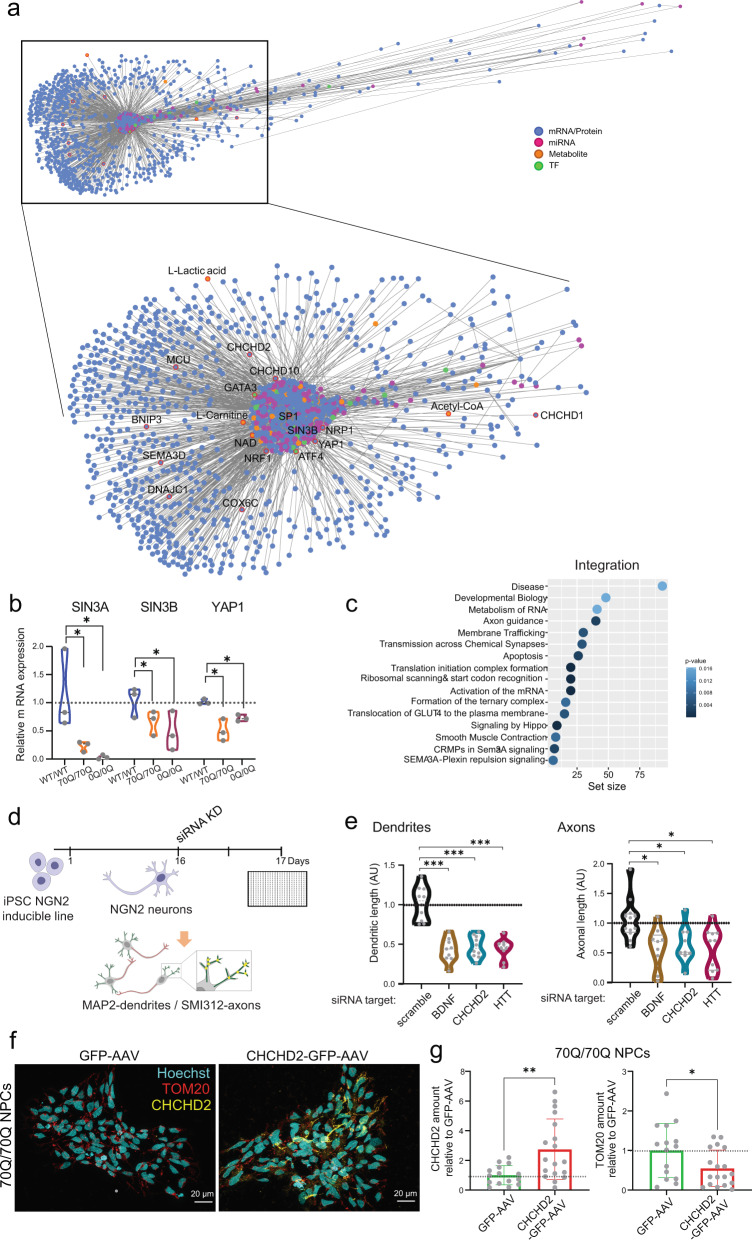
Expansion of the glutamine tract (poly-Q) in the protein huntingtin (HTT) causes the neurodegenerative disorder Huntington's disease (HD). Emerging evidence suggests that mutant HTT (mHTT) disrupts brain development. To gain mechanistic insights into the neurodevelopmental impact of human mHTT, we engineered male induced pluripotent stem cells to introduce a biallelic or monoallelic mutant 70Q expansion or to remove the poly-Q tract of HTT. The introduction of a 70Q mutation caused aberrant development of cerebral organoids with loss of neural progenitor organization. The early neurodevelopmental signature of mHTT highlighted the dysregulation of the protein coiled-coil-helix-coiled-coil-helix domain containing 2 (CHCHD2), a transcription factor involved in mitochondrial integrated stress response. CHCHD2 repression was associated with abnormal mitochondrial morpho-dynamics that was reverted upon overexpression of CHCHD2. Removing the poly-Q tract from HTT normalized CHCHD2 levels and corrected key mitochondrial defects. Hence, mHTT-mediated disruption of human neurodevelopment is paralleled by aberrant neurometabolic programming mediated by dysregulation of CHCHD2, which could then serve as an early interventional target for HD.


Conflict of interest statement

The authors declare no competing interests.

Figures

Fig. 1
Fig. 1. Engineered iPSCs carrying mHTT give rise to neurodevelopmentally impaired cerebral organoids.
a Genome editing approach in control iPSCs (WT/WT) using two double-strand breaks (DSB) sites to modify the HTT genomic region encompassing the CAG/CAA and CCG repeats stretches. To generate iPSCs carrying elongated CAG in one allele (70Q/WT) or in both alleles (70Q/70Q), we promoted homology direct repair (HDR) (with plasmids BCL-XL and BRCA1), inhibited non-homologous end joining (NHEJ) (with plasmid dnBP53), and provided a HDR donor dsDNA plasmid carrying 70Q repeats and homology arms. We harnessed NHEJ to obtain iPSCs with in-frame deletion of the CAG/CCG region (0Q/0Q). b Overview of the engineered isogenic iPSC lines. c PCR analysis of HTT in the isogenic iPSC lines. Data were repeated in three independent experiments. d Schematics of the protocol to generate unguided cerebral organoids from isogenic iPSC lines WT/WT and 70Q/70Q. e Immunostaining in cerebral organoids at day 28 and 49 showing defective cytoarchitecture and neural progenitor cell (NPC) organization in 70/70Q. Data were repeated in three independent experiments. Scale bar: 100 µm. f Growth rate of cerebral organoids with respect to the initial perimeter size measured at day 3. n = 3 independent organoid differentiations (dots) per line. Each dot represents the average size of all cerebral organoids measured in one biological replicate. *p < 0.05 WT/WT vs. 70Q/70Q; unpaired two-tailed Welch t test. g qPCR analysis of NPC markers in cerebral organoids at day 28. Mean ± s.e.m.; n = 3 independent biological replicates (dots) per line; ***p < 0.001 WT/WT vs. 70Q/70Q; unpaired two-tailed t test (AU=arbitrary units). Four organoids were pooled for each individual RNA isolation. h Gene expression analysis of cerebral organoids at day 49 highlighting the genes belonging to the GO term “nervous system development” (GO:0007399).
Fig. 2
Fig. 2. mHTT compromises development and neural progenitor population in region-specific brain organoids.
a Schematics of the protocol to generate guided region-specific brain organoids from iPSC lines WT/WT and 70Q/70Q. For cortical organoids, we started the differentiation from iPSCs, for midbrain organoids we started from NPCs. b Growth curve of cortical organoids. Dots represent individual organoids over at least two independent experiments. We compared organoid size at defined time points (day 1, 2, 7, 10, 14, 17, 21, 34, 39): ***p < 0.001, ****p < 0.0001 WT/WT vs. 70Q/70Q; two-tailed Mann-Whitney U test. c Growth curve of midbrain organoids. Dots represent individual organoids over at least two independent experiments. We compared organoid size at defined time points (day 1, 7, 10, 12, 16, 17, 19, 23, 27): ***p < 0.001, ****p < 0.0001 WT/WT vs. 70Q/70Q; two-tailed Mann-Whitney U test. d Midbrain organoids stained for neural progenitor marker SOX2 and neuronal marker MAP2 to show their uniform distribution within individual organoids. Data were repeated in two independent experiments. Scale bar: 100 µm. e Single-cell analysis of midbrain organoids. Uniform manifold approximation and projection (UMAP) showing the overall cell composition of WT/WT and 70Q/70Q midbrain organoids. Each sample was sequenced in three biological replicates, with each replicate containing around 48 individual midbrain organoids. Shown here are merged UMAP images for all three replicates for WT/WT and three replicates for 70Q/70Q. f Quantification of the four annotated cell populations in WT/WT and 70Q/70Q midbrain organoids. g Distribution of exemplary markers for each of the four cell populations composing the midbrain organoids (see Supplementary Data 1).
Fig. 3
Fig. 3. Omics analyses of mHTT-expressing cells across neurodevelopmental stages highlight the dysregulation of CHCHD2.
a Schematics of RNA sequencing experimental set up for isogenic lines WT/WT and 70Q/70Q. Below are reported the number of transcripts uniquely in common across the neurodevelopmental stages (iPSCs, NPCs, cerebral organoids (COs) at day 23 and COs at day 49) (see Supplementary Data 2, 3). b Heatmap showing the 47 transcripts uniquely in common across the neurodevelopmental stages. TPM: transcripts per million. c, d Volcano plot of proteomic datasets in iPSCs and NPCs showing statistical significance (p value) versus magnitude of change (log2 fold change) based on two-sample two-tailed t-test with Benjamini-Hochberg (BH, FDR of 0.05) correction for multiple testing (see Supplementary Data 4–6). Red dots indicate the significantly differently regulated proteins (right quadrant: upregulated in 70Q/70Q; left quadrant: downregulated in 70Q/70Q). Metabolic proteins were later used for the proteomic-driven functional metabolic analysis (see Supplementary Data 6). Green dots highlight regulated proteins that are explicitly named. e Heatmap of log-fold change (LFC) comparisons of differential gene expression of genes belonging to the CHCHD family. Data obtained from RNA sequencing of iPSCs, NPCs, and COs; *p < 0.05, **p < 0.01, ***p < 0.001; 70Q/70Q and WT/70Q vs. WT/WT, HD neuruloids vs. WT neuruloids; two-sided likelihood ratio test, without multiple comparison adjustments. f, g Quantifications of protein abundance of CHCHD2 based on immunostaining performed in cerebral organoids and NPCs. The amount of positive CHCHD2 signal per image was normalized to the Hoechst signal. 4****p < 0.0001, ns: not significant; two-tailed Mann-Whitney U test.
Fig. 4
Fig. 4. mISR and altered mitochondrial morpho-dynamics are associated with CHCHD2 dysregulation in mHTT-carrying neural cells.
a, b Representative immunostaining and related quantifications of CHCHD2 protein colocalization with nuclear staining Hoechst in NPCs and in cerebral organoids (COs) at day 49. Dots represent individual images collected from at least two biological replicates for NPCs (n = at least 35 individual images per sample) and COs (n = at least 77 individual images per sample). **p < 0.01, ****p < 0.0001; two-tailed Mann-Whitney U test. Scale bar: 100 µm. c Heatmap of log-fold change (LFC) comparisons of genes involved in mitochondrial integrated stress response (mISR) and mitochondrial dynamics. Data obtained from RNA sequencing of iPSCs, NPCs, and COs; *p < 0.05, **p < 0.01, ***p < 0.001; 70Q/70Q and WT/70Q vs. WT/WT, HD neuruloids vs. WT neuruloids; two-sided likelihood ratio test, without multiple comparison adjustments. d Isoform usage in NPCs determined with long-read transcriptomics. Percentage of use in WT/WT NPCs and 70Q/70Q NPCs and related transcript model are shown. e, f Representative immunostaining and related quantification of mitochondrial footprint (comprising both small and large mitochondrial structures) based on TOM20 signal in cerebral organoids from 70Q/70Q and WT/WT. Dots represent individual images collected over three independent experiments. **p < 0.01, ***p < 0.001, unpaired two-tailed t test (AU = arbitrary units). Scale bar: 100 µm. g Quantifications of protein abundance of TOM20 based on immunostaining performed in cerebral organoids and NPCs. The amounts of positive TOM20 signal per image was normalized to Hoechst signal. Dots represent individual images collected from at least two biological replicates for NPCs (n = at least 35 individual images per sample) and COs (n = at least 77 individual images per sample) (AU = arbitrary units). **p < 0.01, ****p < 0.0001, ns: not significant; two-tailed Mann-Whitney U test.
Fig. 5
Fig. 5. Neurometabolic defects induced by mHTT.
a Representative electron microscopy images of mitochondria within WT/WT NPCs, 70Q/70Q NPCs, and 0Q/0Q NPCs. Arrows indicate mitochondrial cristae with transverse direction with respect to mitochondrial outer membrane. Arrowhead indicates cristae with longitudinal direction. Data were repeated in two independent experiments. Scale bar: 200 nm. b Quantification of cristae direction in NPCs from WT/WT, 70Q/70Q and 0Q/0Q. For each sample, a minimum of 15 different mitochondrion were considered out of at least two biological replicates. c Proteomic-driven functional metabolic analysis (see Supplementary Data 7) depicting relative glucose utilization at resting energy demands in NPCs. d Gene Set Enrichment Analysis (GSEA) showing decreased oxidative phosphorylation (OXPHOS) and increased glycolysis/gluconeogenesis in 70Q/70Q NPCs compared to WT/WT NPCs. e Substrate utilization at rest in NPCs from WT/WT and 70Q/70Q. Energetic capacities were evaluated by computing the changes in metabolic state elicited by an increase of the ATP consumption rate above the resting value. mHTT-carrying cells showed higher consumption of glucose (gluc) and higher production of lactate-pyruvate (lact/pyr). f Metabolic state variables for NAD/NADH ratio and mitochondrial NAD/NADH ratio in NPCs in dependence of increasing energetic demands. Lines and colored areas represent mean ± s.d. g, h SDS-PAGE analysis and related quantification of mitochondrial complex I, III, and IV subunits in WT/WT NPCs, 70Q/70Q NPCs, and 0Q/0Q NPCs. n = 3 independent biological replicates per line run in three different blots; *p < 0.05, ns: not significant; unpaired two-tailed Welch t test. i, j Blue native PAGE analysis and related quantification of complexes III2 and IV, and supercomplexes I1III2IV0–1 assembly in WT/WT NPCs, 70Q/70Q NPCs, and 0Q/0Q NPCs. n = 3 independent biological replicates per line run in two different blots; *p < 0.05, ns: not significant; unpaired two-tailed Welch t test.
Fig. 6
Fig. 6. Multi-omics signature of NGN2 neurons from individuals with HD underscores developmental and metabolic defects.
a PCR analysis of HTT in NPCs derived from three healthy controls (C1, C2, C3) and three individuals with HD (HD1, HD2, HD3, carrying WT/180Q, WT/58Q, and WT/44Q, respectively). Data were repeated in three independent experiments. b Schematics of Neurogenin 2 (NGN2)-based neuronal induction in NPCs from healthy controls (C1, C2, C3) and HD individuals (HD1, HD2, HD3). Scale bar: 100 µm. c Enrichment analysis of differentially expressed genes (DEGs) in NGN2 neurons from HD individuals compared to controls, hypergeometric test one-sided with FDR adjustment for multiple comparisons (filter for p value < =0.05). Left: over-representation analysis (ORA) of upregulated DEGs for KEGG pathways; right: ORA of upregulated DEGs for human diseases. Yellow nodes represent the enriched diseases and gray nodes their associated genes, with colored edges indicating their connection (see Supplementary Data 7). d Enrichment analysis of differentially expressed proteins (DEPs) in NGN2 neurons from HD individuals compared to controls, hypergeometric test one-sided with FDR adjustment for multiple comparisons (filter for p-value < =0.05). Left: ORA of upregulated DEPs for KEGG pathways; right: ORA of upregulated DEPs for human diseases (see Supplementary Data 8, 9). e Enrichment analysis of differentially expressed metabolites (DEMs) in NGN2 neurons from HD individuals compared to controls (see Supplementary Data 10). Interactions between the significantly dysregulated metabolites. f Mitochondrial bioenergetics based on oxygen consumption rate (OCR) and glycolysis based on extracellular acidification rate (ECAR) measured by Seahorse profiling in NGN2 neurons from controls (C1, C2, C3) and HD individuals (HD1, HD2, HD3). n = 3 independent biological replicates per line (different colors of dots refer to the three replicates). *p < 0.05, **p < 0.01, ***p < 0.001; unpaired two-tailed t test. g Quantification of lactate released in the supernatant by NGN2 neurons at the end of Seahorse experiments. *p < 0.05; unpaired two-tailed t test.
Fig. 7
Fig. 7. CHCHD2 belongs to the multi-omics network of HD neurons and its manipulation affects neurite growth and mitochondrial morpho-dynamics.
a 3D multi-omics network. Significantly dysregulated mRNAs, proteins, and metabolites along with their predicted miRNAs and transcription factors (TFs) are arranged in a comet-shaped network. CHCHD2 and CHCHD10 are located closely to the core of the network. b qPCR analysis of components of the core network related to Hippo signaling in NPCs. Expression level of each gene was related to that of housekeeping genes ACTB and OAZ1. Mean ± s.e.m.; n = 3 independent biological replicates (dots) per line; *p < 0.05; unpaired two-tailed Welch t test. c Enrichment analysis for Reactome biological pathways affected by the dysregulated mRNAs/proteins of the multi-omics network; hypergeometric test one-sided with FDR adjustment for multiple comparisons (filter for adj. p value < =0.05). d Schematics of small interfering RNA (siRNA)-mediated knockdown (KD) in NGN2 neurons from NGN2-inducible control iPSCs. Quantification of neuronal arborization assessed by high-content imaging based on antibodies labeling axons (SMI132) and dendrites (MAP2). e Quantification of branching outgrowth in NGN2 neurons following siRNA KD. Dot indicates different replicates out of three independent experiments. *p < 0.05, ***p < 0.001 compared to scramble siRNA KD; Kruskal-Wallis test with Dunn’s multiple comparisons test. f Representative images of 70Q/70Q NPCs transduced with either GFP-AAV or CHCHD2-GFP-AAV. Scale bar: 20 µm. g Quantification of CHCHD2 and TOM20 amount in GFP-positive 70Q/70Q NPCs transduced with either GFP-AAV or CHCHD2-GFP-AAV. Data shown as mean ± s.d. Dots represent individual images collected from two independent experiments. represent **p < 0.01, *p < 0.05; unpaired two-tailed Welch t test.

References

    1. Ross, C. A. & Tabrizi, S. J. Huntington’s disease: from molecular pathogenesis to clinical treatment. Lancet Neurol.10, 83–98 (2011). 10.1016/S1474-4422(10)70245-3 - DOI - PubMed
    1. Arrasate, M. & Finkbeiner, S. Protein aggregates in Huntington’s disease. Exp. Neurol.238, 1–11 (2012). 10.1016/j.expneurol.2011.12.013 - DOI - PMC - PubMed
    1. Bhide, P. G. et al. Expression of normal and mutant Huntingtin in the developing brain. J. Neurosci.16, 5523–5535 (1996). 10.1523/JNEUROSCI.16-17-05523.1996 - DOI - PMC - PubMed
    1. Nasir, J. et al. Targeted disruption of the Huntington’s disease gene results in embryonic lethality and behavioral and morphological changes in heterozygotes. Cell81, 811–823 (1995). 10.1016/0092-8674(95)90542-1 - DOI - PubMed
    1. Duyao, M. P. et al. Inactivation of the mouse Huntington’s disease gene homolog Hdh. Science269, 407–410 (1995). 10.1126/science.7618107 - DOI - PubMed

MeSH terms