. 2024 Aug 22;15(1):7222.
doi: 10.1038/s41467-024-51694-y.

Specific multivalent molecules boost CRISPR-mediated transcriptional activation

Affiliations

Specific multivalent molecules boost CRISPR-mediated transcriptional activation

Rui Chen et al. Nat Commun. .

Abstract

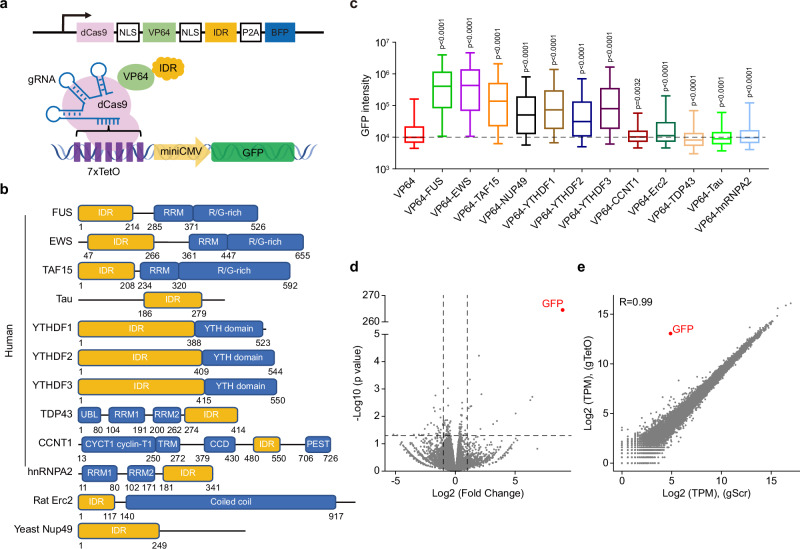
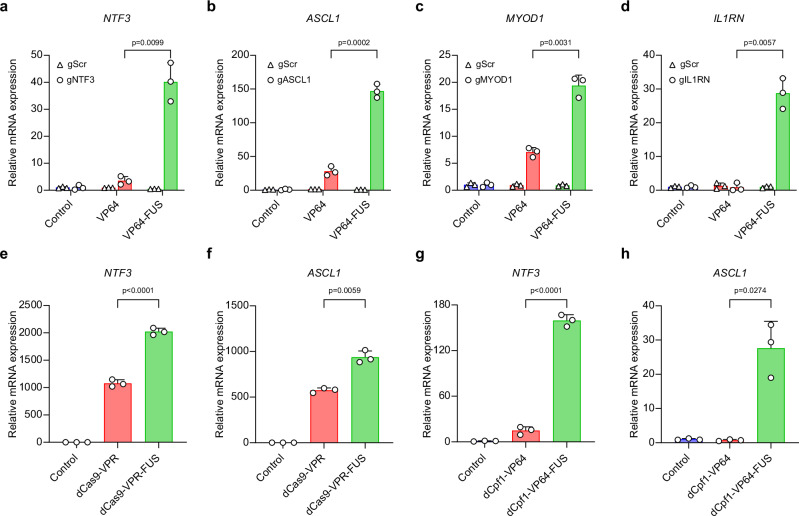
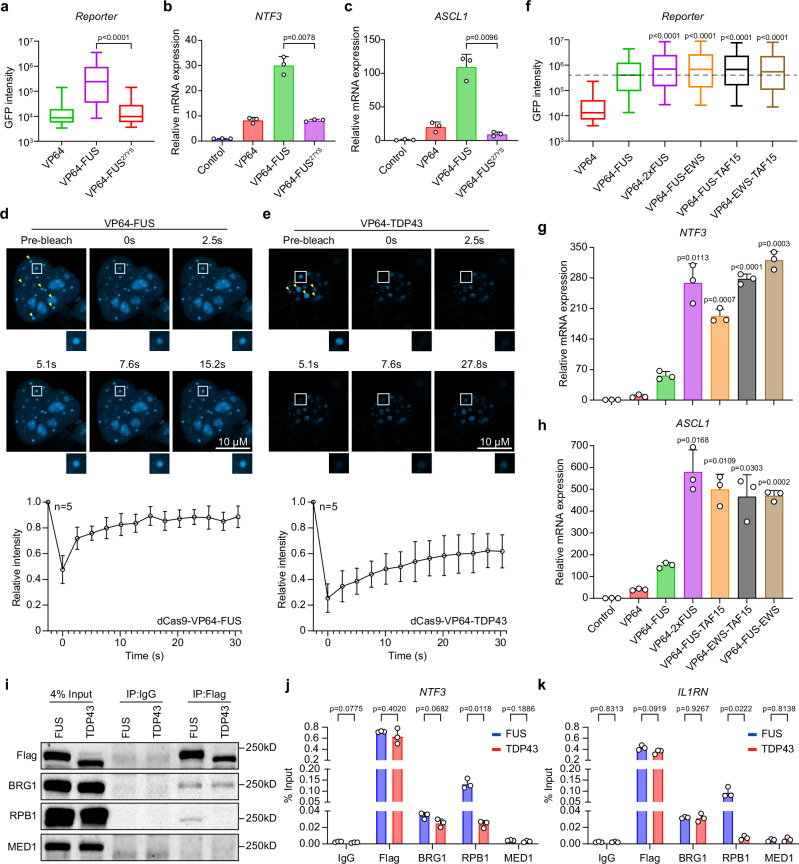
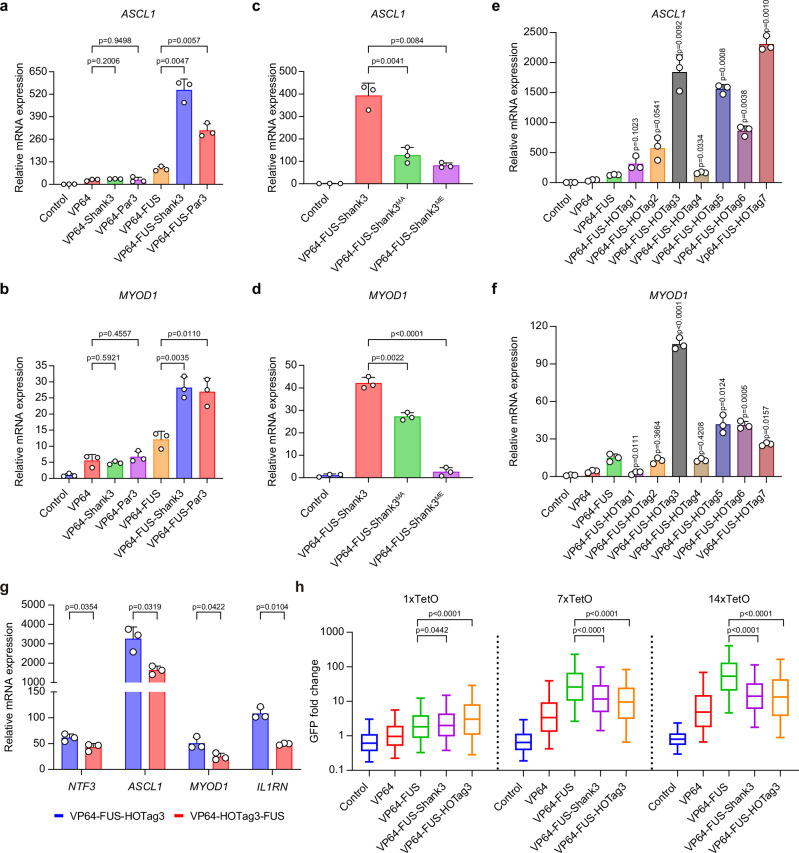
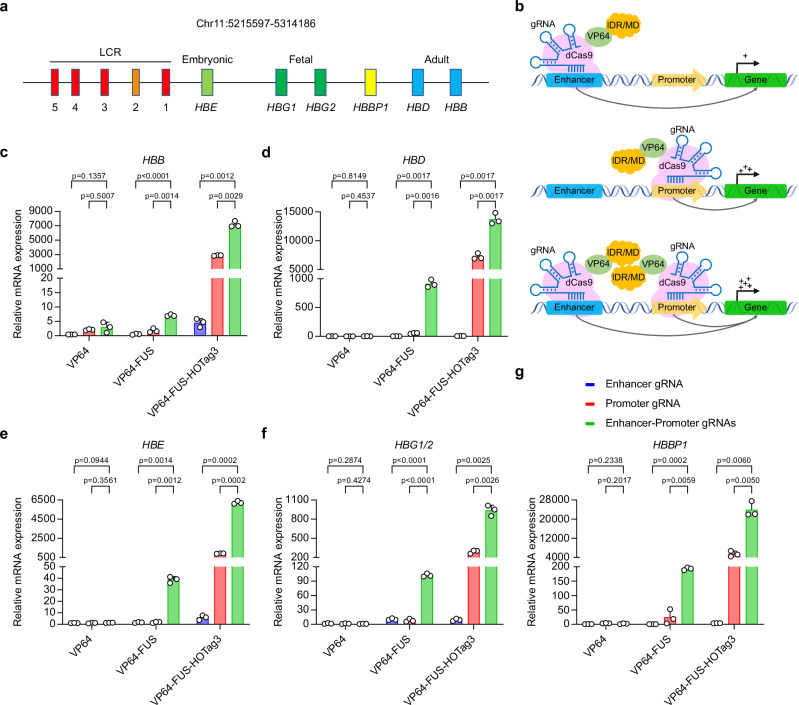
CRISPR/Cas-based transcriptional activators can be enhanced by intrinsically disordered regions (IDRs). However, the underlying mechanisms are still debatable. Here, we examine 12 well-known IDRs by fusing them to the dCas9-VP64 activator, of which only seven can augment activation, albeit independently of their phase separation capabilities. Moreover, modular domains (MDs), another class of multivalent molecules, though ineffective in enhancing dCas9-VP64 activity on their own, show substantial enhancement in transcriptional activation when combined with dCas9-VP64-IDR. By varying the number of gRNA binding sites and fusing dCas9-VP64 with different IDRs/MDs, we uncover that optimal, rather than maximal, cis-trans cooperativity enables the most robust activation. Finally, targeting promoter-enhancer pairs yields synergistic effects, which can be further amplified via enhancing chromatin interactions. Overall, our study develops a versatile platform for efficient gene activation and sheds important insights into CRIPSR-based transcriptional activators enhanced with multivalent molecules.


Conflict of interest statement

R.C., X.S., H.C., and W.C. have submitted a patent application related to this work to the China National Intellectual Property Administration (application number 202210903472.2). The remaining authors declare no competing interests.

Figures

Fig. 1
Fig. 1. dCas9-VP64-IDR robustly activates reporter gene with high specificity.
a Schematic representation of dCas9-VP64-IDR targeting a Tet-on GFP reporter. The GFP expression in this reporter is regulated by seven tandem tetracycline operator (7xTetO) sequences along with a minimal CMV promoter. Binding of the dCas9-VP64-IDR fusion protein to the TetO sites activates GFP expression. b Domain architectures of proteins containing intrinsically disordered regions (IDRs). The specific IDR fragments fused to dCas9-VP64 in this study are highlighted in yellow. c Boxplot illustrating the GFP intensity in HEK293R cells expressing dCas9-VP64 or dCas9-VP64-IDR fusions, in combination with a guide RNA targeting the TetO elements (gTetO). The results are presented as the median GFP intensity, along with the 25th and 75th quartiles, as well as the 5th and 95th percentiles, and are representative of three independent experiments. Statistical significance was determined by two-sided Wilcoxon rank-sum test. Cell numbers from left to right (n = 14,983, 13,741, 15,366, 14,226, 18,070, 16,249, 14,173, 12,839, 12,335, 9112, 16,921, 19,733, 12,970). d Volcano plot comparing the gene expression profile of HEK293R cells expressing dCas9-VP64-FUS with a gRNA targeting TetO (gTetO) to that with a scrambled gRNA (gScr) control. The x-axis represents the Log2 fold change in gene expression between the two conditions, while the y-axis displays −Log10 p value. Differentially expressed genes were determined using the criteria of |Log2 (fold change)| > 1 and FDR < 0.05, with GFP (marked in red) being the only gene meeting these criteria. Statistical significance was determined by two-sided Wald test with Benjamini–Hochberg correction. e Correlation of gene expression profile of HEK293R cells expressing dCas9-VP64-FUS with a gRNA targeting TetO (gTetO) to that with a scrambled gRNA (gScr) control. The x-axis represents the Log2 TPM of control group and y-axis displays the Log2 TPM of activation group. Pearson correlation coefficient (R) = 0.99. The source data for Fig. 1d, e are deposited under accession number GSE248523. Source data are provided as a Source data file.
Fig. 2
Fig. 2. Endogenous genes activated by dCas9-VP64-IDR.
ad Relative mRNA expression of NTF3, ASCL1, MYOD1, and IL1RN in HEK293T cells transfected with dCas9-VP64 or dCas9-VP64-FUS and a single guide RNA (gRNA) targeting each gene promoter as well as a scrambled gRNA (gScr) control. Data are shown as mean ± SD (n = 3 independent experiments). Statistical significance was determined by two-sided Welch’s t-test. e, f Relative mRNA expression of NTF3 and ASCL1 in HEK293T cells transfected with dCas9-VPR or dCas9-VPR-FUS and a gRNA targeting each gene promoter. Data are shown as mean ± SD (n = 3 independent experiments). Statistical significance was determined by two-sided Welch’s t-test. g, h Relative mRNA expression of NTF3 and ASCL1 in HEK293T cells transfected with dCpf1-VP64 or dCpf1-VP64-FUS and a gRNA targeting each gene promoter. Data are shown as mean ± SD (n = 3 independent experiments). Statistical significance was determined by two-sided Welch’s t-test. Source data are provided as a Source data file.
Fig. 3
Fig. 3. IDR-mediated multivalent interactions and transcriptional activation.
a Boxplot illustrating the GFP intensity in HEK293R cells expressing different dCas9 activators together with gTetO. The results are presented as the median GFP intensity, along with the 25th and 75th quartiles, as well as the 5th and 95th percentiles, and are representative of three independent experiments. Statistical significance was determined by two-sided Wilcoxon rank-sum test. Cell numbers from left to right (n = 17198, 17379, 9902). b, c Relative mRNA expression of NTF3 and ASCL1 in HEK293T cells expressing different dCas9 activators and a single gRNA targeting the indicated genes. Data are shown as mean ± SD (n = 3 independent experiments). Statistical significance was determined by one-way ANOVA versus the dCas9-VP64-FUS group. d, e Fluorescence recovery after photobleaching (FRAP) analysis of HEK293R cells expressing BFP-tagged dCas9-VP64-FUS or dCas9-VP64-TDP-43 with gTetO. Up, representative timelapse images after photobleaching. Yellow arrowheads indicate bleached condensates. Scale bar, 10 μm. Down: FRAP curves showing mean ± SD fluorescence recovery of condensates (n = 5 puncta per group). f Boxplot illustrating the GFP intensity in HEK293R cells expressing different dCas9 activators together with gTetO. The results are presented as the median GFP intensity, along with the 25th and 75th quartiles, as well as the 5th and 95th percentiles, and are representative of three independent experiments. Statistical significance was determined by two-sided Wilcoxon rank-sum test. Cell numbers from left to right (n = 19,096, 16,734, 13,743, 14,080, 12,071, 17,691). g, h Relative mRNA expression of NTF3 and ASCL1 in HEK293T cells expressing different dCas9 activators and a single gRNA targeting the indicated genes. Data are shown as mean ± SD (n = 3 independent experiments). Statistical significance was determined by one-way ANOVA versus the dCas9-VP64-FUS group. i Co-immunoprecipitation (co-IP) of Flag-tagged dCas9 activators and BRG1, MED1 or RPB1. Three independent experiments were performed and similar results were obtained. j, k Enrichment of Flag-tagged dCas9 activators, BRG1, RPB1, and MED1 at the NTF3 or IL1RN promoter. Data are presented as mean values ± SD (n = 3 independent experiments). Statistical significance was determined by two-sided Welch’s t-test. Source data are provided as a Source data file.
Fig. 4
Fig. 4. Cooperation of IDR and MD in CRISPRa-based transcriptional activation.
a, b Relative mRNA expression of ASCL1 and MYOD1 in HEK293T cells transfected with a single gRNA targeting the indicated genes along with the labeled dCas9-activators. Data are shown as mean ± SD (n = 3 independent experiments). Statistical significance was determined by one-way ANOVA versus the dCas9-VP64 or the dCas9-VP64-FUS group. c, d Relative mRNA expression of ASCL1 and MYOD1 in HEK293T cells transfected with dCas9-VP64-FUS-Shank3, dCas9-VP64-FUS-Shank3MA, or dCas9-VP64-FUS-Shank3ME and a single gRNA targeting the indicated genes. Data are shown as mean ± SD (n = 3 independent experiments). Statistical significance was determined by one-way ANOVA test versus the dCas9-VP64-FUS-Shank3 group. e, f Relative mRNA expression of ASCL1 and MYOD1 in HEK293T cells transfected with dCas9-VP64-FUS-HOTag activators and a single gRNA targeting the indicated genes. Data are shown as mean ± SD (n = 3 independent experiments). Statistical significance was determined by one-way ANOVA test versus the dCas9-VP64-FUS group. g Relative mRNA expression of NTF3, ASCL1, MYOD1, and IL1RN in HEK293T cells transfected with a single gRNA targeting the indicated genes along with the dCas9-VP64-FUS-HOTag3 or dCas9-VP64-HOTag3-FUS. Data are shown as mean ± SD (n = 3 independent experiments). Statistical significance was determined by two-sided Welch’s t-test. h Boxplot showing relative GFP intensity in 1xTetO-GFP, 7xTetO-GFP or 14xTetO-GFP reporter cells expressing dCas9, dCas9-VP64, dCas9-VP64-FUS, dCas9-VP64-FUS-Shank3 or dCas9-VP64-FUS-HOTag3 together with gTetO. The results are presented as the relative median GFP intensity, along with the 25th and 75th quartiles, as well as the 5th and 95th percentiles, and are representative of three independent experiments. Statistical significance was determined by two-sided Wilcoxon rank-sum test. Cell numbers from left to right (n = 24,461, 17,298, 21,807, 17,611, 11,280, 22,233, 14,347, 16,136, 15,605, 13,372, 23,028, 11,938, 15,760, 15,641, 12,923). Source data are provided as a Source data file.
Fig. 5
Fig. 5. Synergistic activation by concurrently targeting enhancer-promoter pairs.
a Schematic of the human β-globin locus including Locus Control Region (LCR), downstream HBB, HBD, HBG1/2, HBE genes, and HBBP1 pseudogene. The genes in this locus are regulated by the HS2 enhancer (orange). b Schematic of dCas9-VP64-IDR/MD targeting an enhancer, promoter, or enhancer-promoter pair. The dCas9-VP64-IDR/MD fusion protein can be guided by gRNAs to bind to enhancer elements (top), gene promoters (middle), or both (bottom) to modulate transcriptional activation. cg Relative mRNA expression of HBB, HBD, HBG1/2, HBE, and HBBP1 in HEK293T cells transfected with dCas9-VP64, dCas9-VP64-FUS, or dCas9-VP64-FUS-HOTag3 with promoter gRNA, enhancer gRNA or pooled enhancer-promoter gRNA pair. Data are shown as mean ± SD (n = 3 independent experiments). Statistical significance was determined by one-way ANOVA test versus the gRNAs targeting the enhancer-promoter pair group. Source data are provided as a Source data file.
Fig. 6
Fig. 6. Transcriptional activation enhanced via enhancing chromatin interactions.
a Schematic of ABI-mCherry-dCas9-VP64-FUS and PYL-BFP-dCpf1-VP64-FUS fusion proteins targeting an enhancer and a promoter, respectively. In the presence of abscisic acid (ABA), ABI1 and PYL1 dimerize, inducing an artificial chromatin loop between the targeted enhancer and promoter regions. b, c Relative mRNA expression of HBD and HBG1/2 in HEK293T cells expressing ABI1-mCherry-dCas9 fusion proteins targeted to the HS2 enhancer along with PYL1-BFP-dCpf1 fusion proteins targeted to the corresponding gene promoters. Cells were treated with and without abscisic acid (ABA). The effector domains of the enhancer- and promoter-targeted fusion proteins are indicated. Data are shown as mean ± SD (n = 3 independent experiments). Statistical significance was determined by two-sided Welch’s t-test. Source data are provided as a Source data file.

References

    1. Soto, L. F. et al. Compendium of human transcription factor effector domains. Mol. Cell82, 514–526 (2022). 10.1016/j.molcel.2021.11.007 - DOI - PMC - PubMed
    1. Lambert, S. A. et al. The human transcription factors. Cell175, 598–599 (2018). 10.1016/j.cell.2018.09.045 - DOI - PubMed
    1. Lee, T. I. & Young, R. A. Transcriptional regulation and its misregulation in disease. Cell152, 1237–1251 (2013). 10.1016/j.cell.2013.02.014 - DOI - PMC - PubMed
    1. Hafner, A. & Boettiger, A. The spatial organization of transcriptional control. Nat. Rev. Genet.24, 53–68 (2023). 10.1038/s41576-022-00526-0 - DOI - PubMed
    1. Beerli, R. R. & Barbas, C. F. 3rd Engineering polydactyl zinc-finger transcription factors. Nat. Biotechnol.20, 135–141 (2002). 10.1038/nbt0202-135 - DOI - PubMed

MeSH terms

LinkOut - more resources