. 2024 Aug 22;15(1):7023.
doi: 10.1038/s41467-024-51211-1.

Piezo1 expression in neutrophils regulates shear-induced NETosis

Affiliations

Piezo1 expression in neutrophils regulates shear-induced NETosis

Sara Baratchi et al. Nat Commun. .

Abstract

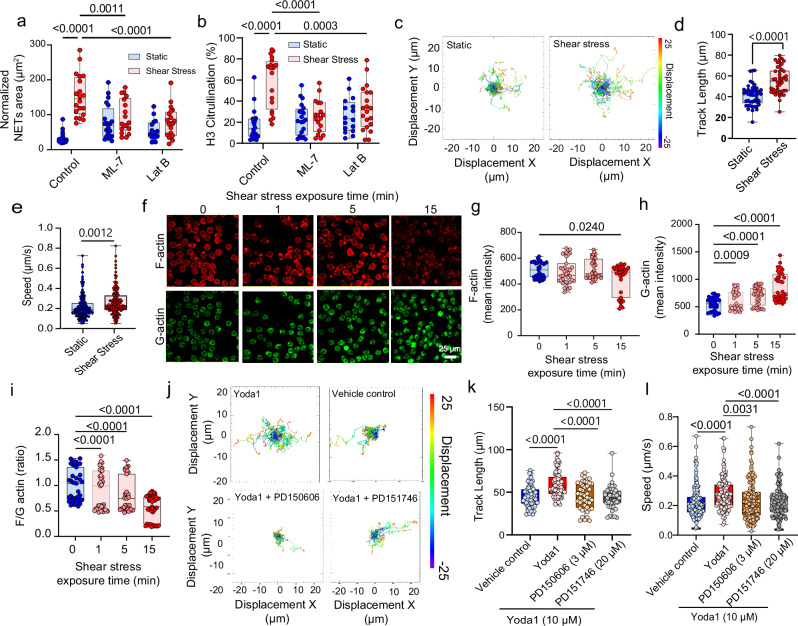
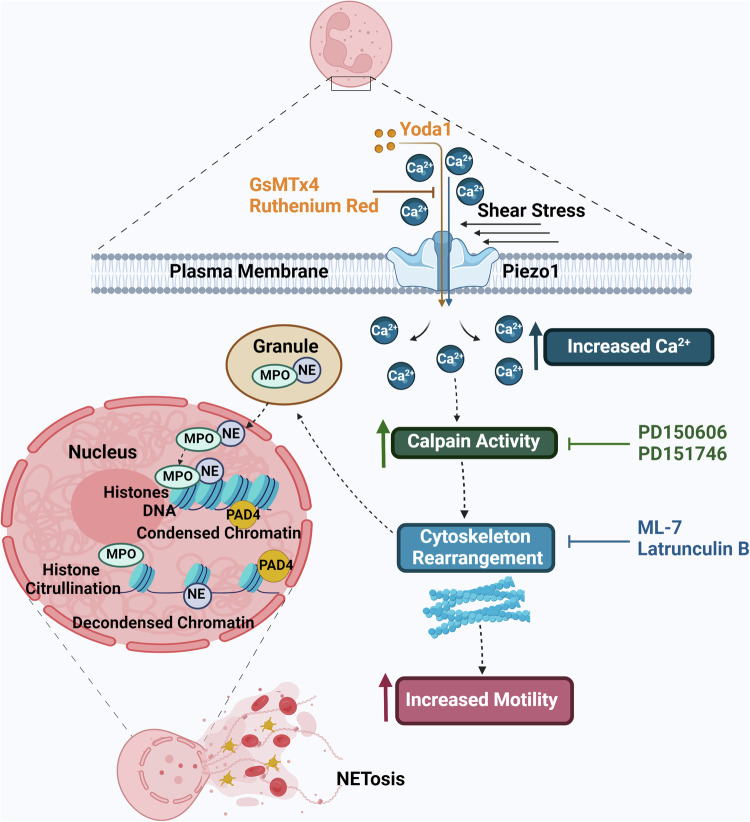
Neutrophil infiltration and subsequent extracellular trap formation (NETosis) is a contributing factor in sterile inflammation. Furthermore, neutrophil extracellular traps (NETs) are prothrombotic, as they provide a scaffold for platelets and red blood cells to attach to. In circulation, neutrophils are constantly exposed to hemodynamic forces such as shear stress, which in turn regulates many of their biological functions such as crawling and NETosis. However, the mechanisms that mediate mechanotransduction in neutrophils are not fully understood. In this study, we demonstrate that shear stress induces NETosis, dependent on the shear stress level, and increases the sensitivity of neutrophils to NETosis-inducing agents such as adenosine triphosphate and lipopolysaccharides. Furthermore, shear stress increases intracellular calcium levels in neutrophils and this process is mediated by the mechanosensitive ion channel Piezo1. Activation of Piezo1 in response to shear stress mediates calpain activity and cytoskeleton remodeling, which consequently induces NETosis. Thus, activation of Piezo1 in response to shear stress leads to a stepwise sequence of cellular events that mediates NETosis and thereby places neutrophils at the centre of localized inflammation and prothrombotic effects.


Conflict of interest statement

The authors declare no competing interests.

Figures

Fig. 1
Fig. 1. Shear stress induces NETosis in human blood neutrophils.
a Representative confocal images of human neutrophils stained with DAPI and citrullinated histone H3 (H3 citrullination) under static control condition or shear stress of 80 dyne/cm2. Graphs show the: b NET area normalized to the number of neutrophils (n = 35 randomly selected field of view (RSFV) in 0, 20 and 80 dyne/cm2 and n = 32 RSFV in 4 dyne/cm2 from N = 7 independent experiments (IE)); c Percentage of cells with condensed and round nuclei (n = 16 RSFV in 0, 20 and 80 dyne/cm2 and n = 17 RSFV in 4 dyne/cm2 from N = 4 IE) and d Percentage of cells stained positive for H3 citrullination (n = 34 RSFV in 0 and 20 dyne/cm2, n = 33 RSFV in 4 dyne/cm2 and n = 35 RSFV in 80 dyne/cm2 from N = 7 IE). Effect of shear stress on: e NET area ((Static: n = 33 RSFV for Control, LPS and ATP and n = 34 RSFV for PMA) (Shear stress: n = 35 RSFV for control, ATP and PMA and n = 34 RSFV for LPS from N = 7 IE); and f H3 citrullination in response to other NET inducers such as LPS (10 µg/ml), ATP (100 nM), and PMA (3 nM) (n = 35 RSFV from N = 7 IE). bd are analysed using one-way ANOVA and mixed effects analysis and e, f are analysed using two-way ANOVA and multiple comparisons test. In bf box plots depict the 25th percentile, the median and the 75th percentile, with minimum to maximum whiskers.
Fig. 2
Fig. 2. Shear stress induces NETosis and provides a scaffold for platelets to adhere to.
a Representative confocal images of neutrophils under static conditions or exposure to shear stress of 80 dyne/cm2 and incubated with platelets. Platelets are stained with P-selectin (red), neutrophils are stained with CD11a (green), and DNA is stained with DAPI (blue). b, c Bar graphs show the average area covered by P-selectin positive platelets normalized to the total neutrophil area (n = 38 RSFV from N = 8 IE) and average P-selectin cluster size (n = 40 RSFV in static and n = 38 RSFV in shear stress from N = 8 IE). d Representative confocal images and e a bar graph showing the effect of shear stress on platelet shape. Red arrows highlight platelets with filopodia, and blue arrows highlight platelets with discoid morphology. (n = 14 RSFV in static and n = 10 RSFV in shear stress groups selected from N = 3 IE). b and c is analysed using two-tailed Student’s T-test and e is analyzed using two-way ANOVA and multiple comparisons test. In b, c and e box plots depict the 25th percentile, the median and the 75th percentile, with minimum to maximum whiskers.
Fig. 3
Fig. 3. Elevation in [Ca2+]i of neutrophils in response to shear stress.
a Fluorescent images of firmly adhered neutrophils at different time points in the presence or absence of shear stress at 10 dyne/cm2. b Representative time-course data of the normalized fluorescent intensity of neutrophils (n = 90 cells for 0.2 and 10 dyne/cm2, n = 43 cells for static and n = 89 cells for 2 dyne/cm2 selected from a representative experiment); and c Maximum increase in [Ca2+]i of neutrophils in response to different shear stress levels (n = 118 cells from N = 3 IE). d Time-course response (n = 50 cells for 10 dyne/cm2 and n = 28 cells for static selected from N = 3 IE); and e Maximum increase in [Ca2+]i of neutrophils after exposure to 3 cycles of shear stress at 10 dyne/cm2 (n = 448 cells in static and n = 489 cells in shear stress groups across N = 9 IE). c is analyzed using one-way ANOVA and mixed effects analysis and e is analyzed using two-way ANOVA and multiple comparisons. In c and e box plots depict the 25th percentile, the median and the 75th percentile, with minimum to maximum whiskers. Error bars in b and d represent standard error. Scale bar is 50 µm.
Fig. 4
Fig. 4. Neutrophils express Piezo1 and activation of Piezo1 via Yoda1 induces NETosis.
a Maximum elevation of [Ca2+]i in response to shear stress (n = 52 cells in static, n = 70 in shear stress, n = 73 in -[Ca2+]ext, n = 74 in Ruthenium Red (RR), n = 75 in -[Ca2+]cyt, n = 47 in GdCl3 and n = 60 in GSMTx4, N = 3 IE). b Normalized NETs (Static: n = 42 RSFV in control, n = 40 in -[Ca2+]ext, n = 11 in RR, n = 15 in GSMTx4 and n = 9 for BAPTA. Shear: n = 30 in control, n = 34 in -[Ca2+]ext, n = 11 in RR, n = 16 in GSMTx4 and n = 8 in BAPTA, N = 3 IE), and c H3 citrullination in response to shear of 80 dyne/cm2 in the presence or absence of EGTA (2 mM), RR (30 µM), GaCl3 (30 µM), GsMTx4 (20 µM), Thapsigargin (1 µM), and BAPTA (10 µM) (Static: n = 27 RSFV in control, n = 41 in -[Ca2+]ext, n = 18 in RR, n = 26 in GSMTx4 and n = 25 in BAPTA. Shear: n = 11 in control, n = 32 in -[Ca2+]ext, n = 9 in RR, n = 9 in GSMTx4 and n = 12 for BAPTA, N = 3 IE). d Immunofluorescence images of neutrophils stained with Piezo1 and DAPI. e Western blot of neutrophils probed for Piezo1 and GAPDH in two different donors. f Representative microscopy images and (g, h) change in [Ca2+]I in response to Yoda1 (g is representative time response of f, n = 30 cells in shear and n = 60 cells in static.) (h n = 79 cells, N = 3 IE). i Normalized NET area (n = 20 RSFV, N = 4 IE) and j percentage of cells with H3 citrullination (n = 20 RSFV, N = 4 IE) and k Net area covered by platelets (n = 23 RSFV in control and n = 24 in Yoda1, N = 6 IE). a and h are analyzed using one-way ANOVA and mixed effects test. b and c are analyzed using two-way ANOVA and multiple comparisons test. i and k are analyzed using two-tailed Student’s T test. In ac and hk box plots depict the 25th percentile, the median and the 75th percentile, with minimum to maximum whiskers. Error bars in g is standard error.
Fig. 5
Fig. 5. Shear induced calpain activity downstream of Piezo1 mediates NETosis.
a, b Calpain activity (N = 3 IE); and c Normalized NET area (n = 20 RSFV in control, PD150606 and PD151746 and n = 19 in PD145305, N = 4 IE). a and b are analyzed using one-way ANOVA and mixed effects test. c is analyzed using two-way ANOVA and multiple comparisons test. Box plots depict the 25th percentile, the median and the 75th percentile, with minimum to maximum whiskers.
Fig. 6
Fig. 6. Piezo1 is essential for shear-induced NETosis in dHL-60 cells.
ac Representative fluorescent images and bar graphs showing the degree of NETosis and H3 citrullination (H3-Cit) in dHL-60 cells under static conditions or after shear stimulation in the presence or absence of GsMTX4. Red arrows in a showing NET release. (b: n = 30 RSFV from N = 6 IE) (c: n = 30 in static and GSMTX4/shear and n = 28 in shear from N = 6 IE). d Confocal images; and e Western blot of dHL-60 cells probed for Piezo1. f Bar graph showing the elevation in [Ca2+]i of dHL-60 cells in response to shear and Yoda1 (control: n = 65 cells in static and n = 79 cells in shear groups, Yoda1: n = 57 cells in static and n = 78 cells in shear group selected from N = 3 IE). g Confocal images and h bar graphs showing the degree of Piezo1 knockdown in dHL-60 cells treated with Piezo1 siRNA compared to the group treated with non-targeting siRNA. (n = 85 cells in Piezo1 siRNA and n = 67 cells in non-targeting siRNA analyzed across N = 3 IE). i qPCR data confirming the knockdown of Piezo1 in HL60 cells treated with Piezo1 compared to non-targeting siRNA. (N = 3 IE in non-targeting and N = 4 IE in Piezo1 siRNA group). b and c are analyzed using one way ANOVA and mixed effects analysis. f is analyzed using two-way ANOVA and multiple comparisons test. h and i are analysed using two-tailed Student’s T test. In b, c, f, h, i plots depict the 25th percentile, the median and the 75th percentile, with minimum to maximum whiskers.
Fig. 7
Fig. 7. Knockdown of Piezo1 in dHL-60 cells blocks the capacity of neutrophils to form NETs.
a Representative confocal images and (b, c) bar graphs showing the degree of NETosis and H3 citrullination in dHL-60 cells treated with Piezo1 or non-targeting siRNA, stained with DAPI (blue) and H3 antibody (green) in response to shear. (b, Static: n = 28 RSFV and Shear: n = 31 RSFV in non-targeting and n = 40 RSFV in Piezo1 siRNA group selected from N = 4 IE) (c, Static: n = 37 RSFV in non-targeting and n = 40 RSFV in Piezo1 siRNA and shear: n = 26 RSFV in non-targeting and n = 40 in Piezo1 siRNA from N = 4 IE). b and c is analyzed using two-way ANOVA and multiple comparisons test. b and c box plots depict the 25th percentile, the median and the 75th percentile, with minimum to maximum whiskers.
Fig. 8
Fig. 8. Actin cytoskeleton rearrangement is required for NET formation in response to shear stress.
Graphs show (a) the normalized NET area and (b) H3 citrullination of neutrophils pretreated with ML-7 or Latrunculin B under static conditions or shear stress. (Static: n = 20 RSFV in control and ML-7 and n = 16 RSFV in latrunculin B and shear stress: n = 20 RSFV in control and Latrunculin B and n = 18 RSFV in ML-7 group selected from N = 4 IE). c Representative tracks of neutrophils under static conditions or pretreatment with shear stress and summary graphs showing: d Track length (n = 45 cells that were present during the time course of the experiment analysed from N = 3 IE); and e Speed of neutrophils under static or shear stress conditions. (n = 150 randomly selected cells analyzed across N = 3 IE). f Representative confocal images of neutrophils exposed to shear stress for different duration of time and stained with Alexa Fluor 488 DNase I to label G-actin (green) and Alexa Fluor 568 phalloidin to label F-actin (red). Representative graphs showing the intensity of (g) F- actin, (h) G-actin and (i) F/G actin ratios (n = 39 RSFV from N = 4 IE). j Representative tracks of neutrophils in the presence or absence of Yoda1 and pretreatment with PD150606 and PD151746, and summary graphs showing: k Track length (n = 60 cells in vehicle, n = 75 in Yoda-1 and n = 45 in PD150606 and PD151746 randomly selected cells that were present during the time course of the experiment from N = 3 IE); and l Speed (n = 141 cells randomly selected from N = 3 IE). Data in a and b is analyzed using two-way ANOVA and multiple comparisons test. d and e are analyzed using two-tailed Student’s T-test. gi, k and l are analyzed using one-way ANOVA and mixed effects analysis. In a, b, d, e, g–i, k and l box plots depict the 25th percentile, the median and the 75th percentile, with minimum to maximum whiskers.
Fig. 9
Fig. 9. Summary diagram showing the proposed mechanisms of and contributors to Piezo1-mediated shear-induced NETosis.
Piezo1-mediated calcium influx in response to shear stress activates calpain, leading to cytoskeletal remodelling and the regulation of increased motility and NETosis in neutrophils. (Image created with BioRender.com released under a Creative Commons Attribution-NonCommercial-NoDerivs 4.0 International license).

References

    1. Mayadas, T. N., Cullere, X. & Lowell, C. A. The multifaceted functions of neutrophils. Annu. Rev. Pathol.9, 181–218 (2014). 10.1146/annurev-pathol-020712-164023 - DOI - PMC - PubMed
    1. Döring, Y., Soehnlein, O. & Weber, C. Neutrophils Cast NETs in Atherosclerosis. Circ. Res.114, 931–934 (2014). 10.1161/CIRCRESAHA.114.303479 - DOI - PubMed
    1. Castanheira, F. V. S. & Kubes, P. Neutrophils and NETs in modulating acute and chronic inflammation. Blood133, 2178–2185 (2019). 10.1182/blood-2018-11-844530 - DOI - PubMed
    1. Coughlin, M. F. & Schmid-Schönbein, G. W. Pseudopod projection and cell spreading of passive leukocytes in response to fluid shear stress. Biophys. J.87, 2035–2042 (2004). 10.1529/biophysj.104.042192 - DOI - PMC - PubMed
    1. Fukuda, S. et al. Mechanisms for regulation of fluid shear stress response in circulating leukocytes. Circ. Res86, E13–E18 (2000). 10.1161/01.RES.86.1.e13 - DOI - PubMed

LinkOut - more resources