. 2024 Aug 22;10(1):152.
doi: 10.1038/s41531-024-00763-6.

Neuroprotection of low dose carbon monoxide in Parkinson's disease models commensurate with the reduced risk of Parkinson's among smokers

Affiliations

Neuroprotection of low dose carbon monoxide in Parkinson's disease models commensurate with the reduced risk of Parkinson's among smokers

K N Rose et al. NPJ Parkinsons Dis. .

Abstract

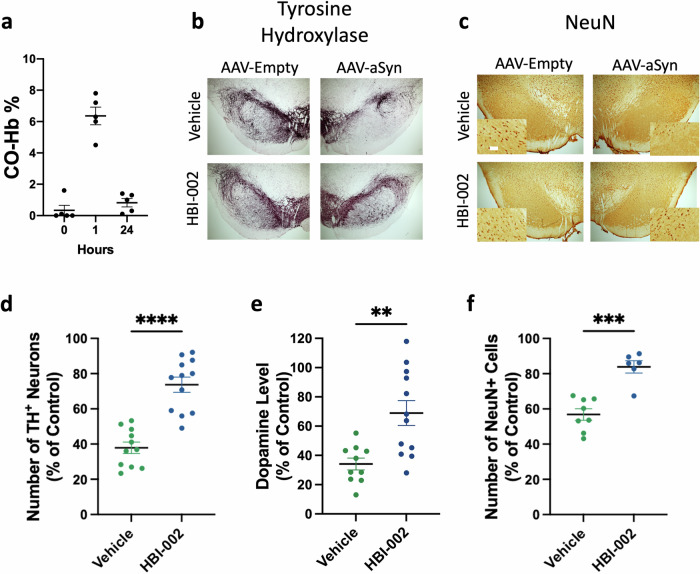
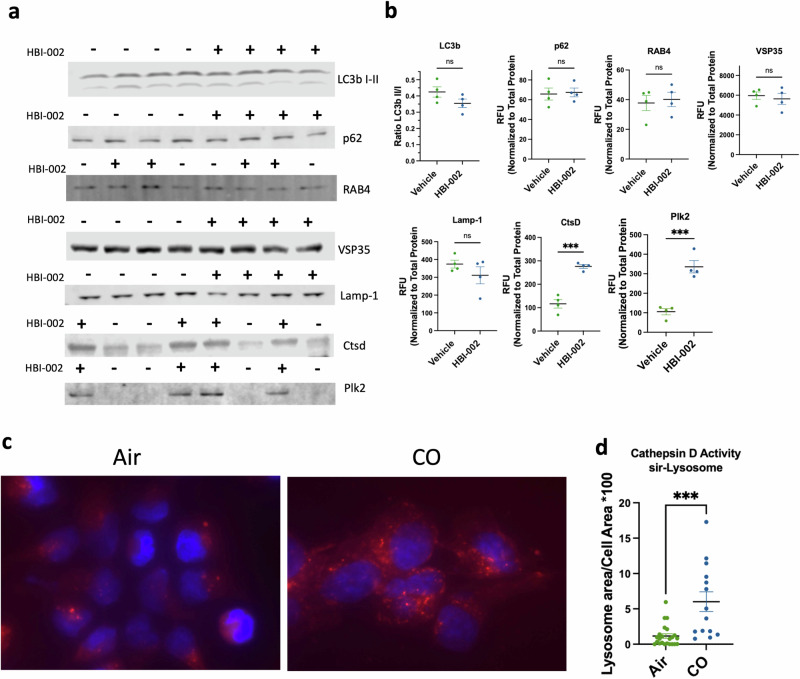
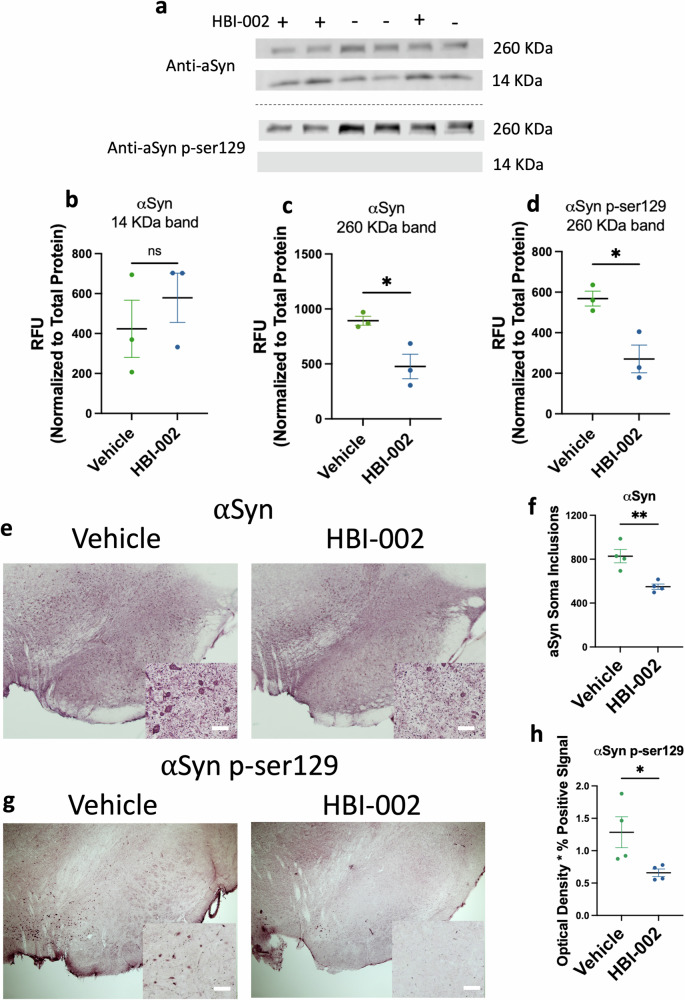
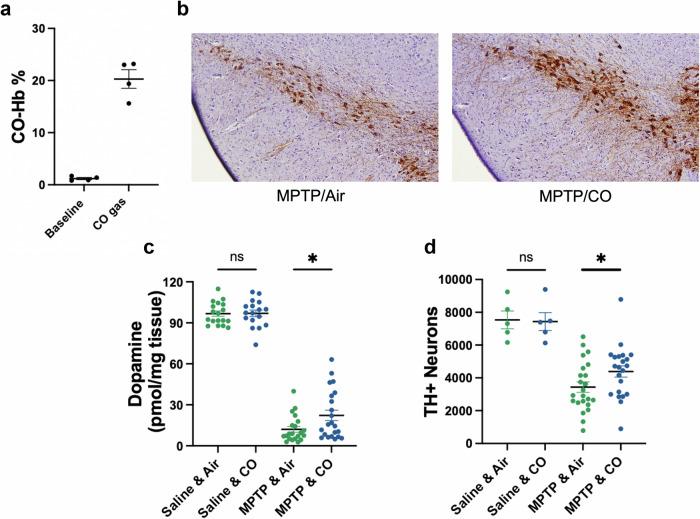
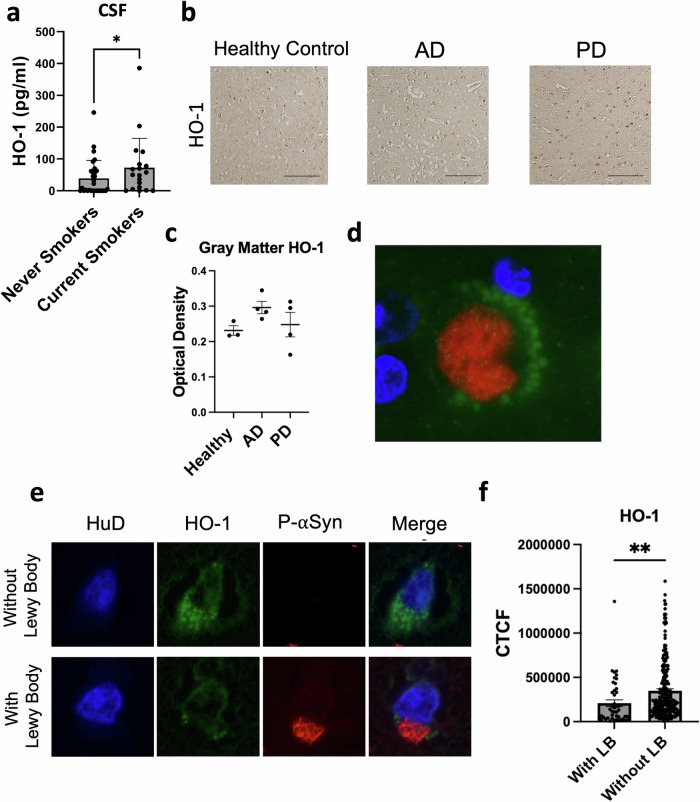
Paradoxically, cigarette smoking is associated with a reduced risk of Parkinson's Disease (PD). This led us to hypothesize that carbon monoxide (CO) levels, which are constitutively but modestly elevated in smokers, might contribute to neuroprotection. Using rodent models of PD based on α-synuclein (αSyn) accumulation and oxidative stress, we show that low-dose CO mitigates neurodegeneration and reduces αSyn pathology. Oral CO administration activated signaling cascades mediated by heme oxygenase-1 (HO-1), which have been implicated in limiting oxidative stress, and in promoting αSyn degradation, thereby conferring neuroprotection. Consistent with the neuroprotective effect of smoking, HO-1 levels in cerebrospinal fluid were higher in human smokers compared to nonsmokers. Moreover, in PD brain samples, HO-1 levels were higher in neurons without αSyn pathology. Thus, CO in rodent PD models reduces pathology and increases oxidative stress responses, phenocopying possible protective effects of smoking evident in PD patients. These data highlight the potential for low-dose CO-modulated pathways to slow symptom onset and limit pathology in PD patients.


Conflict of interest statement

Stephen Gomperts is an inventor on a patent application (application number PCT/US20/36433, application filed). The remaining authors declare no competing interests.

Figures

Fig. 1
Fig. 1. HBI-002, an oral formulation of carbon monoxide (CO), protects against human mutant A53T alpha-synuclein (aSyn) neurotoxicity.
The left substantia nigra (SN) received AAV1/2-CMV-empty vector-WPRE-BGH-polyA (Control); the right SN received AAV1/2-CMV-human-A53T-alpha-sunuclein-WPRE-BGH-polyA. a Pharmacokinetics of CO-Hb% in blood before, 1 hour after, and 24 hours after a dose of HBI-002 (10 mL/kg). b Representative photomicrographs of tyrosine hydroxylase (TH) in the SN. c Representative photomicrographs of NeuN in the SN. Scale bar, 20 μm. d Quantification of TH+ cells in the SN. Vehicle N = 11, HBI-002 N = 12, T-test, 1-β = 0.99, P = 0.0001. e Quantification of striatal dopamine by HPLC-ECD. Vehicle N = 10, HBI-002 N = 12, T-test, 1-β = 0.92, P = 0.0024. f Quantification of NeuN+ cells in the SN. Vehicle N = 8, HBI-002 N = 6, T-test, 1-β = 0.99, P = 0.001. Error bars represent the mean ± SEM. AAV, adeno-associated virus. Data are statistically different from each other with ** P < 0.01; *** P < 0.001; **** P < 0.0001.
Fig. 2
Fig. 2. HBI-002 effects on autophagy, lysosomes and cathepsin D.
a Immunoblots of autophagy and lysosomal activity markers. b Quantification of autophagy and lysosomal activity markers. Ctsd (p = 0.002, 1-β = 0.99, N = 8, 4 per group) and Plk2 (p = 0.006, 1-β = 0.99, N = 8, 4 per group), all other markers p > 0.05. c Representative photomicrographs of sir-lysosome staining in SH-SY5Y human neuroblastomas. d Quantification of sir-lysosome staining p = 0.0002, 1-β = 0.95, N = 38 cells, air treated n = 23, CO-treated n = 14. Error bars represent the mean ± SEM. Data are statistically different from each other with *** P < 0.001.
Fig. 3
Fig. 3. HBI-002 modulates αSyn pathology in an AAV-A53T model of PD.
a Immunoblots of αSyn and pSer129-αSyn (260 KDa and 14 KDa). b Quantification of 14 KDa band of αSyn. P = 0.69, 1-β = 0.13, N = 6, 3 per group. c Quantification of 260 KDa band of pSer129-αSyn. P = 0.02, 1-β = 0.88, N = 6, 3 per group. d Quantification of 260 KDa band of pSer129-αSyn. P = 0.0014, 1-β = 0.81, N = 6, three per group. e Representative photomicrographs of αSyn immunoreactivity in the SN. Scale bar, 20 μm. f Quantification of aSyn+ cells in the SN, values reflect the number of counted cells. P = 0.02, 1-β = 0.94, N = 8 (4 per group). g Representative photomicrographs of pSer129-αSyn immunoreactivity in the SN. h Quantification of pSer129-aSyn. P = 0.044, 1-β = 0.56, N = 8, four per group. Error bars represent the mean ± SEM. Data are statistically different from each other with * P < 0.05; ** P < 0.01.
Fig. 4
Fig. 4. Carbon monoxide protects against MPTP induced neurotoxicity in the SN.
a Concentration of CO-Hb in blood at baseline and after 1 hour of CO gas exposure (200 ppm at 1 L/min). b Representative photomicrographs of TH immunoreactivity in the SN, counterstained with hematoxylin QS. c HPLC-ECD quantification of striatal dopamine content. Number of animals: Saline & air n = 18, Saline & CO n = 17, 1-β = 0.05, P = 0.93. MPTP & air n = 21, MPTP & CO n = 22. 1-β = 0.61, P = 0.027. d Quantification of TH-positive cells in the SNpc. Number of animals: Saline & air=5, Saline & CO = 5, 1-β = 0.05, P = 0.90. MPTP & air n = 23, MPTP & CO n = 22, 1-β = 0.50, P = 0.04. Error bars represent the mean ± SEM. MPTP, 1-methyl-4-phenyl-1,2,3,6-tetrahydropyridine. Data are statistically different from each other with * P < 0.05.
Fig. 5
Fig. 5. Carbon monoxide increases HO-1 in association with increased HIF-1α signaling.
a Quantification of HO-1 by ELISA, P = 0.043, 1-β = 0.47, N = 8 (4 per group). b Immunoblots of nuclear HIF-1α. c Quantification of nuclear HIF-1α P = 0.024, 1-β = 0.70, N = 8 (4 per group). Error bars represent the mean ± SEM. Data are statistically different from each other with * P < 0.05.
Fig. 6
Fig. 6. HO-1 in human samples.
a HO-1 levels in cerebrospinal fluid (CSF) samples of smokers and nonsmokers without neurodegenerative disease, Wilcoxon one-tailed * P = 0.040, N = 49 (30 never smokers, 19 current smokers). b Representative photomicrographs of HO-1 immunoreactivity in the anterior cingulate of unaffected controls or patients with AD or PD. Scale bar, 50 μm. c Quantification of HO-1 immunoreactivity in gray matter of the anterior cingulate, P > 0.05, 1-β = 0.10 (3 healthy patients, 4 AD patients, 4 PD patients). d Illustrative photomicrograph of HO-1 (green) in close association with a Lewy body (pSer129-αSyn, red) with DAPI nuclear counterstain (blue). e Representative photomicrographs of HO-1 in cells with and without Lewy bodies. Cells were co-stained for the neuronal-specific marker HuD (pseudocolored blue). f Quantification of HO-1 in PD samples in HuD-positive cells with and without Lewy bodies, **two-tailed P = 0.0002, 1-β = 0.83, N = 279 HuD+ cells (46 with Lewy bodies, 233 without Lewy bodies) across 4 patients. CTCF: corrected total cell fluorescence (arbitrary units).

Update of

References

    1. Power, J. H. T., Barnes, O. L. & Chegini, F. Lewy Bodies and the Mechanisms of Neuronal Cell Death in Parkinson’s Disease and Dementia with Lewy Bodies. Brain Pathol. Zurich Switz27, 3–12 (2017).10.1111/bpa.12344 - DOI - PMC - PubMed
    1. Fratiglioni, L. & Wang, H.-X. Smoking and Parkinson’s and Alzheimer’s disease: review of the epidemiological studies. Behav. Brain Res.113, 117–120 (2000). 10.1016/S0166-4328(00)00206-0 - DOI - PubMed
    1. Gallo, V. et al. Exploring causality of the association between smoking and Parkinson’s disease. Int. J. Epidemiol.48, 912–925 (2019). - PMC - PubMed
    1. Tsuang, D. et al. Association between lifetime cigarette smoking and lewy body accumulation. Brain Pathol. Zurich Switz20, 412–418 (2010).10.1111/j.1750-3639.2009.00296.x - DOI - PMC - PubMed
    1. Villafane, G. et al. High-dose transdermal nicotine in Parkinson’s disease patients: a randomized, open-label, blinded-endpoint evaluation phase 2 study. Eur. J. Neurol.25, 120–127 (2018). 10.1111/ene.13474 - DOI - PubMed

LinkOut - more resources