. 2024 Aug 22;15(1):7241.
doi: 10.1038/s41467-024-51683-1.

Alveolar epithelial cells mitigate neutrophilic inflammation in lung injury through regulating mitochondrial fatty acid oxidation

Affiliations

Alveolar epithelial cells mitigate neutrophilic inflammation in lung injury through regulating mitochondrial fatty acid oxidation

Kuei-Pin Chung et al. Nat Commun. .

Abstract

Type 2 alveolar epithelial (AT2) cells of the lung are fundamental in regulating alveolar inflammation in response to injury. Impaired mitochondrial long-chain fatty acid β-oxidation (mtLCFAO) in AT2 cells is assumed to aggravate alveolar inflammation in acute lung injury (ALI), yet the importance of mtLCFAO to AT2 cell function needs to be defined. Here we show that expression of carnitine palmitoyltransferase 1a (CPT1a), a mtLCFAO rate limiting enzyme, in AT2 cells is significantly decreased in acute respiratory distress syndrome (ARDS). In mice, Cpt1a deletion in AT2 cells impairs mtLCFAO without reducing ATP production and alters surfactant phospholipid abundance in the alveoli. Impairing mtLCFAO in AT2 cells via deleting either Cpt1a or Acadl (acyl-CoA dehydrogenase long chain) restricts alveolar inflammation in ALI by hindering the production of the neutrophilic chemokine CXCL2 from AT2 cells. This study thus highlights mtLCFAO as immunometabolism to injury in AT2 cells and suggests impaired mtLCFAO in AT2 cells as an anti-inflammatory response in ARDS.


Conflict of interest statement

A.M.K.C. is a cofounder and equity stockholder for Proterris, which develops therapeutic uses for CO. A.M.K.C. has a use patent on CO. Additionally, A.M.K.C. has patents in chronic obstructive pulmonary disease (US Patent 10905682). M.P. participates an advisory board meeting for InflaRx. All the other authors declare no competing interests.

Figures

Fig. 1
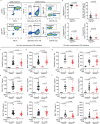
Fig. 1. mtLCFAO is decreased in AT2 cells in human and murine ALI.
a Representative results of immunohistochemistry staining for CPT1a, long-chain acyl-CoA dehydrogenase (LCAD), and cytokeratin (CK) using surgical sections from control and diffuse alveolar damage (DAD) donors (scale bar = 50 μm). b, c The alveolar epithelial levels of CPT1a (b) and LCAD (c) are semi-quantified using the H scores (control n = 18, DAD n = 27; the line indicates median; two-sided p values are calculated by Mann–Whitney U tests). d Expression of fatty acid β-oxidation pathway (GO: 0006635) in AT2 cells in ARDS is analyzed using human lung single-cell RNA sequencing datasets from people with fatal COVID-19 and controls (GSE171524, GSE171668). Expression score for each cell is calculated by averaging the expression of the gene involved in the fatty acid β-oxidation pathway, and the comparison between groups is exhibited using violin plots. Two-sided p values are calculated using Mann–Whitney U tests. e AT2 cells from SftpcCreERt2+/ mice instilled with LPS or ddH2O are isolated for extracellular flux analyses using palmitate alone or after etomoxir pretreatment (Oligo oligomycin, Rot rotenone, AA antimycin A). f Oxygen consumption rates (OCRs) for ATP production are then calculated (palmitate alone, n = 8 replicates per group; palmitate with etomoxir pretreatment, n = 10 replicates per group; both are representative data from two independent experiments). e, f Data are represented as mean ± SEM, and f two-sided p values are calculated by unpaired Student’s t-tests.
Fig. 2
Fig. 2. Targeted deletion of Cpt1a in AT2 cells impairs mtLCFAO.
a The immunoblot shows CPT1a and LCAD expression in different cellular populations selected from single-cell suspensions using anti-CD45 and anti-EpCAM (representative data of two independent experiments). b A scheme showing the generation of transgenic mice with tamoxifen-inducible AT2 cell-specific Cpt1a deletion. c Immunoblots of control and Cpt1a/ AT2 cells isolated 6 weeks after tamoxifen injection (n = 3 mice per group; representative data of two independent experiments). d Intracellular levels of carnitine (C0), palmitoylcarnitine (C16), and stearoylcarnitine (C18) are measured for calculating C0/(C16 + C18) ratio in AT2 cells (n = 5 mice per group; representative data of two independent experiments). eh Extracellular flux analyses (e) with palmitate alone (Oligo oligomycin, Rot rotenone, AA antimycin A) or g after etomoxir pretreatment in AT2 cells, and oxygen consumption rates (OCRs) f, h are calculated (palmitate, n = 9 replicates per group; palmitate/etomoxir, control n = 7 replicates, Cpt1a/ n = 8 replicates; representative data of two independent experiments). dh Data are represented as mean ± SEM, and d, f, h two-sided p values are calculated by unpaired Student’s t-tests.
Fig. 3
Fig. 3. AT2 cell deficient in CPT1a maintain ATP production by utilizing substrates other than glucose.
a Intracellular ATP levels in the control and Cpt1a/ AT2 cells (n = 5 mice per group). b, c Extracellular flux analyses (b) with glucose (Glu), pyruvate (Pyr), and glutamine (Gln) in AT2 cells, and OCRs (c) are calculated (n = 9 per group; representative data of two independent experiments). d, e Glycolysis stress tests (d) in AT2 cells (2DG, 2-deoxyglucose), and e extracellular acidification rates (ECARs) are calculated (n = 10 replicates per group; representative data of two independent experiments). fk Extracellular flux analyses with (f) glutamine alone, h pyruvate alone, or j both pyruvate and glutamine in AT2 cells, and OCRs for ATP production using (g) glutamine alone (control n = 10 replicates, Cpt1a/ n = 9 replicates), i pyruvate alone (n = 10 replicates per group), or k both pyruvate and glutamine (control, n = 9 replicates, Cpt1a/, n = 7 replicates) are calculated (fk), all are representative data of two independent experiments. l A cartoon illustrating the metabolic adaptations in Cpt1a/ AT2 cells (TCA tricarboxylic acid, OXPHOS oxidative phosphorylation). ak Data are represented as mean ± SEM, and a, c, e, g, I, k two-sided p values are calculated by unpaired Student’s t-tests.
Fig. 4
Fig. 4. CPT1a deficiency upregulates phospholipid synthesis in AT2 cells.
a, b Flow cytometric analyses (a) evaluating phospholipid synthesis in Cpt1a/ and control MLE12 cells. The geometric mean fluorescent intensity (MFI) of phospholipid labeling (b) represents phospholipid synthesis activity (n = 3 replicates per group; representative data of two independent experiments). ce Immunoblots (c) confirming CPT1a overexpression in Cpt1aOE MLE12 cells, generated through lentiviral transduction (control MLE12 cells generated through lentiviral transduction of empty construct; representative data of two independent experiments). d Flow cytometric analyses evaluating phospholipid synthesis assay of Cpt1aOE and control MLE12 cells, and I phospholipid synthesis activity is compared (n = 3 replicates per group; representative data of two independent experiments). f, g Flow cytometric analyses (f) evaluating phospholipid synthesis in AT2 cells, and the phospholipid synthesis activity (g) is compared (n = 3 replicates per group; representative data of two independent experiments). h, i Intracellular contents of PC and phosphatidylglycerol (PG) species in AT2 cells, and data of the top 5 abundant h PC and i PG species are shown (n = 12 mice per group; data represent results of two independent experiments). j, k The contents of PC and PG species in bronchoalveolar lavage fluid (BALF) samples, and data of the top five abundant j PC and k PG species are demonstrated (control mice n = 10, Cpt1aiΔAT2 mice n = 9; data represent results of two independent experiments). b, e, g, and hk Data are represented as mean ± SEM, and b, e, gk two-sided p values are calculated by unpaired Student’s t-tests (hk, only p values less than 0.05 are shown).
Fig. 5
Fig. 5. CPT1a deficiency in AT2 cells resolves alveolar inflammation in ALI.
a, b At 24 h after intratracheal LPS instillation, flow cytometric analyses (a) are performed to evaluate (b) the percentages of various immune cells, including alveolar macrophages (CD11c+SiglecF+), neutrophils (CD11cLy6G+), eosinophils (CD11cLy6GCD3SiglecF+), and T lymphocytes (CD11cLy6GCD3+SiglecF), in the CD45.2+ cell population in bronchoalveolar lavage fluid (BALF) (control mice n = 20, Cpt1aiΔAT2 mice n = 16; results of two independent experiments). ch BALF samples are collected at 24 h (c, d, g) and 72 h (e, f, h). The c, e total cell number and the level of d, f protein and g, h various cytokines/chemokines, including CXCL1, CXCL2, tumor necrosis factor (TNF) α, and interleukin (IL) 6, in BALF are measured (data at 24 h: control mice, c, d n = 8 g n = 4 for ddH2O, c, d, g n = 47 for LPS; Cpt1aiΔAT2 mice, c, d n = 7 g n = 3 for ddH2O, LPS c, d, g n = 35 for LPS; results of four independent experiments; e, f, h data at 72 h: control mice, n = 4 for ddH2O, n = 27 for LPS; Cpt1aiΔAT2 mice, n = 4 for ddH2O, n = 33 for LPS; results of two independent experiments). b, ch Data are represented as mean ± SEM, and two-sided p values are calculated by (b) unpaired Student’s t-tests or ch one-way ANOVA with Bonferroni correction.
Fig. 6
Fig. 6. Alveolar inflammation regulated by Cpt1a-deficient AT2 cells is not through altered alveolar PG species.
a A cartoon illustrating the investigation for the link between altered baseline alveolar PG compositions in Cpt1aiΔAT2 mice and the immuno-modulation in ALI. bf Measuring levels of free fatty acid (FFA), PG, and lysophosphatidylglycerol (LPG) species in bronchoalveolar lavage fluid (BALF) samples. Lipidomic analyses are performed to measure PG and LPG compositions in BALF, and the total measured PG species (b), the top 5 abundant PG species (c) and the ratios of LPG to PG (d) in BALF are compared (control mice, n = 4 for ddH2O, n = 24 for LPS; Cpt1aiΔAT2 mice, n = 4 for ddH2O, n = 20 for LPS; results of two independent experiments). e Free fatty acid (FFA) levels are measured in BALF samples at 24 h after instillation (control mice, n = 4 for ddH2O, n = 23 for LPS; Cpt1aiΔAT2 mice, n = 3 for ddH2O, n = 15 for LPS; results of two independent experiments). f The contents of the top 5 abundant LPG species in BALF samples at 24 h after LPS instillation are demonstrated and compared (control mice, n = 24, Cpt1aiΔAT2 mice, n = 20; results of two independent experiments). g An experimental schema showing intratracheal instillation of LPS with solvent, PG(32:0)_16:0 (~1.5 mM), or PG(34:1)_18:1 (~1.5 mM) to induce ALI with obliteration of alveolar phospholipidomic differences of specific PG species at baseline. BALF samples are collected 24 h after the induction of ALI. hl The BALF (h) cell number and levels of i protein, j CXCL1, k CXCL2, and l TNFα are measured and compared (control mice, n = 16 for solvent, n = 10 for PG(32:0)_16:0, and n = 10 for PG(34:1)_18:1; Cpt1aiΔAT2 mice, n = 16 for solvent, n = 10 for PG(32:0)_16:0, and n = 10 for PG(34:1)_18:1; results of three independent experiments). bf and hl Data are represented as mean ± SEM, and two-sided p values are calculated by (e) one-way ANOVA with Bonferroni correction or bd, f, hl unpaired Student’s t-tests (c and f, only p values less than 0.05 are shown).
Fig. 7
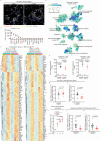
Fig. 7. Cpt1a deletion in AT2 cells decreases neutrophilic inflammation in ALI.
a At 24 h after LPS instillation to controltdTomatoAT2 mice, cryosections of lungs are obtained for staining of CD45, CXCL1, and CXCL2 and confocal microscopy (representative data from n = 7 mice; arrow, chemokine in AT2 cells; arrowhead, chemokine in immune cells; scale bar = 20 μm). b, c RNA sequencing (RNAseq) in control AT2 cells after LPS instillation (24 h). A functional enrichment map (b) plotted using genes differently expressed (an adjusted p < 0.01 and a fold change > 2) at baseline and in ALI. c The expression levels of cytokine and chemokine genes included in cytokine production (GO: 0001816) and leukocyte migration (GO: 0050900) annotations are demonstrated in transcript per million (TPM) (n = 4 mice for each group). d Heatmaps comparing the expression of genes involved in cytokine production and leukocyte migration annotations in control and Cpt1a/ AT2 cells (n = 4 mice for each group). The expression levels of e Cxcl1 and f Cxcl2 in AT2 cells are compared across the groups. g, h Quantitative polymerase chain reactions (qPCRs) measuring g Cxcl1 and h Cxcl2 expression in AT2 cells at 24 h after LPS instillation, using Tbp for normalization (data analyzed by 2ΔΔCt method; control n = 10 mice, Cpt1a/ n = 11 mice; results of four independent experiments). i After 6 h of tumor necrosis factor (TNF) α (2 nM) activation along with CXCL2 or not, Cxcl2 expression in bone marrow derived neutrophils is measured by qPCR (n = 4 replicates per group; representative data of three independent experiments). j, k qPCRs measuring Cxcl1 and Cxcl2 expression in alveolar neutrophils in ALI (control mice, n = 17, Cpt1aiΔAT2 mice, n = 14; results of three independent experiments). c, ek Data are represented as mean ± SEM, and two-sided p values are calculated by (e, f) linear modeling and empirical Bayes moderation, adjusted through the Benjamini–Hochberg procedures, g, h, j, k unpaired Student’s t-tests or i one-way ANOVA with Bonferroni correction. bf The details of RNAseq analyses are described in “Methods” section.
Fig. 8
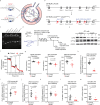
Fig. 8. Impaired mtLCFAO in AT2 cells by deleting Acadl protects against alveolar inflammation in ALI.
a A scheme showing the hypothesis that mtLCFAO in AT2 cells regulates alveolar neutrophilic inflammation in ALI. b The genomic design of AcadlloxP/loxP mice. c Representative genotyping results confirm the successful insertion of loxP sequences in introns 1, 4, and 5 of the Acadl gene in AcadlloxP/loxP mice. d An experimental scheme to induce Acadl deletion in AT2 cells through tamoxifen injection and to investigate whether AT2 cell-specific deletion of Acadl decreases alveolar inflammation in LPS-induced ALI. e An immunoblot showing successful depletion of LCAD, encoded by Acadl, in AT2 cells at 6 weeks after tamoxifen injection (n = 3 mice per group; representative data of two independent experiments). f, g Extracellular flux analyses (f) with palmitate are performed in AT2 cells (Oligo oligomycin, Rot rotenone, AA antimycin A), and g oxygen consumption rates (OCRs) are calculated (n = 9 replicates for each group; representative data of two independent experiments). hk Quantitative polymerase chain reactions were used to measure the mRNA expression of h Acadl, i Cxcl1, j Cxcl2, and k Tnf in AT2 cells isolated 24 h after LPS instillation. The results are normalized to Tbp expression and analyzed using the 2ΔΔCt method (control mice, n = 15, AcadliΔAT2 mice, n = 8; results of four independent experiments). l, m At 72 h after LPS administration, cell number (l) and protein level (m) in BALF are measured (control mice, n = 17, AcadliΔAT2 mice, n = 9; results of two independent experiments). fm Data are represented as mean ± SEM, and gm two-sided p values are calculated by unpaired Student’s t-tests.

References

    1. Desai, T. J., Brownfield, D. G. & Krasnow, M. A. Alveolar progenitor and stem cells in lung development, renewal and cancer. Nature507, 190–194 (2014). 10.1038/nature12930 - DOI - PMC - PubMed
    1. Whitsett, J. A. & Alenghat, T. Respiratory epithelial cells orchestrate pulmonary innate immunity. Nat. Immunol.16, 27–35 (2015). 10.1038/ni.3045 - DOI - PMC - PubMed
    1. Treutlein, B. et al. Reconstructing lineage hierarchies of the distal lung epithelium using single-cell RNA-seq. Nature509, 371–375 (2014). 10.1038/nature13173 - DOI - PMC - PubMed
    1. Fan, L. C. et al. Alveolar type II epithelial cell FASN maintains lipid homeostasis in experimental COPD. JCI Insight8, e163403 (2023). 10.1172/jci.insight.163403 - DOI - PMC - PubMed
    1. Whitsett, J. A., Wert, S. E. & Weaver, T. E. Alveolar surfactant homeostasis and the pathogenesis of pulmonary disease. Annu. Rev. Med.61, 105–119 (2010). 10.1146/annurev.med.60.041807.123500 - DOI - PMC - PubMed

MeSH terms