

IAPP - oligomerisation levels in plasma of people with type 2 diabetes
- PMID: 39174611
- PMCID: PMC11341561
- DOI: 10.1038/s41598-024-70255-3
IAPP - oligomerisation levels in plasma of people with type 2 diabetes
Abstract
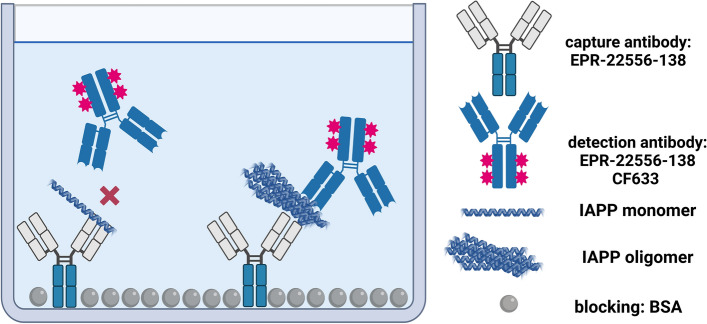
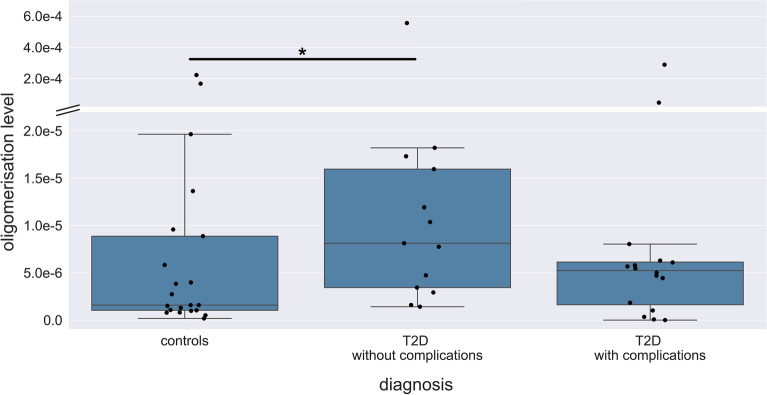
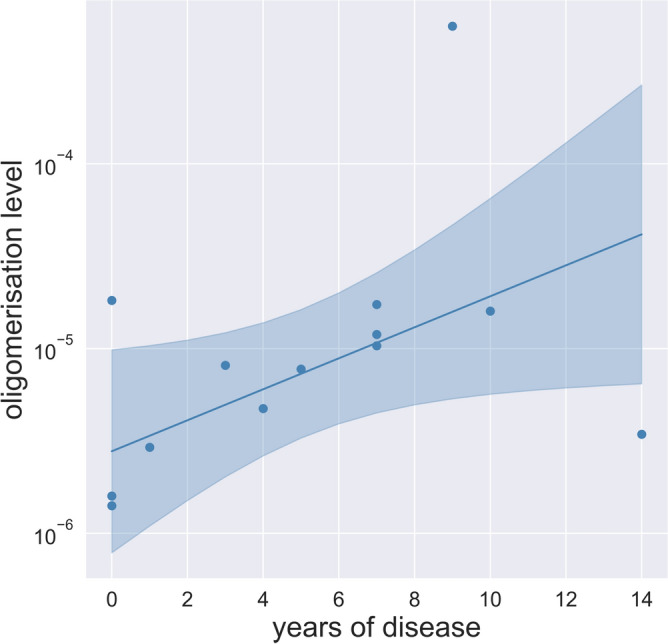
Islet amyloid polypeptide (IAPP) is co-secreted with insulin from pancreatic ß-cells. Its oligomerisation is regarded as disease driving force in type 2 diabetes (T2D) pathology. Up to now, IAPP oligomers have been detected in affected tissues. IAPP oligomer concentrations in blood have not been analysed so far. Using the IAPP single-oligomer-sensitive and monomer-insensitive surface-based fluorescence intensity distribution analysis (sFIDA) technology, levels of IAPP oligomers in blood plasma from healthy controls and people with T2D in different disease stages where determined. Subsequently, the level of IAPP oligomerisation was introduced as the ratio between the IAPP oligomers determined with sFIDA and the total IAPP concentration determined with ELISA. Highest oligomerisation levels were detected in plasma of people with T2D without late complication and without insulin therapy. Their levels stand out significantly from the control group. Healthy controls presented with the lowest oligomerisation levels in plasma. In people with T2D without complications, IAPP oligomerisation levels correlated with disease duration. The results clearly demonstrate that IAPP oligomerisation in insulin-naïve patients correlates with duration of T2D. Although a correlation per se does not identify, which is cause and what is consequence, this result supports the hypothesis that IAPP aggregation is the driving factor of T2D development and progression. The alternative and conventional hypothesis explains development of T2D with increasing insulin resistance causing exhaustion of pancreatic ß-cells due to over-secretion of insulin, and thus IAPP, too, resulting in subsequent IAPP aggregation and fibril deposition in the pancreas. Further experiments and comparative analyses with primary tissues are warranted.
Keywords: Diabetes; Disease driven protein expression; IAPP; Oligomers; sFIDA.
© 2024. The Author(s).
Conflict of interest statement
BS has none to declare. DW and OB are co-founder and co-owner of attyloid GmbH, which is commercializing the sFIDA technology. This did not influence any data interpretation. All the remaining authors declare no conflict of interest.
Figures
Similar articles
-
Causative factors for formation of toxic islet amyloid polypeptide oligomer in type 2 diabetes mellitus.Clin Interv Aging. 2015 Nov 19;10:1873-9. doi: 10.2147/CIA.S95297. eCollection 2015. Clin Interv Aging. 2015. PMID: 26604727 Free PMC article. Review.
-
TPE conjugated islet amyloid polypeptide probe for detection of peptide oligomers.Biophys Chem. 2024 Jan;304:107129. doi: 10.1016/j.bpc.2023.107129. Epub 2023 Oct 31. Biophys Chem. 2024. PMID: 37948788
-
Islet amyloid polypeptide in pancreatic islets from type 2 diabetic subjects.Islets. 2012 May-Jun;4(3):223-32. doi: 10.4161/isl.20477. Islets. 2012. PMID: 22847497 Free PMC article.
-
Dysregulation of cholesterol homeostasis is an early signal of β-cell proteotoxicity characteristic of type 2 diabetes.Physiol Genomics. 2024 Sep 1;56(9):621-633. doi: 10.1152/physiolgenomics.00029.2024. Epub 2024 Jul 1. Physiol Genomics. 2024. PMID: 38949617
-
Islet amyloid toxicity: From genesis to counteracting mechanisms.J Cell Physiol. 2022 Feb;237(2):1119-1142. doi: 10.1002/jcp.30600. Epub 2021 Oct 12. J Cell Physiol. 2022. PMID: 34636428 Review.
References
MeSH terms
Substances
Grants and funding
LinkOut - more resources
Full Text Sources
Medical
