

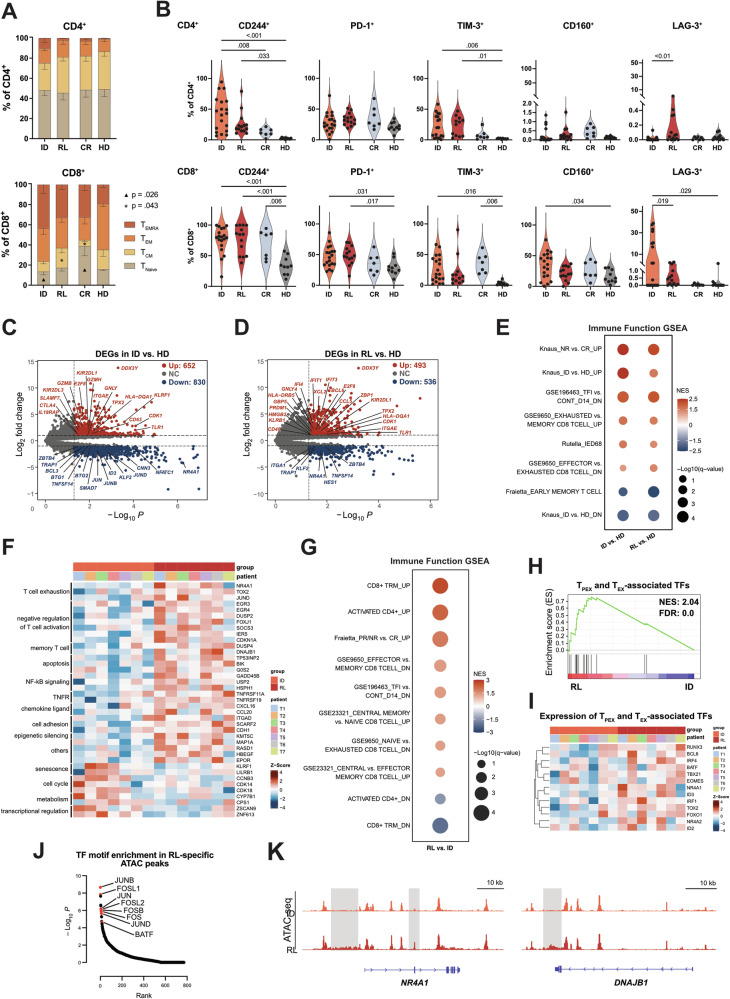
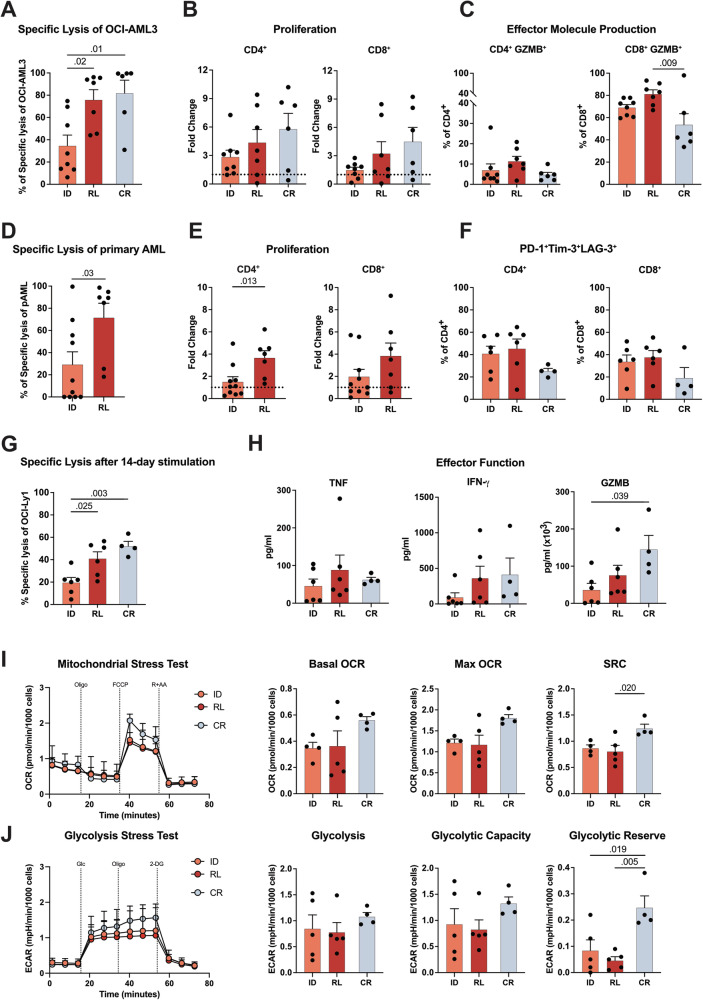
Evolution of T-cell fitness through AML progression: enhanced bispecific T-cell engager-mediated function of bone marrow T cells at remission compared to initial diagnosis and relapse
- PMID: 39174782
- PMCID: PMC11436353
- DOI: 10.1038/s41375-024-02387-4
Evolution of T-cell fitness through AML progression: enhanced bispecific T-cell engager-mediated function of bone marrow T cells at remission compared to initial diagnosis and relapse
Conflict of interest statement
MS has received industry research support from Amgen, BMS/Celgene, Gilead/Kite, Miltenyi Biotec, Molecular Partners, Morphosys, Novartis, Roche, Seattle Genetics, and Takeda, and has served as a consultant/scientific advisory board member at Autolus, AvenCell, CanCell Therapeutics, CDR-Life, Genmab US, Ichnos Sciences, Incyte Biosciences, Interius BioTherapeutics, Janssen, Millennium Pharmaceuticals, Miltenyi Biomedicine, Molecular Partners, Nektar Therapeutics, Novartis, Pfizer, Ridgeline Discovery, Sanofi, Scare, and Takeda. She serves on the speakers’ bureau at Amgen, AstraZeneca, BMS/Celgene, Gilead/Kite, GSK, Janssen, Novartis, Octapharma, Pfizer, Roche, Springer Healthcare, and Takeda. Educational grants were received to develop the app “MyTcell” from BMS, Gilead, Janssen, Novartis, Roche, and Takeda. VLB has received research funding from BMS, Gilead/Kite, Miltenyi Biotec, Novartis, and Roche, and has served as a consultant/advisor to Amgen, Gilead, Novartis, Pfizer, and Priothera. He serves on the speakers’ bureau at Novartis and Pfizer. RK is employed at Amgen Research Munich, Germany. ST has served as a consultant/advisor to Amgen, BMS, GSK, Janssen, Pfizer, Sanofi, and Takeda. TH has received industry research support from Roche and served as a scientific advisory board member to Servier. MK, AM (now employed by MLL Munich Leukemia Laboratory), NP, BB (now employed by Adivo), JJT (now employed by AstraZeneca), HDM (now employed by MundiCare), AT, BT, LR, YW, MW, A-JE, GM, KS, TS, and GS declare no relevant conflicts of interest. Correspondence: Marion Subklewe, Department of Medicine III, University Hospital, LMU Munich, Munich, Germany; e-mail: marion.subklewe@med.uni-muenchen.de.
Figures
References
Publication types
MeSH terms
Substances
Grants and funding
LinkOut - more resources
Full Text Sources
Medical
Molecular Biology Databases
