. 2024 Aug 22;22(1):503.
doi: 10.1186/s12951-024-02764-2.

Intranasal delivery of small extracellular vesicles reduces the progress of amyotrophic lateral sclerosis and the overactivation of complement-coagulation cascade and NF-ĸB signaling in SOD1G93A mice

Affiliations

Intranasal delivery of small extracellular vesicles reduces the progress of amyotrophic lateral sclerosis and the overactivation of complement-coagulation cascade and NF-ĸB signaling in SOD1G93A mice

Jinrui Zhou et al. J Nanobiotechnology. .

Abstract

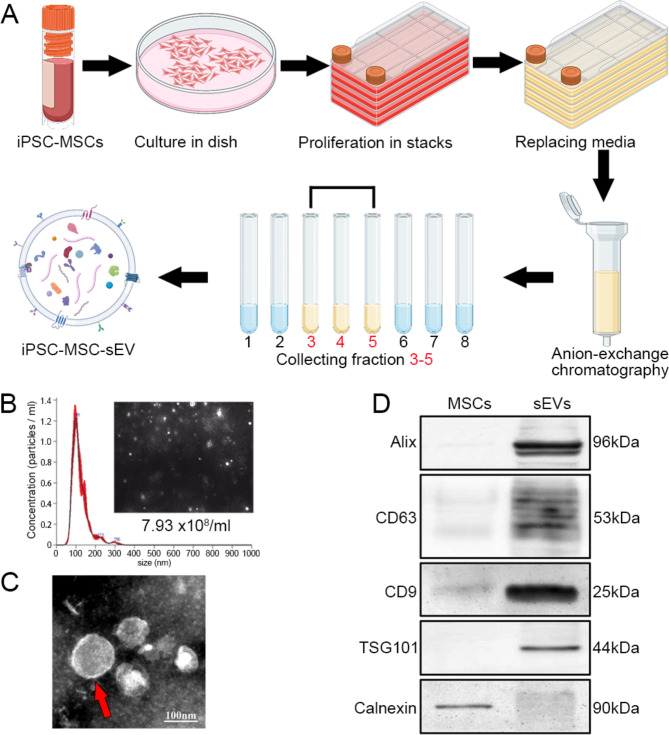
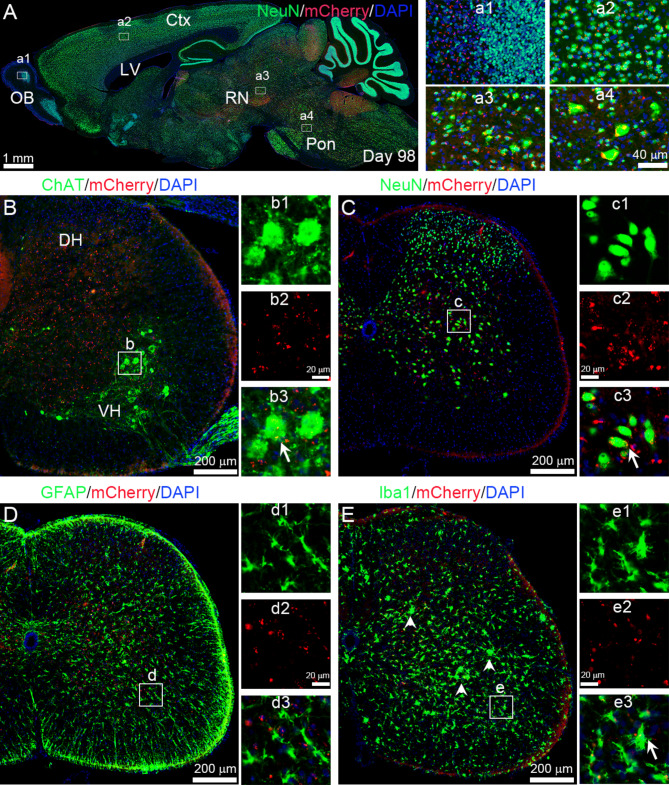
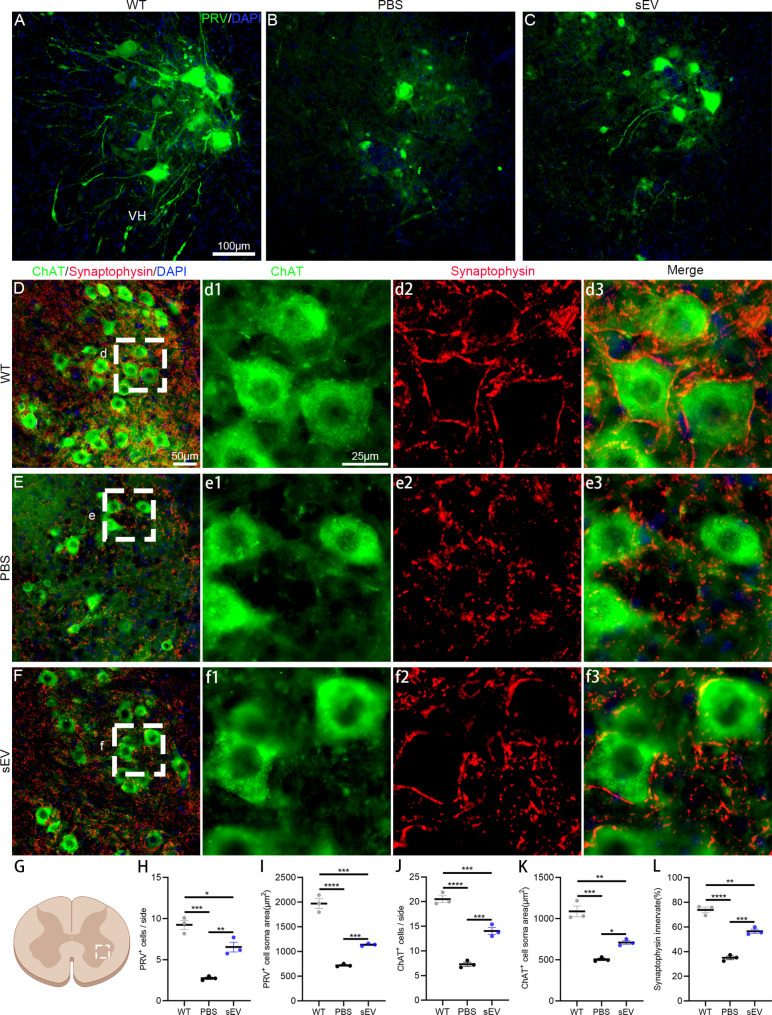
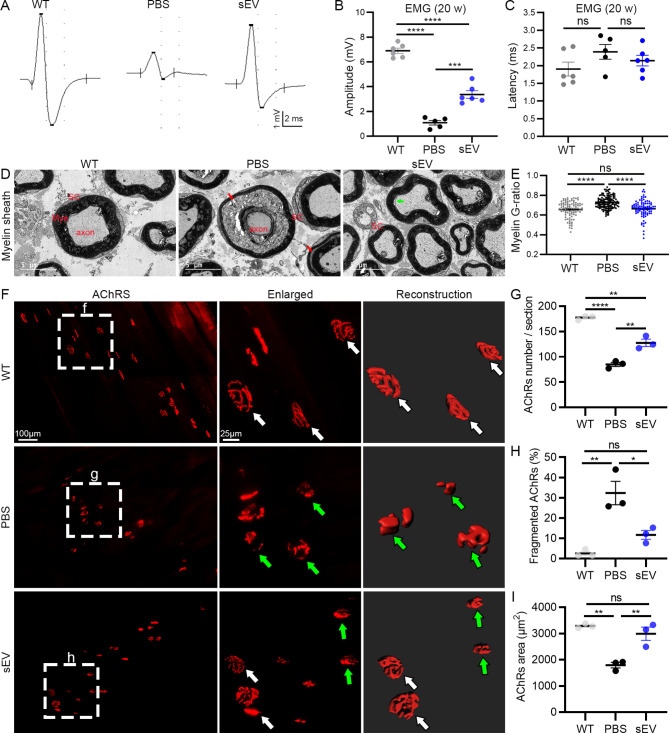
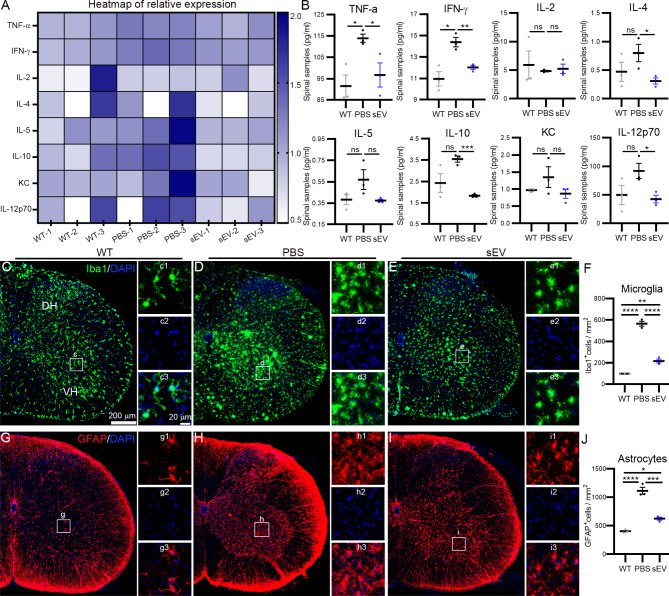
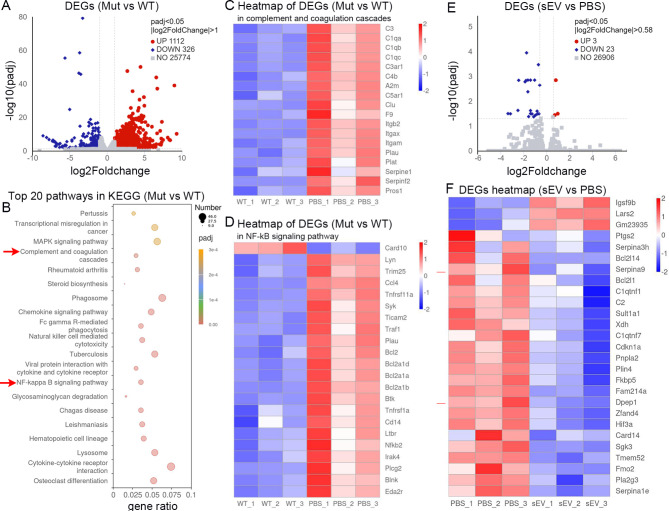
Amyotrophic lateral sclerosis (ALS) is a fatal disease characterized by progressive motoneuron degeneration, and effective clinical treatments are lacking. In this study, we evaluated whether intranasal delivery of mesenchymal stem cell-derived small extracellular vesicles (sEVs) is a strategy for ALS therapy using SOD1G93A mice. In vivo tracing showed that intranasally-delivered sEVs entered the central nervous system and were extensively taken up by spinal neurons and some microglia. SOD1G93A mice that intranasally received sEV administration showed significant improvements in motor performances and survival time. After sEV administration, pathological changes, including spinal motoneuron death and synaptic denervation, axon demyelination, neuromuscular junction degeneration and electrophysiological defects, and mitochondrial vacuolization were remarkably alleviated. sEV administration attenuated the elevation of proinflammatory cytokines and glial responses. Proteomics and transcriptomics analysis revealed upregulation of the complement and coagulation cascade and NF-ĸB signaling pathway in SOD1G93A mouse spinal cords, which was significantly inhibited by sEV administration. The changes were further confirmed by detecting C1q and NF-ĸB expression using Western blots. In conclusion, intranasal administration of sEVs effectively delays the progression of ALS by inhibiting neuroinflammation and overactivation of the complement and coagulation cascades and NF-ĸB signaling pathway and is a potential option for ALS therapy.

Keywords: Amyotrophic lateral sclerosis; Complement & coagulation cascade; Intranasal administration; Motoneuron degeneration; NF-ĸB signaling; Neuroinflammation; Proteomics; Small extracellular vesicles; Transcriptomics; Transgenic mouse.


Conflict of interest statement

The authors declare no competing interests.

Figures

Fig. 1
Fig. 1
Purification and characterization of MSC-derived sEVs. A: Schematic of the preparation of iPSC-derived MSCs and the purification of sEVs from MSCs using anion-exchange chromatography. B: NanoSight of sEVs showed a sharp peak of nanoparticle concentration at about 99 nm in diameter; the average diameter was 120.8 ± 2.2 nm and the concentration was 7.93 × 108 nanoparticles / ml under the 200-times dilution. C: sEVs were characterized as bilayer nanoparticles (red arrow). D: In western blots, sEVs expressed specific markers (Alix, CD63, CD9, and TSG101) and were negative for Calnexin; MSCs were negative for sEV-specific markers but positive for Calnexin
Fig. 2
Fig. 2
Biodistribution of sEVs in the brain and spinal cord ofSOD1G93Amice after intranasal administration. Fourteen-weeks old SOD1G93A mice were subjected to intranasal administration of mCherry-labelled sEVs daily for 2 days and mCherry-labelled nanoparticles were visualized in the brain and spinal cord sections. A: In the sagittal section, mCherry-labelled nanoparticles (red) were widely distributed in the olfactory bub (OB, a1), cortex (Ctx, a2), diencephalon, and brain stem such as red nuclei (RN, a3) and pontine (Pon, a4) nuclei. Neurons were immunostained by anti-NeuN antibodies (green) and nuclei were stained by DAPI (blue). BE: Transverse lumbar spinal sections were immunostained for ChAT (B), NeuN (C), GFAP (D), and Iba1 (E). Abundant mCherry-labelled nanoparticles (red) were visible in the gray matter, but not in the white matter. In the anti-ChAT immunostained section (B), some spinal motoneurons (green) were preserved in the ventral horn (VH) and filled with red nanoparticles in their soma (arrow) as shown in the images with high magnification (b1–b3). Anti-NeuN immunostaining labeled all spinal neurons (green, C), and red nanoparticles also surround and/or penetrate spinal interneurons (arrow, c1–c3). GFAP-positive astrocytes (green) were widely distributed in the entire spinal cord (D), whereas few nanoparticles were found in astrocytes (d1–d3). In the anti-Iba1 immunostained section (E), some microglia (green) showed enlarged somas (arrows) and nanoparticles were ingested by microglia (e1–e3, arrow). DH, dorsal horn. Same scale bar in BE
Fig. 3
Fig. 3
Intranasal administration of sEVs slows motor function decline and prolongs survival time inSOD1G93Amice. A: Experimental workflow of the timepoints of sEV or PBS administration and data acquisition. Behavioral studies (animal weight, grip strength, and falling latency on the rotarod) were performed prior to administration and once a week thereafter. B: During the 4 weeks of administration, mouse body weight was comparable in the two groups. C: A decrease in grip strength was observed from 14 to 16 weeks in the PBS group, whereas there was a slight increase and then decrease to baseline in the sEV group. D: In the PBS group, the falling latency in the rotarod test gradually decreased from 15 weeks. In the sEV group, the falling latency slightly increased after one week of sEV administration and then was relatively stable; latency was significantly higher compared with that of the PBS group. E: Survival curves. The percentage of surviving animals at day 168 (24 weeks) (dotted red line) was 27% (8/11) in the PBS group and 78% (7/9) in the sEV group, indicating a significant increase of survival probability in the sEV group. ***P < 0.001; ****P < 0.0001; ns, not significant; two-way ANOVA multiple comparison in B–D; Gehan-Breslow-Wilcoxon test in E
Fig. 4
Fig. 4
sEV administration delays motoneuron degeneration and synaptic denervation inSOD1G93Amice. AC: PRV injection into sciatic nerves retrogradely labeled lumbar spinal motoneurons in the WT (A), PBS (B), and sEV groups (C). DF: Anti-ChAT (green) and anti-synaptophysin (red) double immunofluorescent staining showed spinal motoneurons and presynaptic coverage on spinal motoneurons in the WT (D, d1–d3), PBS (E, e1–e3) and sEV groups (F, f1–f3). Enlarged images in d1–d3, e1–e3, and f1–f3 are from the region indicated by the white dotted line in D, E, and F, respectively. G–L: In the unilateral ventral horn of spinal cord (selected region in the schema, G), statistical analysis showed significant differences in PRV-labelled motoneuron density (H) and average soma area (J), ChAT-positive motoneuron density (J) and average soma area (K), and the percentage of synaptophysin coverage on motoneurons among the three groups. *P < 0.05; **P < 0.01; ***P < 0.001; ****P < 0.0001; one-way ANOVA multiple comparison; n = 3 mice in each group and 12–15 slides/mouse
Fig. 5
Fig. 5
sEV administration facilitates preservation of electrophysiological function, NMJ AchRs, and myelin sheath inSOD1G93Amice. AC: Representative EMG recordings of gastrocnemius in the three groups (A); significant differences were observed in amplitude among the three groups (B), but no differences were observed in the EMG latency (C). D, E: EM studies of sciatic nerves showed myelin sheath separation (red arrows) and axon atrophy in the PBS group and early myelin sheath separation in the sEV group (green arrow) but not the WT group (D). A significant increase of G-ratio was observed in the PBS group compared with the WT and sEV groups, but no difference was observed between the WT and the sEV groups (E). FI: AchR clusters in the gastrocnemius were observed by α-BT staining. Clusters were well preserved (white arrows) in the WT group. Many clusters were fragmented (green arrows) in the PBS group. In the sEV group, some AchR clusters were well preserved (white arrows) and some were fragmented (green arrows). Statistical analysis showed significant differences in the average AchR cluster numbers (G), the fragmented AchR cluster percentages (H), and the average AchR cluster surface areas (I) in the PBS group compared with the WT and sEV groups. *P < 0.05; **P < 0.01; ***P < 0.001; ****P < 0.0001; ns, not significant; one-way ANOVA multiple comparison; n = 5 or 6 mice/group for EMG recordings and 3 mice/group for EM study and α-BT staining
Fig. 6
Fig. 6
sEV administration alleviates mitochondrial damage of spinal motoneurons inSOD1G93Amice. AC: EM images of spinal motoneurons from 20-week-old mice in the WT (A), PBS group (B), and the sEV groups (C). Mitochondria were indicated by red arrows. A’–C’ are higher magnification images from the selected regions in A–C, showing individual mitochondria. Nu, nucleus. D–H: Statistical analysis of total mitochondrial surface areas (D), mitochondrial cristae areas (E), circumferences F), aspect ratios (G), and vacuolation rations (H) in the WT, PBS, and sEV groups. *P < 0.05; **P < 0.01; ***P < 0.001; ****P < 0.0001; ns, not significant; one-way ANOVA multiple comparison; 80–150 mitochondria/neuron, 2 neurons/mouse, and 3 mice in each group for analysis
Fig. 7
Fig. 7
sEV administration alleviates neuroinflammation in the spinal cord of SOD1G93Amice. A, B: Cytokines were analyzed in lumbar spinal samples after 4 weeks of intervention. Heatmap of the relative expression of cytokines in individual samples (A). Quantitative analyses identified a significant upregulation of TNF-α and IFN-γ in the PBS group compared with the WT group and a significant downregulation of TNF-α, IFN-γ, IL-4, IL-10, and IL-12p70 in the sEV group compared with the PBS group (B). CF: Anti-Iba1 immunostaining showed microglial cells in transverse cervical spinal sections from the WT (C), PBS (D), and sEV groups (E). Images in selected regions of three groups were enlarged to identify microglial morphology in the corresponding left panels. Cell densities in the ventral horn were higher in the PBS group than the WT and sEV groups and slightly higher in the sEV group compared with the WT group (F). G–J: Astrocytes were analyzed by anti-GFAP immunostaining in the WT (G), PBS (H), and sEV groups (I); astrocyte morphology in the ventral horn (selected regions) was shown in enlarged images in the corresponding left panels. Cell density was higher in the PBS group than the WT and sEV groups and higher in the sEV group compared with the WT group (J). *P < 0.05; **P < 0.01; ***P < 0.001; ****P < 0.0001; ns, not significant; one-way ANOVA multiple comparison; 3 mice in each group. DH, dorsal horn; VH, ventral horn
Fig. 8
Fig. 8
Proteomic profiling of spinal cord samples in SOD1G93A mice after sEV administration. A, B: Volcano plots of differentially expressed proteins (DEPs) using protein mass spectrometry analysis of spinal cord samples in the mutant (Mut) group (namely the PBS group) versus the WT group (A) and the sEV group versus the PBS group (B). C, D: KEGG analysis identified the top 20 pathways of DEPs between the mutant (Mut) group and the WT group (C) and between the sEV group and the PBS group (D). The complement and coagulation cascade and NF-ĸB signaling pathways were indicated by red arrows. E–H: GESA showed upregulation of the complement and coagulation cascade and NF-ĸB signaling pathway in the mutant group (Mut, namely the PBS group) compared with the WT group (E, G) and downregulation of the complement and coagulation cascade and NF-ĸB signaling pathways in the sEV group (sEV) compared with the PBS group (F, H). Three animals in each group were used for analyses
Fig. 9
Fig. 9
Transcriptomic profiling of spinal cord samples in SOD1G93A mice after sEV administration. A, E: Volcano plots of differentially expressed genes (DEGs) identified by RNAseq of spinal cord samples in the mutant group (PBS group) compared with the WT group (A) and the sEV group compared with the mutant group (E). B: KEGG analysis of the top 20 pathways of DEGs between the mutant group and the WT group. The complement and coagulation cascade and NF-ĸB signaling pathways were indicated by red arrows. C, D: Heatmaps of DEGs clustered in the complement and coagulation cascade (C) and the NF-ĸB signaling pathways (D) in the mutant group and the WT group. F: Heatmap of DEGs between the sEV group and the PBS group. Three animals in each group were analyzed

References

    1. van Es MA, Hardiman O, Chio A, Al-Chalabi A, Pasterkamp RJ, Veldink JH, van den Berg LH. Amyotrophic lateral sclerosis. Lancet. 2017;390:2084–98. 10.1016/S0140-6736(17)31287-4 - DOI - PubMed
    1. Cleveland DW, Rothstein JD. From Charcot to Lou Gehrig: deciphering selective motor neuron death in ALS. Nat Rev Neurosci. 2001;2:806–19. 10.1038/35097565 - DOI - PubMed
    1. Rosen DR, Siddique T, Patterson D, Figlewicz DA, Sapp P, Hentati A, Donaldson D, Goto J, O’Regan JP, Deng HX, et al. Mutations in Cu/Zn superoxide dismutase gene are associated with familial amyotrophic lateral sclerosis. Nature. 1993;362:59–62. 10.1038/362059a0 - DOI - PubMed
    1. Brenner D, Freischmidt A. Update on genetics of amyotrophic lateral sclerosis. Curr Opin Neurol. 2022;35:672–7. 10.1097/WCO.0000000000001093 - DOI - PubMed
    1. Zhang S, Cooper-Knock J, Weimer AK, Shi M, Moll T, Marshall JNG, Harvey C, Nezhad HG, Franklin J, Souza CDS, et al. Genome-wide identification of the genetic basis of amyotrophic lateral sclerosis. Neuron. 2022;110:992–e10081011. 10.1016/j.neuron.2021.12.019 - DOI - PMC - PubMed

LinkOut - more resources