. 2024 Aug 22;19(1):72.
doi: 10.1186/s13062-024-00516-8.

Unveiling the unique role of TSPAN7 across tumors: a pan-cancer study incorporating retrospective clinical research and bioinformatic analysis

Affiliations

Unveiling the unique role of TSPAN7 across tumors: a pan-cancer study incorporating retrospective clinical research and bioinformatic analysis

Bingnan Lu et al. Biol Direct. .

Abstract

Background: TSPAN7 is an important factor in tumor progression. However, the precise function of TSPAN7 and its role in pan-cancer are not clear.

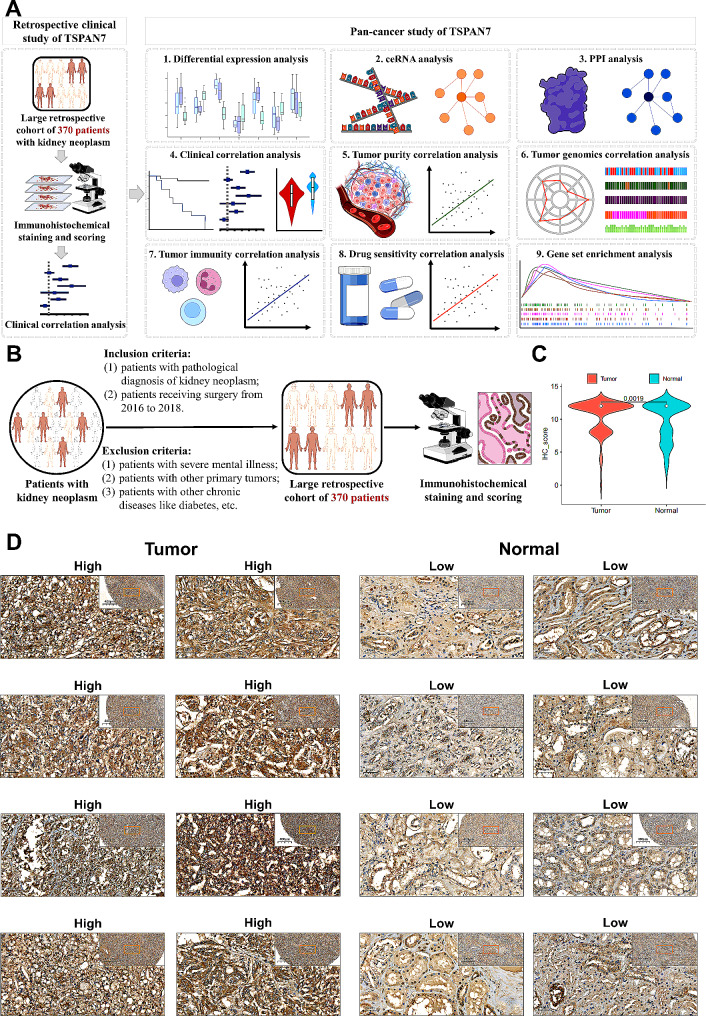
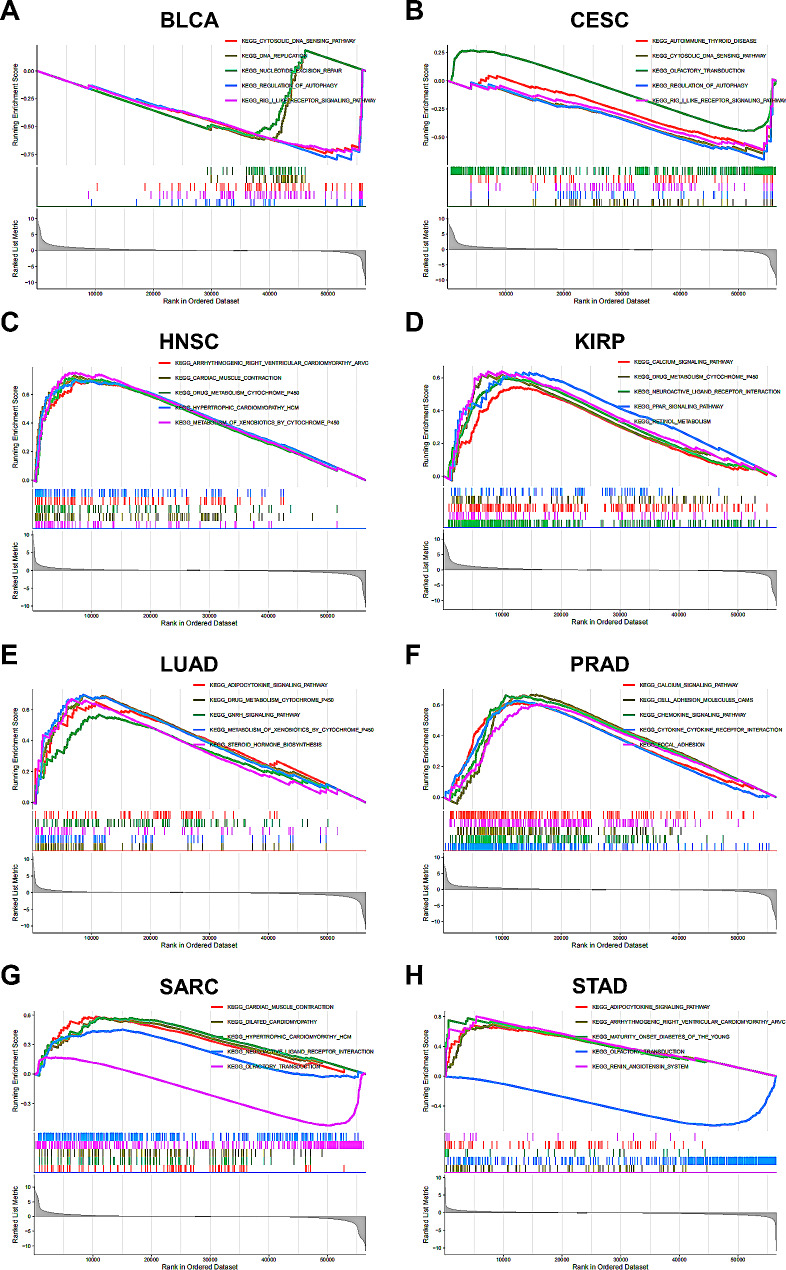
Methods: Based on Xinhua cohort incorporating 370 patients with kidney neoplasm, we conducted differential expression analysis by immunohistochemistry between tumor and normal tissues, and explored correlations of TSPAN7 with patients' survival. Subsequently, we conducted a pan-cancer study, and successively employed differential expression analysis, competing endogenous RNA (ceRNA) analysis, protein-protein interaction (PPI) analysis, correlation analysis of TSPAN7 with clinical characteristics, tumor purity, tumor genomics, tumor immunity, and drug sensitivity. Last but not least, gene set enrichment analysis was applied to identify enriched pathways of TSPAN7.

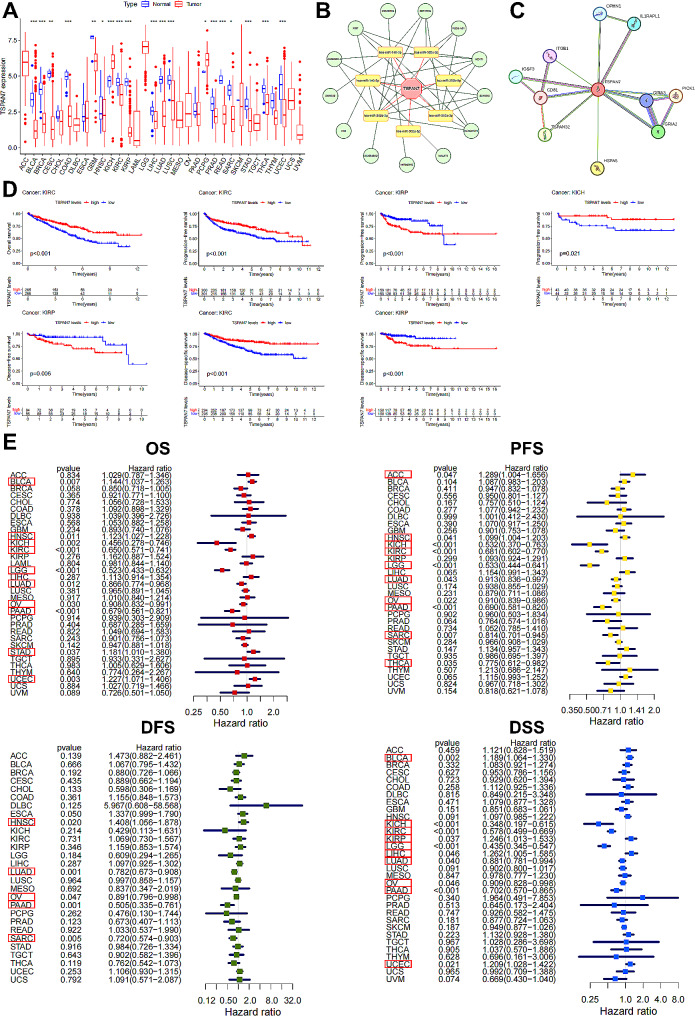
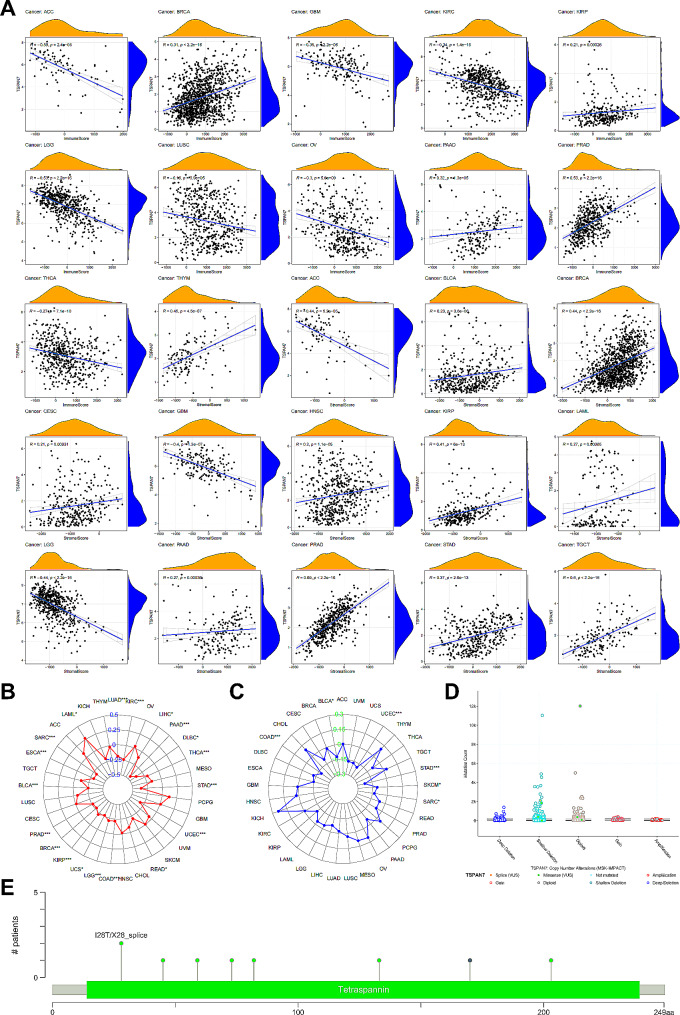
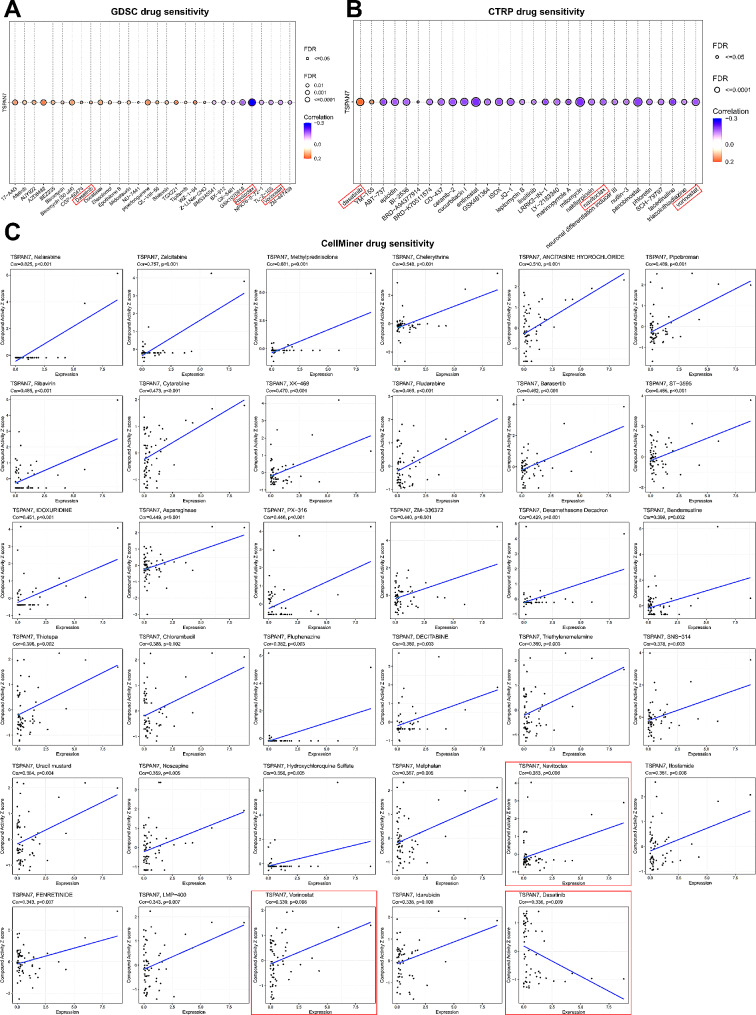
Results: In Xinhua cohort, TSPAN7 expression was significantly up-regulated (P-value = 0.0019) in tumor tissues of kidney neoplasm patients. High TSPAN7 expression was associated with decreases in overall survival (OS) (P-value = 0.009) and progression-free survival (P-value = 0.009), and it was further revealed as an independent risk factor for OS (P-value = 0.0326, HR = 5.66, 95%CI = 1.155-27.8). In pan-cancer analysis, TSPAN7 expression was down-regulated in most tumors, and it was associated with patients' survival, tumor purity, tumor genomics, tumor immunity, and drug sensitivity. The ceRNA network and PPI network of TSPAN7 were also constructed. Last but not least, the top five enriched pathways of TSPAN7 in various tumors were identified.

Conclusion: TSPAN7 served as a promising biomarker of various tumors, especially kidney neoplasms, and it was closely associated with tumor purity, tumor genomics, tumor immunology, and drug sensitivity in pan-cancer level.

Keywords: Biomarker; Kidney neoplasm; Pan-cancer; TSPAN7; Tumor immunology.


Conflict of interest statement

The authors declare no competing interests.

Figures

Fig. 1
Fig. 1
The analysis flow and the results of immunohistochemical (IHC) staining and scoring. (A) The workflow highlighted the important steps of our analysis. (B) The inclusion and exclusion criteria of the retrospective cohort were illustrated. (C) The IHC scores of TSPAN7 in kidney neoplasm tissues were higher than those in normal tissues (P-value = 0.0019). (D) Several IHC staining results of kidney neoplasm tissues and normal tissues were exhibited. Abbreviations: ceRNA, competing endogenouse RNA; PPI, protein-protein interaction
Fig. 2
Fig. 2
Exploring the clinical correlation of TSPAN7 in kidney neoplasm (A) The demographic information and clinical features of the cohort including 370 patients with kidney neoplasm were illustrated in the heatmap. (B-C) The Kaplan-Meier survival curves showed that high expression of TSPAN7 was usually associated with lower overall survival (OS) (P-value = 0.009) and progression free survival (PFS) (P-value = 0.009) in kidney neoplasm. (D) High IHC scores of TSPAN7 in tumor tissues served as a risk factor of OS (hazard ratio (HR) = 5.66, confidential interval (CI) = 1.155–27.8, P-value = 0.0326) in kidney neoplasm. *, P-value < 0.05; **, P-value < 0.01; ***, P-value < 0.001. Abbreviations: OS, overall survival; PFS, progression free survival; KIRC, Kidney clear cell carcinoma; KICH, kidney chromophobe; KIRP, kidney renal papillary cell carcinoma.
Fig. 3
Fig. 3
Differential expression, protein–protein interaction (PPI) network, and survival analysis of TSPAN7 in pan-cancer. (A) The expression of TSPAN7 in tumor was down-regulated in BLCA (P-value < 0.001), BRCA (P-value < 0.001), CESC (P-value < 0.01), COAD (P-value < 0.001), GBM (P-value < 0.01), HNSC (P-value < 0.05), KIRC (P-value < 0.001), KIRP (P-value < 0.001), LIHC (P-value < 0.001), LUAD (P-value < 0.001), LUSC (P-value < 0.001), PRAD (P-value < 0.001), READ (P-value < 0.001), SARC (P-value < 0.05), STAD (P-value < 0.001), THCA (P-value < 0.001), and UCEC (P-value < 0.001), however, up-regulated in KICH (P-value < 0.001) and PCPG (P-value < 0.05). (B) The ceRNA network was constructed by Cytoscape, illustrating the possible TSPAN7-miRNAs-lncRNAs interactions. (C) The PPI network illustrated the close association of TSPAN7 with OPHN1, IL1RAPL1, GRIA3, PICK1, GRIA2, HSPA5, TSPAN32, CD81, ITGB1, and IGSF3.. (D) The Kaplan-Meier survival curves showed that low expression of TSPAN7 was associated with low probability of OS in KIRC (P-value < 0.001). Besides, low expression of TSPAN7 was also correlated with lower PFS in KICH (P-value = 0.021), KIRC (P-value < 0.001), but higher PFS in KIRP (P-value < 0.001). Moreover, TSPAN7 was negatively related to the disease free survival (DFS) of patients in KIRP (P-value = 0.006). As for disease specific survival (DSS), patients with high expression of TSPAN7 usually harbored lower DSS in KIRP (P-value < 0.001), but higher DSS in KIRC (P-value < 0.001). (E) TSPAN7 served as a risk factor of OS in BLCA (HR = 1.144, CI = 1.037–1.263, P-value = 0.007), HNSC (HR = 1.123, CI = 1.027–1.228, P-value = 0.011), STAD (HR = 1.181, CI = 1.010–1.380, P-value = 0.037), UCEC (HR = 1.227, CI = 1.071–1.406, P-value = 0.003), however, served as a protective factor in KICH (HR = 0.456, CI = 0.278–0.746, P-value = 0.002), KIRC (HR = 0.650, CI = 0.571–0.741, P-value < 0.001), LGG (HR = 0.523, CI = 0.433–0.632, P-value < 0.001), LUAD (HR = 0.866, CI = 0.774–0.968, P-value = 0.012), OV (HR = 0.908, CI = 0.832–0.991, P-value = 0.030), PAAD (HR = 0.679, CI = 0.561–0.821, P-value < 0.001). As for PFS, TSPAN7 acted as a risk factor of ACC (HR = 1.289, CI = 1.004–1.656, P-value = 0.047), HNSC (HR = 1.099 CI = 1.004–1.203, P-value = 0.041), while played an opposite role in KICH (HR = 0.532, CI = 0.370–0.763, P-value < 0.001), KIRC (HR = 0.681, CI = 0.602–0.770, P-value < 0.001), LGG (HR = 0.533, CI = 0.444–0.641, P-value < 0.001), LUAD (HR = 0.913, CI = 0.836–0.997, P-value = 0.043), OV (HR = 0.910, CI = 0.839–0.986, P-value = 0.022), PAAD (HR = 0.690, CI = 0.581–0.820, P-value < 0.001), SARC (HR = 0.814, CI = 0.701–0.945, P-value = 0.007), and THCA (HR = 0.775, CI = 0.612–0.982, P-value = 0.035). Moreover, TSPAN7 was protective of DFS in LUAD (HR = 0.782, CI = 0.673–0.908, P-value = 0.001), OV (HR = 0.891, CI = 0.796–0.998, P-value = 0.047), PAAD (HR = 0.505, CI = 0.335–0.761, P-value = 0.001), and SARC (HR = 0.720, CI = 0.574–0.903, P-value = 0.005), but served as a risk factor of HNSC (HR = 1.408, CI = 1.056–1.878, P-value = 0.020). As for DSS, while TSPAN7 was a risk factor in BLCA (HR = 1.189, CI = 1.064–1.330, P-value = 0.002), KIRP (HR = 1.246, CI = 1.013–1.533, P-value = 0.037), LIHC (HR = 1.262, CI = 1.005–1.585, P-value = 0.046), and UCEC (HR = 1.209, CI = 1.028–1.422, P-value = 0.021), it played a protective role in KICH (HR = 0.348, CI = 0.197–0.615, P-value < 0.001), KIRC (HR = 0.578, CI = 0.499–0.669, P-value < 0.001), LGG (HR = 0.435, CI = 0.345–0.547, P-value < 0.001), LUAD (HR = 0.881, CI = 0.781–0.994, P-value = 0.040), OV (HR = 0.909, CI = 0.828–0.998, P-value = 0.046), and PAAD (HR = 0.702, CI = 0.570–0.865, P-value < 0.001). *, P-value < 0.05; **, P-value < 0.01; ***, P-value < 0.001. Abbreviations: DFS, disease free survival; DSS, disease specific survival
Fig. 4
Fig. 4
The correlations of TSPAN7 with tumor purity and tumor genomics in pan-cancer. (A) The scatter plots and the corresponding fitting curves illustrated the correlations of TSPAN7 with the immune score and stromal score in pan-cancer. TSPAN7 harbored a negative correlation with the immune scores in most types of tumors, including ACC (R = -0.59, P-value < 0.001), GBM (R = -0.36, P-value < 0.001), KIRC (R = -0.34, P-value < 0.001), LGG (R = -0.53, P-value < 0.001), LUSC (R = -0.18, P-value < 0.001), OV (R = -0.3, P-value < 0.001), and THCA (R = -0.27, P-value < 0.001), except for BRCA (R = 0.31, P-value < 0.001), KIRP (R = 0.21, P-value < 0.001), PAAD (R = 0.32, P-value < 0.001), and PRAD (R = 0.53, P-value < 0.001). As for stromal scores, TSPAN7 was positively correlated with the stromal scores in most types of cancers, including BLCA (R = 0.23, P-value < 0.001), BRCA (R = 0.44, P-value < 0.001), CESC (R = 0.21, P-value < 0.001), HNSC (R = 0.2, P-value < 0.001), KIRP (R = 0.41, P-value < 0.001), LAML (R = 0.27, P-value < 0.001), PAAD (R = 0.27, P-value < 0.001), PRAD (R = 0.69, P-value < 0.001), STAD (R = 0.37, P-value < 0.001), TGCT (R = 0.6, P-value < 0.001), and THYM (R = 0.45, P-value < 0.001), except for ACC (R = -0.44, P-value < 0.001), GBM (R = -0.4, P-value < 0.001), LGG (R = -0.44, P-value < 0.001). (B) The radar map highlighted the negative correlation of TSPAN7 with TMB in BLCA (P-value < 0.001), BRCA (P-value < 0.001), COAD (P-value < 0.001), DLBC (P-value < 0.05), ESCA (P-value < 0.001), KIRC (P-value < 0.001), KIRP (P-value < 0.001), LGG (P-value < 0.001), LIHC (P-value < 0.05), LUAD (P-value < 0.001), PAAD (P-value < 0.001), PRAD (P-value < 0.001), READ (P-value < 0.05), SARC (P-value < 0.001), STAD (P-value < 0.001), THCA (P-value < 0.001), UCEC (P-value < 0.001), and UCS (P-value < 0.05). (C) The radar map highlighted the negative correlation of TSPAN7 with MSI in BLCA (P-value < 0.05), COAD (P-value < 0.001), SARC (P-value < 0.05), SKCM (P-value < 0.05), STAD (P-value < 0.001), and UCEC (P-value < 0.001). (D) The major copy number alterations of TSPAN7 were shallow deletion. (E) The mutation site of TSPAN7 was exhibited in the plot. *, P-value < 0.05; **, P-value < 0.01; ***, P-value < 0.001
Fig. 5
Fig. 5
The correlations of TSPAN7 with immune gene sets and immune cell infiltration in pan-cancer. (A) TSPAN7 was positively associated with both the immune inhibitory genes and stimulatory genes in BRCA, KIRP, LAML, LIHC, PAAD, PRAD, STAD, etc., but showed a negative correlation with them in ACC, GBM, KICH, KIRC, LGG, LUSC, OV, THCA, UCEC, etc. (B) TSPAN7 was negatively associated with the infiltration of B cells memory (R = -0.16, P-value < 0.001), macrophages M0 (R = -0.29, P-value < 0.001), plasma cells (R = -0.17, P-value < 0.001), T cells CD4 memory activated (R = -0.2, P-value < 0.001), T cells CD8 (R = -0.18, P-value < 0.001), T cells follicular helper (R = -0.16, P-value < 0.001), T cells gamma delta (R = -0.18, P-value < 0.001), and T cells regulatory (R = -0.37, P-value < 0.001), but positively associated with the infiltration of B cells naïve (R = 0.22, P-value < 0.001), dendritic cells resting (R = 0.17, P-value < 0.001), mast cells resting (R = 0.44, P-value < 0.001), monocytes (R = 0.18, P-value < 0.001), NK cells resting (R = 0.34, P-value < 0.001), and T cells CD4 memory resting (R = 0.15, P-value < 0.001) in KIRC. TSPAN7 was positively associated with the infiltration of B cells naïve (R = 0.29, P-value < 0.001), macrophages M1 (R = 0.42, P-value < 0.001), and T cells CD8 (R = 0.22, P-value < 0.001), except for mast cells resting (R = -0.22, P-value < 0.001) in KIRP. *, P-value < 0.05; **, P-value < 0.01; ***, P-value < 0.001
Fig. 6
Fig. 6
The correlations of TSPAN7 with drug sensitivity in pan-cancer. (A) In GDSC database, TSPAN7 expression was positively correlated with IC50 of 17-AAG, Afatinib, AUY922, AZD6482, BEZ235, Bleomycin, Bleomycin (50 μm), CGP-60,474, Dasatinib, Docetaxel, Elesclomol, Epothilone B, Midostaurin, NU-7441, piperlongumine, QL-VIII-58, Shikonin, TGX221, Tipifarnib, WZ-1-84, Z-LLNle-CHO, but was negatively correlated with IC50 of BMS345541, BX-912, CX-5461, GSK1070916, NPK76-II-72-1, TL-2-105, Vorinostat, ZM-447,439. (B) In CTRP database, TSPAN7 expression was positively correlated with IC50 of Dasatinib, YM-155, but was negatively correlated with IC50 of ABT-737, Apicidin, BI-2536, BRD-A94377914, BRD-K70511574, CD-437, Ceranib-2, Cucurbitacin I, Entinostat, GSK461364, ISOX, JQ-1, Leptomycin B, Linsitinib, LRRK2-IN-1, LY-2,183,240, Marinopyrrole A, Mitomycin, Nakiterpiosin, Navitoclax, Neuronal differentiation inducer III, Nutlin-3, Panobinostat, Phloretin, SCH-79,797, Tacedinaline, Triazolothiadiazine, Vorinostat. (C) In CellMiner database, TSPAN7 expression was positively correlated with compound activity of Nelarabine (R = 0.825, P-value < 0.001), Zalcitabine (R = 0.757, P-value < 0.001), Methylprednisolone (R = 0.681, P-value < 0.001), Chelerythrine (R = 0.548, P-value < 0.001), ANCITABINE HYDROCHLORIDE (R = 0.510, P-value < 0.001), Pipobroman (R = 0.489, P-value < 0.001), Ribavirin (R = 0.485, P-value < 0.001), Cytarabine (R = 0.473, P-value < 0.001), XK-469 (R = 0.470, P-value < 0.001), Fludarabine (R = 0.469, P-value < 0.001), Barasertib (R = 0.462, P-value < 0.001), ST-3595 (R = 0.456, P-value < 0.001), IDOXURIDINE (R = 0.451, P-value < 0.001), Asparaginase (R = 0.449, P-value < 0.001), PX-316 (R = 0.446, P-value < 0.001), ZM-336,372 (R = 0.440, P-value < 0.001), Dexamethasone Decadron (R = 0.429, P-value < 0.001), Bendamustine (R = 0.399, P-value < 0.01), Thiotepa (R = 0.396, P-value < 0.01), Chlorambucil (R = 0.388, P-value < 0.01), Fluphenazine (R = 0.382, P-value < 0.01), DECITABINE (R = 0.380, P-value < 0.01), Triethylenemelamine(R = 0.380, P-value < 0.01), SNS-314 (R = 0.378, P-value < 0.01), Uracil mustard (R = 0.364, P-value < 0.01), Noscapine (R = 0.359, P-value < 0.01), Hydroxychloroquine Sulfate (R = 0.358, P-value < 0.01), Melphalan (R = 0.357, P-value < 0.01), Navitoclax (R = 0.353, P-value < 0.01), Ifosfamide (R = 0.351, P-value < 0.01), FENRETINIDE (R = 0.343, P-value < 0.01), LMP-400 (R = 0.343, P-value < 0.01), Vorinostat (R = 0.339, P-value < 0.01), Idarubicin (R = 0.338, P-value < 0.01), Dasatinib (R = -0.336, P-value < 0.01). Abbreviations: GDSC, Genomics of Drug Sensitivity in Cancer; CTRP, The Cancer Therapeutics Response Portal; Cor, correlation coefficient
Fig. 7
Fig. 7
The enriched signaling pathways of TSPAN7 in pan-cancer. (A) In BLCA, the top five enriched down-regulated KEGG pathways were “Cytosolic DNA sensing pathway”, “DNA replication”, “Nucleotide excision repair”, “Regulation of autophagy”, and “RIG I like receptor signaling pathway”. (B) In CESC, the top five enriched down-regulated KEGG pathways were “Autoimmune thyroid disease”, “Cytosolic DNA sensing pathway”, “Olfactory transduction”, “Regulation of autophagy”, and “RIG I like receptor signaling pathway”. (C) In HNSC, the top five enriched up-regulated KEGG pathways were “Arrhythmogenic right ventricular cardiomyopathy_ARVC”, “Cardiac muscle contraction”, “Hypertrophic cardiomyopathy_HCM”, “Drug metabolism cytochrome P450”, and “Metabolism of xenobiotics by cytochrome P450”. (D) In KIRP, the top five enriched up-regulated KEGG pathways were “Calcium signaling pathway”, “Drug metabolism cytochrome P450”, “Neuroactive ligand receptor interaction”, “PPAR signaling pathway”, and “Retinol metabolism”. (E) In LUAD, the top five enriched up-regulated KEGG pathways were “Adipocytokine signaling pathway”, “Drug metabolism cytochrome P450”, “GnRH signaling pathway”, “Metabolism of xenobiotics by cytochrome P450”, and “Steroid hormone biosynthesis”. (F) In PRAD, the top five enriched up-regulated KEGG pathways were “Calcium signaling pathway”, “Cell adhesion molecules_CAMs”, “Chemokine signaling pathway”, “Cytokine-cytokine receptor interaction”, and “focal adhesion”. (G) In SARC, the four enriched up-regulated KEGG pathways were “Cardiac muscle contraction”, “Dilated cardiomyopathy”, “Hypertrophic cardiomyopathy_HCM”, and “Neuroactive ligand receptor interaction”. However, “Olfactory transduction” was down-regulated in SARC. (H) In STAD, the four enriched up-regulated KEGG pathways were “Adipocytokine signaling pathway”, “Arrhythmogenic right ventricular cardiomyopathy_ARVC”, “Maturity onset diabetes of the young”, and “Renin angiotensin system”. However, “Olfactory transduction” was down-regulated in STAD

Similar articles

Cited by

References

    1. Luan M, et al. The peptide mimicking small extracellular loop domain of CD82 inhibits tumor cell migration, adhesion and induces apoptosis by inhibiting integrin mediated signaling. Biochem Biophys Res Commun. 2018;503(4):2206–11. 10.1016/j.bbrc.2018.06.139 - DOI - PubMed
    1. Charrin S, et al. Lateral organization of membrane proteins: tetraspanins spin their web. Biochem J. 2009;420(2):133–54. 10.1042/BJ20082422 - DOI - PubMed
    1. Hemler ME. Tetraspanin functions and associated microdomains. Nat Rev Mol Cell Biol. 2005;6(10):801–11. 10.1038/nrm1736 - DOI - PubMed
    1. Hemler ME. Tetraspanin proteins promote multiple cancer stages. Nat Rev Cancer. 2014;14(1):49–60. 10.1038/nrc3640 - DOI - PubMed
    1. Huang R, et al. The role of tetraspanins pan-cancer. iScience. 2022;25(8):104777. 10.1016/j.isci.2022.104777 - DOI - PMC - PubMed

LinkOut - more resources