. 2024 Aug 22;29(1):430.
doi: 10.1186/s40001-024-02021-0.

Bioinformatics analysis reveals that CBX2 promotes enzalutamide resistance in prostate cancer

Affiliations

Bioinformatics analysis reveals that CBX2 promotes enzalutamide resistance in prostate cancer

Zhu Wen et al. Eur J Med Res. .

Abstract

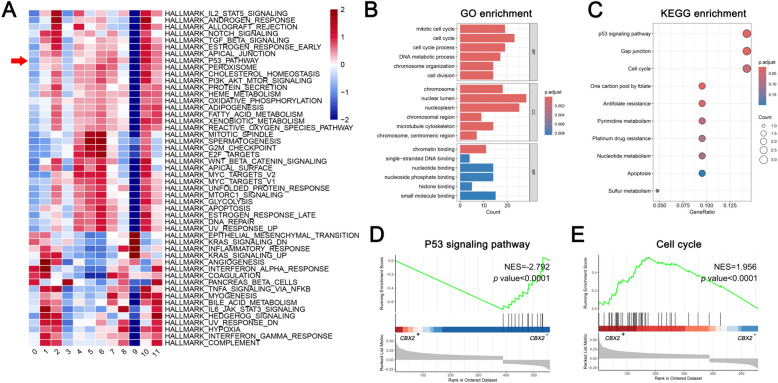
Enzalutamide (Enz) is commonly utilized as the initial treatment strategy for advanced prostate cancer (PCa). However, a notable subset of patients may experience resistance to Enz, resulting in reduced effectiveness. Utilizing Gene Expression Omnibus (GEO) databases, we identified CBX2 as a crucial factor in mediating resistance to Enz, primarily due to its inhibitory effect on the P53 signaling pathway. Silencing of CBX2 using small interfering RNA (siRNA) led to elevated levels of P53 expression in LNCaP cells. This indicates that CBX2 may have a critical effect on PCa Enz resistance and could serve as a promising therapeutic target for individuals with Enz resistance.

Keywords: CBX2; Enzalutamide; PCa; Prostate cancer; Resistance.


Conflict of interest statement

There are no potential conflicts of interest.

Figures

Fig. 1
Fig. 1
Enz resistance-related genes identification. A Volcano plots of the DEGs in GSE44905. Red dots indicate upregulated genes; blue dots indicate downregulated genes. B Volcano plots of the DEGs in GSE104935. Red dots indicate upregulated genes; blue dots indicate downregulated genes. C Volcano plots of the DEGs in GSE51872. Red dots indicate upregulated genes; blue dots indicate downregulated genes. D Heatmap showing DEGs in different samples in GSE44905. E Heatmap showing DEGs in different samples in GSE104935. F Heatmap showing DEGs in different samples in GSE51872. G Circular enrichment of GO pathways among GSE44905 DEGs. H Circular enrichment of GO pathways among GSE104935 DEGs. I Circular enrichment of GO pathways among GSE51872 DEGs. J Circular enrichment of KEGG pathways among GSE44905 DEGs. K Circular enrichment of KEGG pathways among GSE104935 DEGs. L Circular enrichment of KEGG pathways among GSE51872 DEGs
Fig. 2
Fig. 2
WGCNA reveals Enz-resistant gene co-expression networks. A WGCNA analysis of Enz response samples in GSE44905. The dendrogram represented the clusters of differentially expressed genes based on different metrics. Each branch represented one gene, and each color below the branches represented one co-expression module. B WGCNA analysis of Enz resistance samples in GSE104935. The dendrogram represented the clusters of differentially expressed genes based on different metrics. Each branch represented one gene, and each color below the branches represented one co-expression module. C WGCNA analysis of Enz resistance samples in GSE51872. The dendrogram represented the clusters of differentially expressed genes based on different metrics. Each branch represented one gene, and each color below the branches represented one co-expression module. D The heatmap showed the correlation between gene modules and Enz response. The correlation coefficient in each cube represented the correlation between gene modules and traits, which decreased from red to blue. E The heatmap showed the correlation between gene modules and Enz resistance. The correlation coefficient in each cube represented the correlation between gene modules and traits, which decreased from red to blue. F The heatmap showed the correlation between gene modules and Enz resistance. The correlation coefficient in each cube represented the correlation between gene modules and traits, which decreased from red to blue. G The common hub genes shared between DEGs and WGCNA derived from GSE44905 were visualized in a Venn diagram. H The common hub genes shared between DEGs and WGCNA derived from GSE104935 were visualized in a Venn diagram. I The common hub genes shared between DEGs and WGCNA derived from GSE51872 were visualized in a Venn diagram. J The top enriched GO pathways among common hub genes from the GSE44905. The horizontal axis represented the p-value of GO terms on Metascape. K The top enriched GO pathways among common hub genes from the GSE104935. The horizontal axis represented the p-value of GO terms on Metascape. L The top enriched GO pathways among common hub genes from the GSE51872. The horizontal axis represented the p-value of GO terms on Metascape
Fig. 3
Fig. 3
Expression and prognosis of hub genes. A The common hub genes shared among three GSE datasets were visualized in a Venn diagram. B The expression of four selected genes in the TCGA database, PCa (red) and normal (gray). C Kaplan–Meier curves, respectively, for disease-free survival (DFS), and of PCa patients with high versus low expression of four selected genes in TCGA. D Estimation of hub gene expression in GSE44905. E Estimation of hub gene expression in GSE104935. F Estimation of hub gene expression in GSE51872. *p < 0.05
Fig. 4
Fig. 4
ScRNA-seq data validated the selected hub genes. A The UMAP was utilized to partition cells into 12 distinct clusters, with each cluster being represented by a unique color that corresponded to its numbered phenotype. B The UMAP was used to partition cells according to different sample types. C The distribution of cell proportions across distinct groups is depicted on a graph, where the vertical axis denotes the proportion of each cell cluster. D The heatmap presents the expression of the top 5 DEGs (rows) in each cell cluster (column). E Cell–cell communication signaling network among the 9 clusters analyzed with CellChat. The right panel showed that cell clusters were located based on the count of their significant incoming (Y-axis) or outgoing (X-axis) signaling pattern. F Number of interactions in 12 cell clusters. The width of the lines indicates the number of pairs. Different colors represent different signal sources. G Heatmap of the CellChat signaling in each cluster. The left panel shows the outgoing signaling patterns (expression weight value of signaling molecules) and the right panel shows the incoming signaling patterns (expression weight value of signaling receptors). A gradient of white to dark green indicates a low to high expression weight value in the heatmap. H The inferred NOTCH2 signaling pathway network. I Feature plots showing the distribution of CBX2, DCAF6, FAM117B, and TMEM141 in 12 cell clusters. J Violin plots showing the distribution of indicated genes in various cell clusters
Fig. 5
Fig. 5
In vitro experiments validated the role of CBX2 in Enz-response. A Heatmap showing different pathways enriched in the 12 cell clusters by GSVA. Each column represents different groups or subpopulations of cells, and each row represents a pathway. The redder the color, the higher the score, and the bluer the color, the lower the score. B The top enriched GO pathways among DEGs of CBX2+ and CBX2 cells were identified and presented in a graphical representation. C The top enriched KEGG pathways among DEGs of CBX2+ and CBX2 cells were identified and presented in a graphical representation. D The P53 signaling pathway was identified and presented in a graphical representation by GSEA. E The cell cycle pathway was identified and presented in a graphical representation by GSEA

Similar articles

Cited by

  • Unravelling the impact of the chromobox proteins in human cancers.
    Noreen S, Simonelli N, Benedetti R, Carafa V, Grieco M, Ambrosino C, Dell'Aversana C, Nebbioso A, Conte M, Del Gaudio N, Altucci L. Noreen S, et al. Cell Death Dis. 2025 Apr 2;16(1):238. doi: 10.1038/s41419-025-07585-1. Cell Death Dis. 2025. PMID: 40175347 Free PMC article. Review.

References

    1. Siegel RL, Giaquinto AN, Jemal A. Cancer statistics, 2024. CA Cancer J Clin. 2024;74:12–49. 10.3322/caac.21820 - DOI - PubMed
    1. Qiu H, Cao S, Xu R. Cancer incidence, mortality, and burden in China: a time-trend analysis and comparison with the United States and United Kingdom based on the global epidemiological data released in 2020. Cancer Commun (Lond). 2021;41:1037–48. 10.1002/cac2.12197 - DOI - PMC - PubMed
    1. Cheng Q, et al. Pre-existing castration-resistant prostate cancer-like cells in primary prostate cancer promote resistance to hormonal therapy. Eur Urol. 2022;81:446–55. 10.1016/j.eururo.2021.12.039 - DOI - PMC - PubMed
    1. Schaeffer EM, et al. Prostate cancer, version 4.2023, NCCN Clinical Practice Guidelines in Oncology. J Natl Compr Canc Netw. 2023;21:1067–96. 10.6004/jnccn.2023.0050 - DOI - PubMed
    1. Ge R, et al. Epigenetic modulations and lineage plasticity in advanced prostate cancer. Ann Oncol. 2020;31:470–9. 10.1016/j.annonc.2020.02.002 - DOI - PubMed

MeSH terms