. 2024 Aug;12(16):e16156.
doi: 10.14814/phy2.16156.

Aquaporin 1 confers apoptosis resistance in pulmonary arterial smooth muscle cells from the SU5416 hypoxia rat model

Affiliations

Aquaporin 1 confers apoptosis resistance in pulmonary arterial smooth muscle cells from the SU5416 hypoxia rat model

Xin Yun et al. Physiol Rep. 2024 Aug.

Abstract

Pulmonary hypertension (PH) arises from increased pulmonary vascular resistance due to contraction and remodeling of the pulmonary arteries. The structural changes include thickening of the smooth muscle layer from increased proliferation and resistance to apoptosis. The mechanisms underlying apoptosis resistance in PH are not fully understood. In cancer cells, high expression of aquaporin 1 (AQP1), a water channel, is associated with apoptosis resistance. We showed AQP1 protein was expressed in pulmonary arterial smooth muscle cells (PASMCs) and upregulated in preclinical PH models. In this study, we used PASMCs isolated from control male rats and the SU5416 plus hypoxia (SuHx) model to test the role of AQP1 in modulating susceptibility to apoptosis. We found the elevated level of AQP1 in PASMCs from SuHx rats was necessary for resistance to apoptosis and that apoptosis resistance could be conferred by increasing AQP1 in control PASMCs. In exploring the downstream pathways involved, we found AQP1 levels influence the expression of Bcl-2, with enhanced AQP1 levels corresponding to increased Bcl-2 expression, reducing the ratio of BAX to Bcl-2, consistent with apoptosis resistance. These results provide a mechanism by which AQP1 can regulate PASMC fate.

Keywords: cell death; lung; pulmonary hypertension; remodeling.


Conflict of interest statement

None.

Figures
FIGURE 1
FIGURE 1
Apoptosis in pulmonary arterial smooth muscle cells (PASMCs) from normoxic (N) and Su5416+hypoxia (SuHx) rats. (a, b) Bar and scatter graphs represent mean ± SD values and individual values (n = 16 rats for each group) for (a) right ventricular systolic pressure (RVSP) and (b) right ventricle to left ventricle plus septum (RV/LV+S) weight in N and SuHx rats. Significance was determined by t test. (c, d) Bar and scatter graphs represent mean ± SD values and individual values (n = 12 rats per group) for apoptosis measured via (c) Hoescht staining and (d) caspase 3/7 activity assay in PASMCs from N and SuHx rats challenged with vehicle (Veh; PBS) or H2O2 (500 μM; 24 h). Values are presented as percent of total cells. Significance assessed by two‐way anova with Holm‐Sidak post hoc test. For (c), interaction p = 0.045. For (d), interaction p = 0.001. (e) Bar and scatter graphs represent mean ± SD values and individual values (n = 3 per group) for caspase 3/7 activity in PASMCs from N rats challenged with Veh or H2O2 in the presence of DMSO (vehicle) or the caspase 3/7 inhibitor DEVD (50 mg/mL). Significance assessed by two‐way anova with Holm‐Sidak post hoc test. Interaction p = 0.0077.
FIGURE 2
FIGURE 2
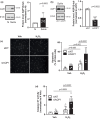
Effect of AQP1 depletion on apoptosis in pulmonary arterial smooth muscle cells (PASMCs). (a) Representative blots show AQP1 protein levels in PASMCs from normoxic (N) and Su5416/hypoxia (SuHx) rats. Bar and scatter plot graphs represent mean ± SD values and individual values (n = 8 rats per group) for AQP1 protein levels. Significance determined by t test. (b) Representative blots show siRNA targeted to AQP1 (siAQP1) reduced AQP1 protein levels in PASMCs from SuHx rats compared to cells transfected with a nontargeting siRNA (siNT). Bar and scatter plot graphs represent mean ± SD values and individual values (n = 6 rats per group) for AQP1 protein levels. Significance determined by t test. (c, d) Bar and scatter graphs represent mean ± SD values and individual values for apoptosis measured via (c) Hoescht staining (n = 6 rats per group) and (d) caspase 3/7 activity assay (n = 8 rats per group) in PASMCs from SuHx rats transfected with siNT or siAQP1 and challenged with vehicle (Veh; PBS) or H2O2 (500 μM; 24 h). Values for apoptosis are presented as percent of total cells while values for caspase 3/7 activity are normalized to siNT Veh cells. Significance assessed by two‐way anova with Holm‐Sidak post hoc test. For (c), interaction p = 0.0169. For (d), interaction p = 0.003.
FIGURE 3
FIGURE 3
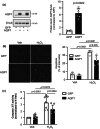
Effect of increasing AQP1 on apoptosis in pulmonary arterial smooth muscle cells (PASMCs) from control rats. (a) Representative blots show AQP1 protein levels in PASMCs infected with adenovirus containing wild‐type AQP1 (AdAQP1) or green fluorescence protein (AdGFP). Bar and scatter plot graphs represent mean ± SD values and individual values (n = 6 rats per group) for AQP1 protein levels. Significance determined by t test. (b, c) Bar and scatter graphs represent mean ± SD values and individual values for apoptosis measured via (b) Hoescht staining (n = 5 rats per group) and (c) caspase 3/7 activity assay (n = 7 rats per group) in PASMCs from control rats infected with AdGFP or AdAQP1 and challenged with vehicle (Veh; PBS) or H2O2 (500 μM; 24 h). Values for apoptosis are presented as percent of total cells while values for caspase 3/7 activity are normalized to AdGFP Veh cells. Significance assessed by two‐way anova with Holm‐Sidak post hoc test. For (b), interaction p = 0.0072. For (c), interaction p = 0.0173.
FIGURE 4
FIGURE 4
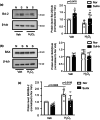
BAX and Bcl‐2 levels in pulmonary arterial smooth muscle cells (PASMCs) from normoxic (N) and Su5416+hypoxia (S) rats. (a) Representative blots show Bcl‐2 protein levels in PASMCs from N and S rats treated with vehicle (Veh; PBS) or H2O2 (500 μM; 24 h). Bar and scatter plot graphs represent mean ± SD values and individual values for Bcl‐2 protein levels. Significance assessed by two‐way anova with Holm‐Sidak post hoc test. Interaction p = 0.0178. (b) Representative blots show BAX protein levels in PASMCs from N and SuHx rats treated with vehicle (Veh; PBS) or H2O2 (500 μM; 24 h). Bar and scatter plot graphs represent mean ± SD values and individual values for BAX protein levels. Significance assessed by two‐way anova; all values ns. (c) Bar and scatter plot graphs represent mean ± SD values and individual values for the ratio of BAX/Bcl‐2 protein levels. For all experiments, n = 6 rats per group. Significance assessed by two‐way anova with Holm‐Sidak post hoc test. Interaction p = 0.2427.
FIGURE 5
FIGURE 5
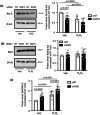
Effect of depleting AQP1 protein on Bcl‐2 and BAX protein levels in pulmonary arterial smooth muscle cells (PASMCs) from Su5416+hypoxia (SuHx) rats. (a) Representative blots show Bcl‐2 protein levels in PASMCs from SuHx rats transfected with siRNA targeted to AQP1 (siAQP1) or a nontargeting siRNA (siNT) and treated with vehicle (Veh; PBS) or H2O2 (500 μM; 24 h). Bar and scatter plot graphs represent mean ± SD values and individual values for Bcl‐2 protein levels. Significance assessed by two‐way anova with Holm‐Sidak post hoc test. Interaction p = 0.1861. (b) Representative blots show BAX protein levels in PASMCs from SuHx rats treated with Veh or H2O2. Bar and scatter plot graphs represent mean ± SD values and individual values for BAX protein levels. Significance assessed by two‐way anova with Holm‐Sidak post hoc test. All values ns. (c) Bar and scatter plot graphs represent mean ± SD values and individual values for the ratio of BAX/Bcl‐2 protein levels. For all experiments, n = 8 rats per group. Significance assessed by two‐way anova with Holm‐Sidak post hoc test. Interaction p = 0.5906.
FIGURE 6
FIGURE 6
Effect of increasing AQP1 protein levels on Bcl‐2 and BAX expression in control pulmonary arterial smooth muscle cells (PASMCs). (a) Representative blots show Bcl‐2 protein levels in PASMCs from control rats infected with adenovirus containing wild‐type AQP1 (AdAQP1) or green fluorescent protein (AdGFP) and treated with vehicle (Veh; PBS) or H2O2 (500 μM; 24 h). Bar and scatter plot graphs represent mean ± SD values and individual values for Bcl‐2 protein levels. Significance assessed by two‐way anova with Holm‐Sidak post hoc test. Interaction p = 0.7422. (b) Representative blots show BAX protein levels in PASMCs from control rats with forced expression of AQP1 or GFP and treated with Veh or H2O2. Bar and scatter plot graphs represent mean ± SD values and individual values for BAX protein levels. Significance assessed by two‐way anova with Holm‐Sidak post hoc test. All values ns. (c) Bar and scatter plot graphs represent mean ± SD values and individual values for the ratio of BAX/Bcl‐2 protein levels. Significance assessed by two‐way anova with Holm‐Sidak post hoc test. Interaction p = 0.1291. For all experiments, n = 7 rats per group.

Similar articles

Cited by

References

    1. Agre, P. , King, L. S. , Yasui, M. , Guggino, W. B. , Ottersen, O. P. , Fujiyoshi, Y. , Engel, A. , & Nielsen, S. (2002). Aquaporin water channels – From atomic structure to clinical medicine. The Journal of Physiology, 542, 3–16. - PMC - PubMed
    1. Al Ghouleh, I. , Frazziano, G. , Rodriguez, A. I. , Csanyi, G. , Maniar, S. , St Croix, C. M. , Kelley, E. E. , Egana, L. A. , Song, G. J. , Bisello, A. , Lee, Y. J. , & Pagano, P. J. (2013). Aquaporin 1, Nox1, and Ask1 mediate oxidant‐induced smooth muscle cell hypertrophy. Cardiovascular Research, 97, 134–142. - PMC - PubMed
    1. Antonsson, B. , Conti, F. , Ciavatta, A. , Montessuit, S. , Lewis, S. , Martinou, I. , Bernasconi, L. , Bernard, A. , Mermod, J. J. , Mazzei, G. , Maundrell, K. , Gambale, F. , Sadoul, R. , & Martinou, J. C. (1997). Inhibition of BAX channel‐forming activity by Bcl‐2. Science, 277, 370–372. - PubMed
    1. Benito, A. , Silva, M. , Grillot, D. , Nunez, G. , & Fernandez‐Luna, J. L. (1996). Apoptosis induced by erythroid differentiation of human leukemia cell lines is inhibited by Bcl‐XL. Blood, 87, 3837–3843. - PubMed
    1. Bourgeois, A. , Lambert, C. , Habbout, K. , Ranchoux, B. , Paquet‐Marceau, S. , Trinh, I. , Breuils‐Bonnet, S. , Paradis, R. , Nadeau, V. , Paulin, R. , Provencher, S. , Bonnet, S. , & Boucherat, O. (2018). FOXM1 promotes pulmonary artery smooth muscle cell expansion in pulmonary arterial hypertension. Journal of Molecular Medicine (Berlin, Germany), 96, 223–235. - PubMed

MeSH terms

LinkOut - more resources