

Mapping neural correlates of biological motion perception in autistic children using high-density diffuse optical tomography
- PMID: 39175054
- PMCID: PMC11342641
- DOI: 10.1186/s13229-024-00614-4
Mapping neural correlates of biological motion perception in autistic children using high-density diffuse optical tomography
Abstract
Background: Autism spectrum disorder (ASD), a neurodevelopmental disorder defined by social communication deficits plus repetitive behaviors and restricted interests, currently affects 1/36 children in the general population. Recent advances in functional brain imaging show promise to provide useful biomarkers of ASD diagnostic likelihood, behavioral trait severity, and even response to therapeutic intervention. However, current gold-standard neuroimaging methods (e.g., functional magnetic resonance imaging, fMRI) are limited in naturalistic studies of brain function underlying ASD-associated behaviors due to the constrained imaging environment. Compared to fMRI, high-density diffuse optical tomography (HD-DOT), a non-invasive and minimally constraining optical neuroimaging modality, can overcome these limitations. Herein, we aimed to establish HD-DOT to evaluate brain function in autistic and non-autistic school-age children as they performed a biological motion perception task previously shown to yield results related to both ASD diagnosis and behavioral traits.
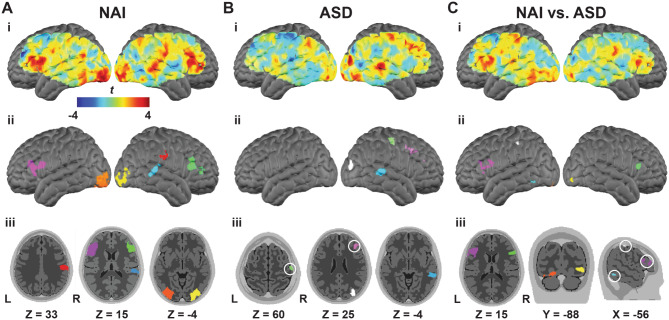
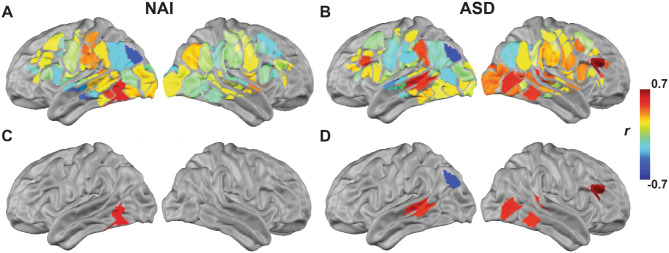
Methods: We used HD-DOT to image brain function in 46 ASD school-age participants and 49 non-autistic individuals (NAI) as they viewed dynamic point-light displays of coherent biological and scrambled motion. We assessed group-level cortical brain function with statistical parametric mapping. Additionally, we tested for brain-behavior associations with dimensional metrics of autism traits, as measured with the Social Responsiveness Scale-2, with hierarchical regression models.
Results: We found that NAI participants presented stronger brain activity contrast (coherent > scrambled) than ASD children in cortical regions related to visual, motor, and social processing. Additionally, regression models revealed multiple cortical regions in autistic participants where brain function is significantly associated with dimensional measures of ASD traits.
Limitations: Optical imaging methods are limited in depth sensitivity and so cannot measure brain activity within deep subcortical regions. However, the field of view of this HD-DOT system includes multiple brain regions previously implicated in both task-based and task-free studies on autism.
Conclusions: This study demonstrates that HD-DOT is sensitive to brain function that both differentiates between NAI and ASD groups and correlates with dimensional measures of ASD traits. These findings establish HD-DOT as an effective tool for investigating brain function in autistic and non-autistic children. Moreover, this study established neural correlates related to biological motion perception and its association with dimensional measures of ASD traits.
Keywords: Autism spectrum disorder; Biological motion; High-density diffuse optical tomography; Neuroimaging; Social perception.
© 2024. The Author(s).
Conflict of interest statement
The authors declare no competing interests.
Figures


References
-
- Association AP. Diagnostic and statistical manual of mental disorders (DSM-5). American Psychiatric Pub; 2013. - PubMed
-
- Maenner MJ, Warren Z, Williams AR, Amoakohene E, Bakian AV, Bilder DA, et al. Prevalence and characteristics of Autism Spectrum Disorder among children aged 8 years - Autism and Developmental Disabilities Monitoring Network, 11 sites, United States, 2020. MMWR Surveill Summ. 2023;72(2):1–14. 10.15585/mmwr.ss7202a1 - DOI - PMC - PubMed
-
- Sharpe DL. The Financial side of Autism: private and public costs. sine loco: IntechOpen; 2011.
Publication types
MeSH terms
Grants and funding
LinkOut - more resources
Full Text Sources
Medical
