. 2024 Aug 23;12(1):155.
doi: 10.1186/s40168-024-01875-0.

Targeted viromes and total metagenomes capture distinct components of bee gut phage communities

Affiliations

Targeted viromes and total metagenomes capture distinct components of bee gut phage communities

Dino Lorenzo Sbardellati et al. Microbiome. .

Abstract

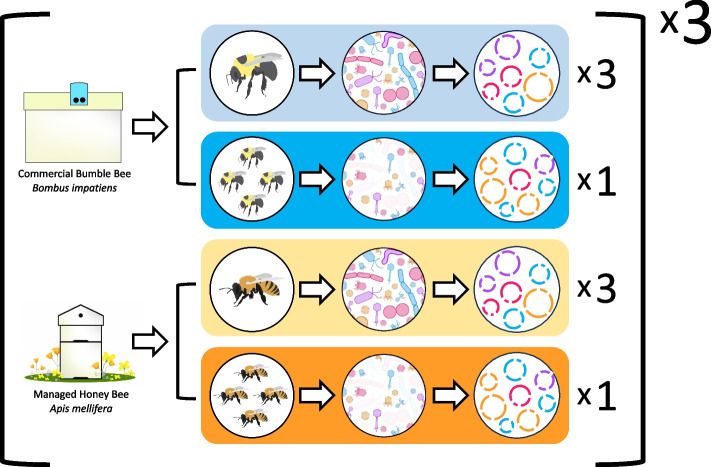
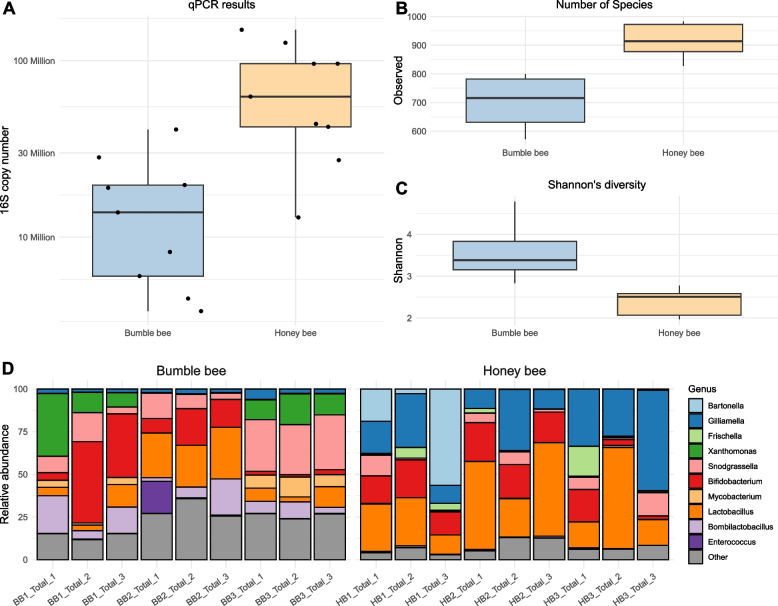
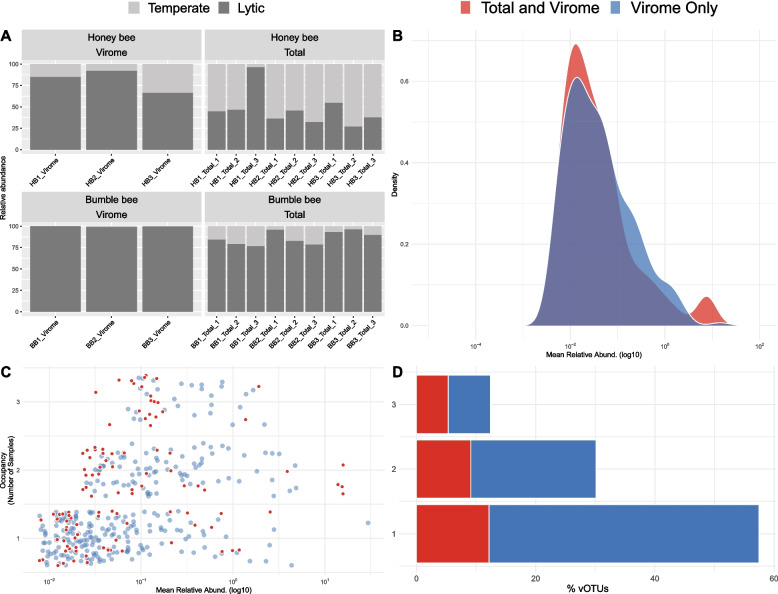
Background: Despite being among the most abundant biological entities on earth, bacteriophage (phage) remain an understudied component of host-associated systems. One limitation to studying host-associated phage is the lack of consensus on methods for sampling phage communities. Here, we compare paired total metagenomes and viral size fraction metagenomes (viromes) as methods for investigating the dsDNA viral communities associated with the GI tract of two bee species: the European honey bee Apis mellifera and the eastern bumble bee Bombus impatiens.

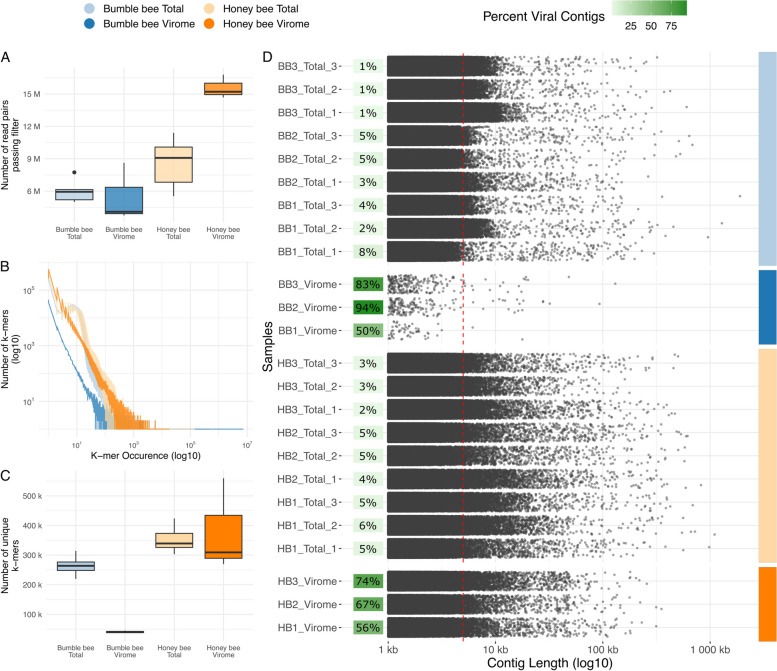
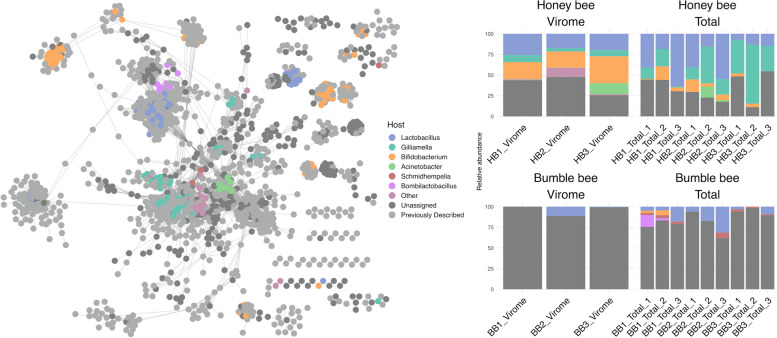
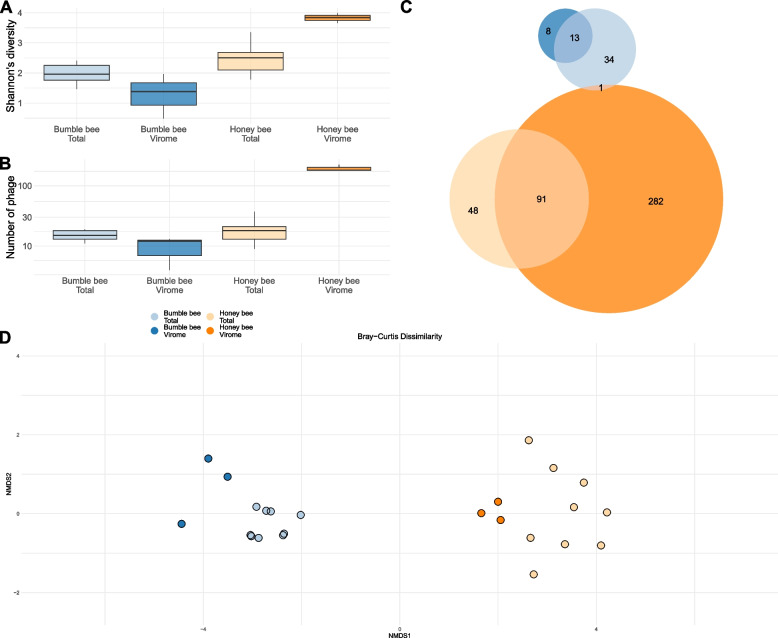
Results: We find that viromes successfully enriched for phage, thereby increasing phage recovery, but only in honey bees. In contrast, for bumble bees, total metagenomes recovered greater phage diversity. Across both bee species, viromes better sampled low occupancy phage, while total metagenomes were biased towards sampling temperate phage. Additionally, many of the phage captured by total metagenomes were absent altogether from viromes. Comparing between bees, we show that phage communities in commercially reared bumble bees are significantly reduced in diversity compared to honey bees, likely reflecting differences in bacterial titer and diversity. In a broader context, these results highlight the complementary nature of total metagenomes and targeted viromes, especially when applied to host-associated environments.

Conclusions: Overall, we suggest that studies interested in assessing total communities of host-associated phage should consider using both approaches. However, given the constraints of virome sampling, total metagenomes may serve to sample phage communities with the understanding that they will preferentially sample dominant and temperate phage. Video Abstract.

Keywords: Bacteriophage; Bee microbiome; Host-associated microbiome; Microbial ecology; Viral ecology.


Conflict of interest statement

The authors declare no competing interests.

Figures

Fig. 1
Fig. 1
Graphical representation of the sampling scheme and methods used in this research. A total of three bumble bee and three honey bee colonies were sampled. From each colony of bee, we generated three total metagenomes and one targeted virome. Total metagenomes were sampled from individual bees, while targeted viromes were produced from the pooled guts of 100 bees. This sampling resulted in nine bumble bee total metagenomes (light blue), three bumble bee viromes (dark blue), nine honey bee total metagenomes (light orange), and three honey bee viromes (dark orange)
Fig. 2
Fig. 2
Figures describing sequencing and assembly quality. Color denotes sample groups. A Boxplots describing sequencing depth. The x-axis shows sample groups. The y-axis displays the total number of high-quality reads produced. B Line plots describing sequence complexity of the reads shown in A, as measured by the frequency distributions of 31-bp-sized k-mers. The x-axis presents k-mer occurrence (i.e., how abundant a particular k-mer was in a given sample’s read), while the y-axis shows the number of k-mers with a certain occurrence. C Boxplots describing the number of unique 31-bp-sized k-mers present in the read libraries of each group of samples. The x-axis shows sample groups. The y-axis shows the number of unique k-mers. D Jittered dot plots describing the length distributions of contigs assembled from each sample. Only contigs > = 1 kbp bp are shown. Individual samples are shown on the y-axis. The x-axis shows contig length (log10 scale). Each point represents a single contig. A dotted red line is drawn at 5 Kbp. For each sample, a green square is plotted phage enrichment (the number of phage identified, divided by number of contigs assessed for phage, times 100)
Fig. 3
Fig. 3
Figures describing gene sharing among the phage identified in our dataset and the overall phage communities found in individual samples. A Weighted gene-sharing network of all non-singleton vOTUs identified in our study and by previous bee phage studies. Individual nodes are vOTUs. Nodes are connected by edges when vOTUs share genes. Nodes are colored based on the predicted bacterial host of phage. Nodes with “previously described” as a predicted host are the vOTUs previously described by other bee phage papers [–50]. B Stacked bar plot describing the community of phage found in each sample based on predicted host. Both A and B use the same color palette
Fig. 4
Fig. 4
Figures describing the alpha and beta diversity of the phage communities identified in our samples. Blue represents samples taken from bumble bees. Orange represents samples taken from honey bees. Lighter colors are total metagenomes. Darker colors are viromes. A and B Boxplots describing Shannon’s diversity and vOTU richness associated with each of our sample types. The x-axis group samples. The y-axis shows diversity and richness scores. C Euler diagram describing phage community overlaps between each of our sample types. Numbers correspond to the number of phage present in each section of the graph (i.e., 91 phage were found in both honey bee viromes and total metagenomes). Circle size is proportional to number of phage. C Nonmetric multidimensional scaling (NMDS) ordination describing the Bray-Curtis dissimilarity of all samples on our dataset. Individual points are samples. Color represents sample type. The closer 2 points are to each other, the more similar they are in phage community
Fig. 5
Fig. 5
Honey and bumble bees differ in bacterial community density, diversity, and composition. A Boxplots displaying the 16S rRNA gene copy number present in the mid-hindgut region of sampled honey and bumble bees. B Boxplot presenting the number of observed bacterial species in honey and bumble bee. C Boxplot showing the species level Shannon’s diversity of honey and bumble bee gut bacterial communities. D Stacked bar plot describing honey and bumble bee bacterial communities at the genus level
Fig. 6
Fig. 6
vOTUs sampled by viromes and total metagenomes differ in integrase content, occupancy, and abundance. A Stacked bar plot showing the relative abundance of temperate and lytic vOTUs in virome and total metagenome samples. B Density distributions showing the average relative abundance of all vOTUs found in viromes. vOTUs unique to viromes are shown in blue. vOTUs found in both viromes and total metagenomes are shown in red. C Dot plot showing the occupancy-abundance relationship of all virome vOTUs. The x-axis describes average relative abundance, while the y-axis shows the percent occupancy of each vOTU. As before, vOTUs unique to viromes are shown in blue, and those found in both viromes and total metagenomes are shown in red. D Stacked bar plot describing the percent of vOTUs found in one, two, or three samples. The x-axis represents the percent of vOTUs. The y-axis the occupancy. Similar to B and C, vOTUs unique to viromes are shown in blue, and those found in both viromes and total metagenomes are shown in red

Similar articles

References

    1. Bergh Ø, Børsheim KY, Bratbak G, Heldal M. High abundance of viruses found in aquatic environments. Nature. 1989;340:467–8. 10.1038/340467a0 - DOI - PubMed
    1. Chibani-Chennoufi S, Bruttin A, Dillmann ML, Brüssow H. Phage-host interaction: an ecological perspective. J Bacteriol. 2004;186:3677–3686. Preprint at 10.1128/JB.186.12.3677-3686.2004. - PMC - PubMed
    1. Keen EC. A century of phage research: bacteriophages and the shaping of modern biology. BioEssays. 2015;37:6–9. 10.1002/bies.201400152 - DOI - PMC - PubMed
    1. Braga LPP, et al. Impact of phages on soil bacterial communities and nitrogen availability under different assembly scenarios. Microbiome. 2020;8:52. 10.1186/s40168-020-00822-z - DOI - PMC - PubMed
    1. Trubl G, et al. Soil viruses are underexplored players in ecosystem carbon processing. mSystems. 2018;3:1–21.10.1128/msystems.00076-18 - DOI - PMC - PubMed