. 2024 Aug 6:15:1413479.
doi: 10.3389/fphys.2024.1413479. eCollection 2024.

Repeated seizure-induced brainstem neuroinflammation contributes to post-ictal ventilatory control dysfunction

Affiliations

Repeated seizure-induced brainstem neuroinflammation contributes to post-ictal ventilatory control dysfunction

Wasif A Osmani et al. Front Physiol. .

Abstract

Patients with epilepsy face heightened risk of post-ictal cardiorespiratory suppression and sudden unexpected death in epilepsy (SUDEP). Studies have shown that neuroinflammation, mediated by the activation of microglia and astrocytes, may be a cause or consequence of seizure disorders. Kcnj16 (Kir5.1) knockout rats (SS kcnj16-/- ) are susceptible to repeated audiogenic seizures and recapitulate features of human SUDEP, including post-ictal ventilatory suppression, which worsens with repeated seizures and seizure-induced mortality. In this study, we tested the hypothesis that repeated seizures cause neuroinflammation within key brainstem regions that contribute to the control of breathing. Audiogenic seizures were elicited once/day for up to 10 days in groups of adult male SS kcnj16-/- rats, from which frozen brainstem biopsies of the pre-Bötzinger complex/nucleus ambiguus (preBötC/NA), Bötzinger complex (BötC), and raphe magnus (RMg) regions were subjected to a cytokine array. Several cytokines/chemokines, including IL-1α and IL-1ß, were increased selectively in preBötC/NA after 3 or 5 days of seizures with fewer changes in other regions tested. In additional groups of male SS kcnj16-/- rats that underwent repeated seizures, we quantified microglial (IBA-1+) cell counts and morphology, specifically within the preBötC/NA region, and showed increased microglial cell counts, area, and volume consistent with microglial activation. To further test the role of inflammation in physiological responses to seizures and seizure-related mortality, additional groups of SS kcnj16-/- rats were treated with anakinra (IL-1R antagonist), ketoprofen (non-selective COX inhibitor), or saline for 3 days before and up to 10 days of seizures (1/day), and breathing was measured before, during, and after each seizure. Remarkably, IL-1R antagonism mitigated changes in post-ictal ventilatory suppression on days 7-10 but failed to prevent seizure-related mortality, whereas ketoprofen treatment exacerbated post-ictal ventilatory suppression compared to other treatment groups but prevented seizure-related mortality. These data demonstrate neuroinflammation and microglial activation within the key brainstem region of respiratory control following repeated seizures, which may functionally but differentially contribute to the pathophysiological consequences of repeated seizures.

Keywords: brainstem; neuroinflammation; pre-Bötzinger complex; repeated seizures; ventilatory control.


Conflict of interest statement

The authors declare that the research was conducted in the absence of any commercial or financial relationships that could be construed as a potential conflict of interest.

Figures

FIGURE 1
FIGURE 1
Site- and time-dependent changes in brainstem inflammatory mediators. Schematic diagrams (A–C) representing the locations from which bilateral punch biopsies (200 μ m) were harvested (although RMg is not a bilateral structure) from individual animals at each timepoint and measured for cytokine and chemokine array analyses (n = 2–4/group; adapted from the Rat Brain Atlas of Paxinos and Watson). (D–F) are heat maps summarizing the 27 different cytokines and chemokines that were tested for each seizure group’s tissue, with a relative expression scale denoted by color, with red representing higher expression and blue representing lower expression. Values are relative to the naïve expression group and significance denoted with *(P < 0.05) and # (0.1 > P > 0.05). (G–I) represent volcano plots for day 5 expression to highlight the significant changes observed at this timepoint in fold-change expression in each region tested. Cytokines and chemokines above the gray dashed line and red are significant (P < 0.05) and above the dotted gray line and orange reached a more relaxed threshold for change (0.1 > P> 0.05). Brown–Forsythe test and Welsh ANOVA test for multiple comparisons for statistical analysis.
FIGURE 2
FIGURE 2
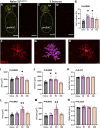
Microglial morphometric analysis of the preBötC/NA region following repeated seizures. (A,C) depict the method for identifying the regions of interest (dotted regions) used for IBA-1+ cell analyses by using ChAT+ cells to identify the NA/preBötC region (yellow, A,C) for IBA-1+ cell (red, B,D) counts, which are plotted in (E). Confocal image-based morphometric analysis (Imaris) allowed for the identification of complete cell outlines (F–G; data in I–K) or the soma alone (H; data in L–N) to calculate morphology parameters including total cell area (I; µm2), total cell volume (J; µm3), total cell sphericity (K; a.u.), somatic area (L; µm2), somatic volume (M; µm3), and somatic sphericity (N; a.u.). n = 24/group (see also Methods for sample size). One-way ANOVA with Tukey’s multiple comparisons test (ANOVA P-value included in figure; *indicates P < 0.05 vs. naïve; **indicates P < 0.0001 vs. naïve). Scale bar = 150 µm.
FIGURE 3
FIGURE 3
Average seizure scores among treatment groups across the 10-day seizure protocol. Panels (A–C) represent the time required to reach the indicated modified Racine seizure score from the onset of the sound stimulus. (D) shows the average modified Racine seizure score across the 10 days of seizure for each treatment. The different colors represent the grouping of time points into distinctive bins of days 1–3, 4–6, and 7–10 for analysis, as done previously in Manis et al. (2021). (E) Total apnea (sec) measured during and 1.5 min after GTCS. *indicates P < 0.05 days 7–10 vs. days 1–3 within a treatment group, #indicates P < 0.05 treatment effects within time points. Mixed-effects analysis (two-way ANOVA selected, P-value shown is the interaction term of Drug × Time).
FIGURE 4
FIGURE 4
Effects of repeated seizures and treatments on total ventilation (VE, mL/min/100 g; A–C) and breathing frequency (FB; breaths/min; D–F) across 10 days of seizures (days 13; blue, days 46; red, and days 7–10; green) during baseline (“B”) conditions and up to 15 min post-ictally. The dashed blue line represents the baseline value on days 1–3 for each treatment group. Two-way ANOVA with Dunnett’s multiple comparison test (#p < 0.05 vs. Days 1–3; *P < 0.05 vs. baseline within Days). P values listed in (A–F) represent the interaction term (Days × Treatment).
FIGURE 5
FIGURE 5
Effects of repeated seizures and treatments on tidal volume (VT, mL/100 g; A–C) and inspiratory drive (VT/TI; ml/s; D–F) across 10 days of seizures (days 1–3; blue, days 4–6; red, and days 7–10; green) during baseline (“B”) conditions and up to 15 min post-ictally. The dashed blue line represents the baseline value on days 1–3 for each treatment group. Two-way ANOVA with Dunnett’s multiple comparison test (#p < 0.05 vs. days 1–3; *P < 0.05 vs. baseline within days). P values listed with the interaction term (Days × Time).
FIGURE 6
FIGURE 6
Effects of seizures and treatment on total ventilation (VE; (A), breathing frequency (FB; (B), and inspiratory drive (VT/TI; (C) normalized to baseline (“B” value = 1.0; blue dotted line) for up to 15 min post-ictally across the 10-day seizure protocol. Compared are saline- (blue; n = 11), anakinra- (red; n = 14), and ketoprofen- (green; n = 10) treated SS kcnj16−/− rats. Two-way ANOVA with Tukey’s multiple comparison test (drug and time as factors). P-values shown are for drug effect. #P < 0.05 vs. saline; ^P < 0.05 vs. other drug, *P < 0.05 vs. baseline.
FIGURE 7
FIGURE 7
Anti-inflammatory treatment leads to differential survival across 10 days of seizure. Mortality was significantly affected by both drugs, in completely opposing ways. Anakinra showed no significant difference in survival when compared to no treatment (naïve) or saline. However, ketoprofen showed 100% survival and was significantly different from anakinra, saline, and no treatment. The log rank test was utilized for statistical significance, with **indicating P < 0.05 of ketoprofen vs. anakinra vs. naïve.

References

    1. Choi J., Nordli D. R., Alden T. D., DiPatri A., Laux L., Kelley K., et al. (2009). Cellular injury and neuroinflammation in children with chronic intractable epilepsy. J. Neuroinflammation 6 (1), 38. 10.1186/1742-2094-6-38 - DOI - PMC - PubMed
    1. Costagliola G., Depietri G., Michev A., Riva A., Foiadelli T., Savasta S., et al. (2022). Targeting inflammatory mediators in epilepsy: a systematic review of its molecular basis and clinical applications. Front. Neurology 13, 741244. 10.3389/fneur.2022.741244 - DOI - PMC - PubMed
    1. Cui Y., Kam K., Sherman D., Janczewski W. A., Zheng Y., Feldman J. L. (2016). Defining preBötzinger complex rhythm- and pattern-generating neural microcircuits in vivo . Neuron 91 (3), 602–614. 10.1016/j.neuron.2016.07.003 - DOI - PMC - PubMed
    1. Dilena R., Mauri E., Aronica E., Bernasconi P., Cappelletti C., Carabelli A., et al. (2019). Therapeutic effect of Anakinra in the relapsing chronic phase of febrile infection-related epilepsy syndrome. Epilepsia Open 4 (2), 344–350. 10.1002/epi4.12317 - DOI - PMC - PubMed
    1. George A. G., Farrell J. S., Colangeli R., Wall A. K., Gom R. C., Kesler M. T., et al. (2023). Sudden unexpected death in epilepsy is prevented by blocking postictal hypoxia. Neuropharmacology 231, 109513. 10.1016/j.neuropharm.2023.109513 - DOI - PubMed

LinkOut - more resources