. 2024 Aug 22;17(8):e13768.
doi: 10.1111/eva.13768. eCollection 2024 Aug.

Deciphering the Genetic Landscape: Insights Into the Genomic Signatures of Changle Goose

Affiliations

Deciphering the Genetic Landscape: Insights Into the Genomic Signatures of Changle Goose

Hao Chen et al. Evol Appl. .

Abstract

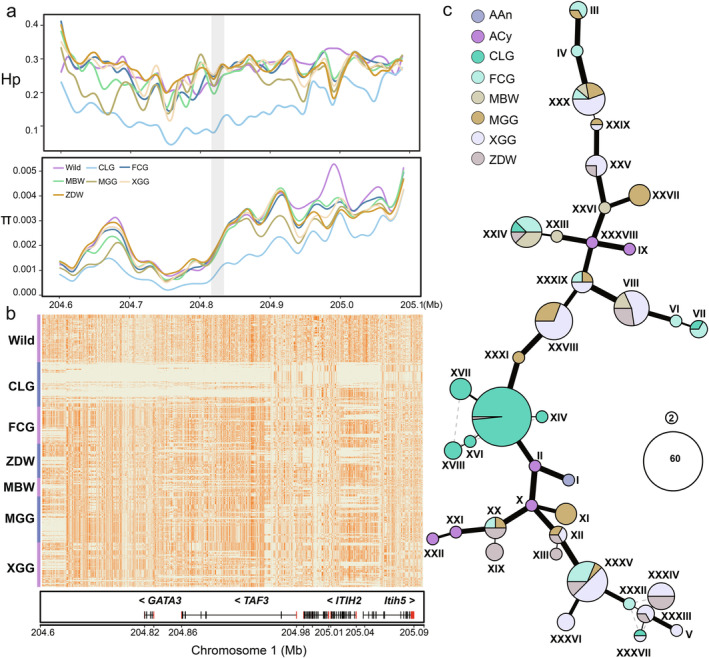
The Changle goose (CLG), a Chinese indigenous breed, is celebrated for its adaptability, rapid growth, and premium meat quality. Despite its agricultural value, the exploration of its genomic attributes has been scant. Our study entailed whole-genome resequencing of 303 geese across CLG and five other Chinese breeds, revealing distinct genetic diversity metrics. We discovered significant migration events from Xingguo gray goose to CLG and minor gene flow between them. We identified genomic regions through selective sweep analysis, correlating with CLG's unique traits. An elevated inbreeding coefficient in CLG, alongside reduced heterozygosity and rare single nucleotide polymorphisms (RSNPs), suggests a narrowed genetic diversity. Genomic regions related to reproduction, meat quality, and growth were identified, with the GATA3 gene showing strong selection signals for meat quality. A non-synonymous mutation in the Sloc2a1 gene, which is associated with reproductive traits in the CLG, exhibited significant differences in allelic frequency. The roles of CD82, CDH8, and PRKAB1 in growth and development, alongside FABP4, FAF1, ESR1, and AKAP12 in reproduction, were highlighted. Additionally, Cdkal1 and Mfsd14a may influence meat quality. This comprehensive genetic analysis underpins the unique genetic makeup of CLG, providing a basis for its conservation and informed breeding strategies.

Keywords: Changle goose; conservation genetics; genetic diversity; genomic analysis; meat quality; reproduction.


Conflict of interest statement

The authors declare no conflicts of interest.

Figures

FIGURE 1
FIGURE 1
Genome‐wide distribution and annotation of SNPs and SVs in the Changle goose. (a) Depicts SNP density across the genome, calculated at 2 Mb intervals. (b) Illustrates the functional categorization of SNPs as determined by SnpEff, highlighting the distribution within various genomic contexts. (c) Details the distribution of SV types—deletions (DEL), duplications (DUP), and inversions (INV)—across six different goose breeds. (d) Presents the proportional representation of SVs on autosomal chromosomes within a cohort of 303 geese. Refer to Table 1 for breed abbreviations.
FIGURE 2
FIGURE 2
Genetic structure and phylogenetic relationships of six goose breeds based on autosomal variants. (a) The neighbor‐joining (NJ) phylogenetic tree, derived from SNP data of 303 geese. (b) Principal component analysis (PCA) results, accounting for 4.57% of the variance in PC1 and 3.17% in PC2. (c) The NJ phylogenetic tree constructed from the SV dataset for 303 geese. (d) PCA findings based on the SV dataset for 303 geese, which explain 3.43% of the variance in PC1 and 2.41% in PC2. (e) The genetic composition of goose breeds, as elucidated by ADMIXTURE analysis, spanning K values from 2 to 6.
FIGURE 3
FIGURE 3
Genomic signatures of selection in the Changle goose (CLG). (a) Manhattan plot illustrating the composite likelihood ratio (CLR) for the CLG across autosomes, with a dashed line indicating the significance threshold for the top 0.1% of regions. (b) Frequency difference (Freq diff) plot across autosomes showing variation between the CLG and other Chinese goose breeds, with the dashed line marking the top 1% significance threshold. (c) Gene ontology (GO) term enrichment analysis for genes identified by both CLR and Freq diff, presenting the −log10 (p value) on the y‐axis. (d) Manhattan plot of the fixation index (Fst) indicating genomic differentiation between the CLG and other breeds. (e) Manhattan plot of cross‐population extended haplotype homozygosity (XP‐CLR) identifying regions suggestive of positive selection. (f) Enrichment analysis of GO terms for genes identified by both Fst and XP‐CLR, highlighting the biological processes potentially under selection.
FIGURE 4
FIGURE 4
Genetic variation and haplotype structure of the GATA3 gene in Changle goose (CLG) and comparative breeds. (a) Nucleotide diversity (π) and heterozygosity (Hp) are measured in the genomic region encompassing the GATA3 gene across different goose populations. (b) Heatmap of haplotype distribution surrounding the GATA3 gene, illustrating the allelic variation between CLG and other breeds, with major alleles marked in dark orange and minor alleles in honeydew. (c) Haplotype network for the GATA3 gene, with a node representing a haplotype. Node size reflects the frequency of each haplotype, while the connections depict genetic distances, indicating the degree of allelic differentiation among haplotypes. Breed abbreviations refer to Table S1.
FIGURE 5
FIGURE 5
Genetic diversity and haplotype distribution of the Sloc2a1 gene in Changle goose. (a) Graphical representation of nucleotide diversity (π) and heterozygosity (Hp) in the regions flanking the Sloc2a1 gene. (b) Heatmap illustrating the haplotypes of the Sloc2a1 gene in CLG compared with various goose populations, with major alleles shown in dark orange and minor alleles in honeydew. (c) Haplotype network diagram for the Sloc2a1 gene, where each node represents a distinct haplotype and its size denotes the frequency. Lines between nodes reflect genetic distances, illustrating allelic divergence. (d) Bar graph showing the allele frequencies of missense mutations within the Sloc2a1 gene across different goose breeds, with the deleterious impact of amino acid substitutions predicted by SIFT. (e) Conformational space prediction for the Slco2a1 protein between CLG and other breeds based on structural modeling. Refer to Table S1 for breed abbreviations.

References

    1. Alexander, D. H. , Novembre J., and Lange K.. 2009. “Fast Model‐Based Estimation of Ancestry in Unrelated Individuals.” Genome Research 19, no. 9: 1655–1664. - PMC - PubMed
    1. Anderson, F. , Pannier L., Pethick D. W., and Gardner G. E.. 2015. “Intramuscular fat in Lamb Muscle and the Impact of Selection for Improved Carcass Lean Meat Yield.” Animal 9, no. 6: 1081–1090. - PubMed
    1. Bergsma, A. , Ganguly S. S., Dick D., Williams B. O., and Miranti C. K.. 2018. “Global Deletion of Tetraspanin CD82 Attenuates Bone Growth and Enhances Bone Marrow Adipogenesis.” Bone 113: 105–113. - PubMed
    1. Browning, S. R. , and Browning B. L.. 2007. “Rapid and Accurate Haplotype Phasing and Missing‐Data Inference for Whole‐Genome Association Studies by Use of Localized Haplotype Clustering.” American Journal of Human Genetics 81, no. 5: 1084–1097. - PMC - PubMed
    1. Bruford, M. W. 2004. “Conservation Genetics of UK Livestock: From Molecules to Management.” BSAP Occasional Publication 30: 151–169.

LinkOut - more resources