. 2022;3(1):25.
doi: 10.1038/s43246-022-00247-1. Epub 2022 Apr 26.

In vivo engraftment into the cornea endothelium using extracellular matrix shrink-wrapped cells

Affiliations

In vivo engraftment into the cornea endothelium using extracellular matrix shrink-wrapped cells

Rachelle N Palchesko et al. Commun Mater. 2022.

Abstract

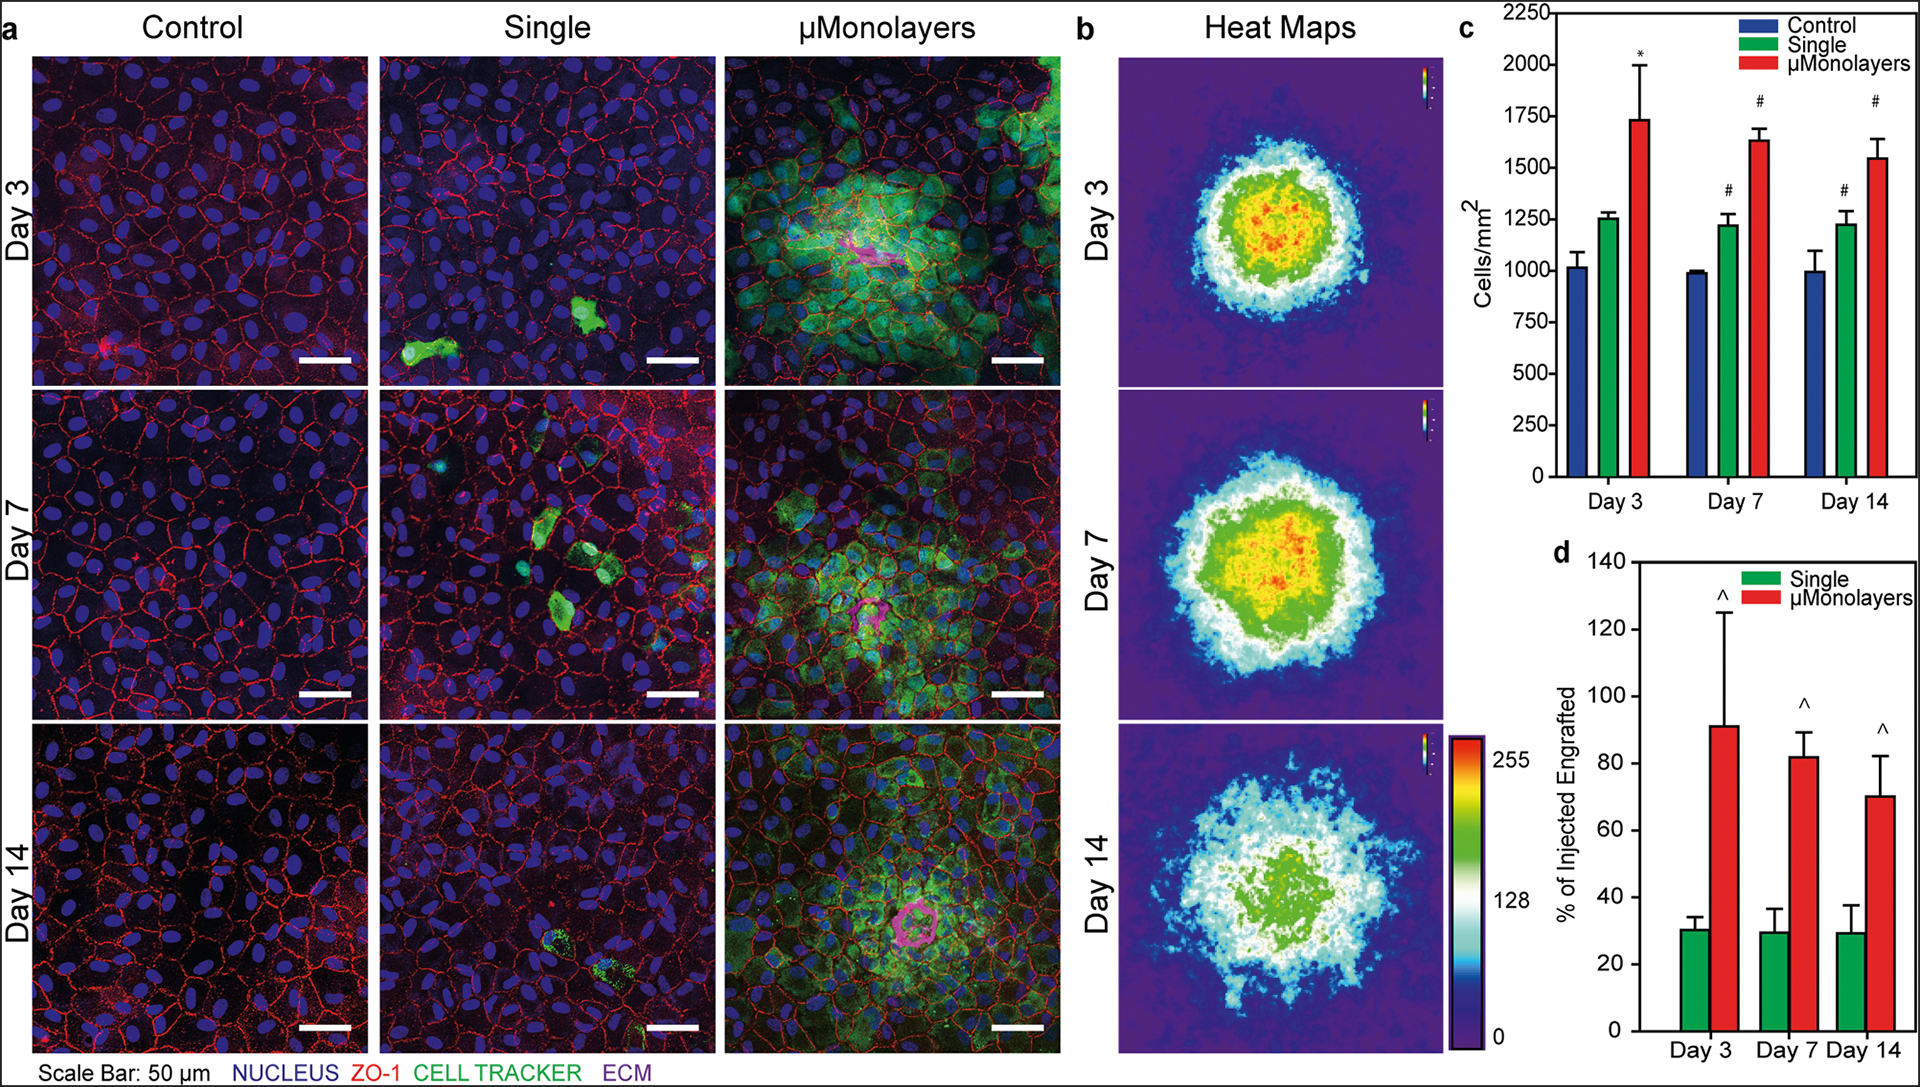
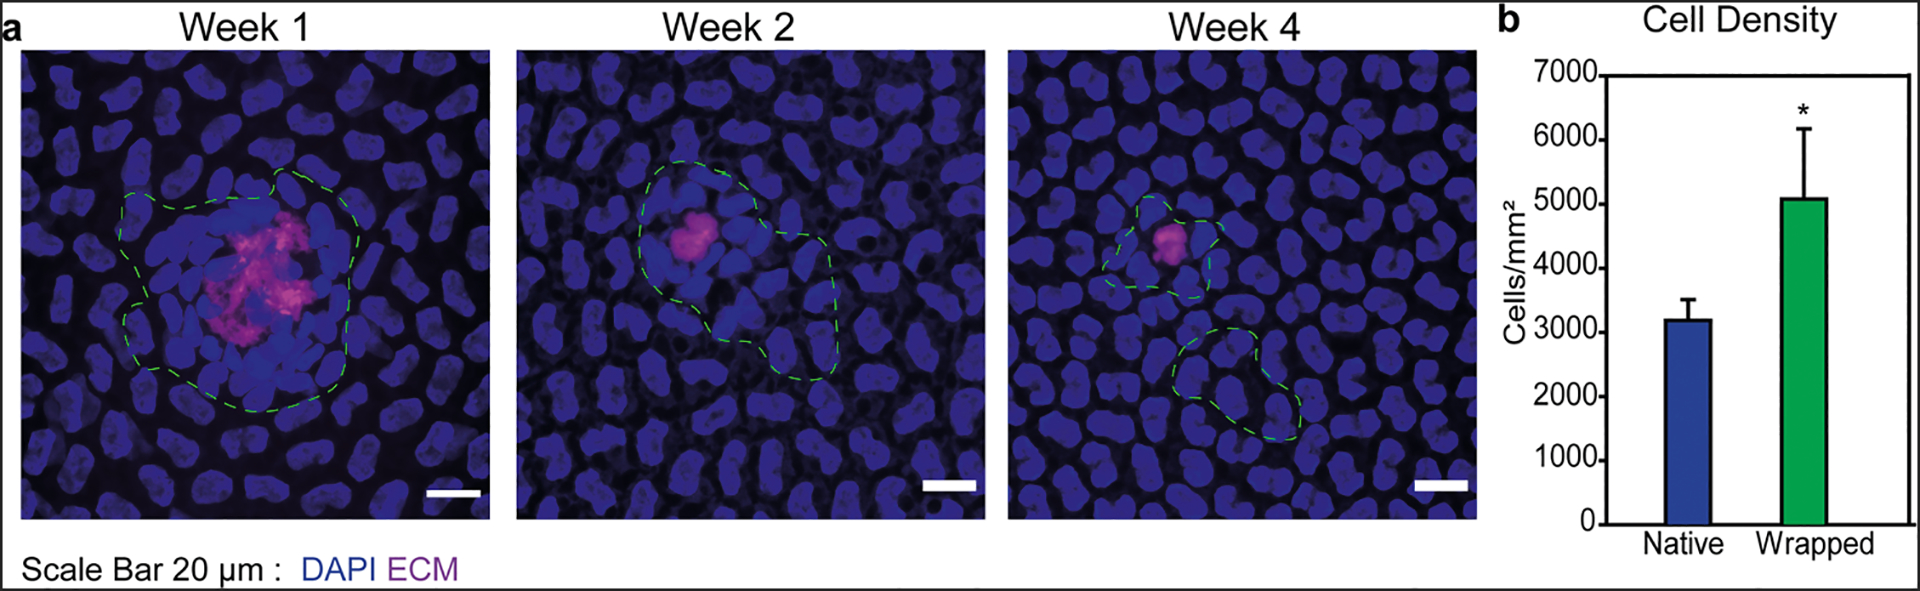
Cell injection is a common clinical approach for therapeutic delivery into diseased and damaged tissues in order to achieve regeneration. However, cell retention, viability, and engraftment at the injection site have generally been poor, driving the need for improved approaches. Here, we developed a technique to shrink-wrap micropatterned islands of corneal endothelial cells in a basement membrane-like layer of extracellular matrix that enables the cells to maintain their cell-cell junctions and cytoskeletal structure while in suspension. These μMonolayers exhibited the ability to rapidly engraft into intact, high-density corneal endothelial monolayers in both in vitro and in vivo model systems. Importantly, the engrafted μMonolayers increased local cell density, something that the clinical-standard single cells in suspension failed to do. These results show that shrink-wrapping cells in extracellular matrix dramatically improves engraftment and provides a potential alternative to cornea transplant when low endothelial cell density is the cause of corneal blindness.


Conflict of interest statement

Competing interests Authors R. Palchesko and A.W. Feinberg are co-inventors on US Patent application no. 20170342374 entitled ECM scaffolds. All other authors declare no competing interests. All other authors have no competing interests.

Figures

Fig. 1
Fig. 1. Schematic representation of the process for shrink-wrapping and injecting corneal endothelial cell μMonolayers.
Steps a, b Surface-initiated assembly techniques are used to engineer 200 μm square, 5 nm-thick ECM scaffolds on the thermoresponsive polymer, PIPAAm. Steps c, d The samples and cells are then heated to 40 °C before seeding the cells on the squares and culturing for 24 hours. Steps e, f After 24 hours, samples are rinsed with warm media and cooled to room temperature to trigger the dissolution of the PIPAAm and shrink-wrapping/release of the μMonolayers of corneal endothelial cells before injection into the anterior chamber of the eye (Step g).
Fig. 2
Fig. 2. Bovine CE cells form μMonolayers on ECM squares and maintain their structure and viability through shrink-wrapping and injection.
a CE cells form monolayers on ECM squares microcontact printed onto PDMS (used as a control) and b on the thermoresponsive polymer PIPAAm. c Once the PIPAAm is dissolved the CE cell μMonolayers contract and are shrink-wrapped in the ECM squares. d The release and shrink-wrapping of μMonolayers occurs quickly, in <100 seconds once the water + sample cools to room temperature. e Confocal microscopy images show that after injection, the CE cells maintain both their cytoskeletal structure (F-actin, green), tight junctions (ZO-1, red), and adherence to the ECM scaffold (LAM + COL4, purple). f A 3D render of a shrink-wrapped CE cell μMonolayer 30 minutes after injection onto a glass surface illustrating how it begins to relax and return to its original shape. g Representative live/dead images of control single CE cells and shrink-wrapped CE cells show that both types of cells are viable with very few dead cells present. h Live/dead data showed no significant difference in viability between single cells (93 ± 4 %) and shrink-wrapped cells (97 ± 2%) following injection through a 28 G needle (n = 3 biologically independent samples for each; mean ± stdev represented by the dots and bars, individual samples are shown as the black x’s; N.S. by Student’s t test Single vs. μMonolayers).
Fig. 3
Fig. 3. Shrink-wrapped bovine CE cell μMonolayers maintain ZO-1 expression and F-actin cytoskeleton as they grow out of the ECM scaffolds to form a monolayer on a collagen type I stromal mimic.
a Six hours after reseeding onto a collagen type I gel, the single CE cells have no established F-actin cytoskeleton or ZO-1 expression. The cross-sectional view shows the rounded cell morphology. b In contrast, the CE cells in the shrink-wrapped μMonolayers have maintained their ZO-1 expression and F-actin cytoskeleton, while growing out of the ECM scaffolds. The cells at the periphery of the shrink-wrapped CE cells are also expressing ZO-1. The cross-sectional view shows that the cells are spreading. c At 24 hours, single CE cells have begun to spread and cover almost the entire scaffold. d At 24 hours, the CE cells have already grown out of the ECM scaffolds and formed an almost complete monolayer. For ad: Nucleus = blue, ZO-1 = red, ECM(COL4) = magenta, F-actin = green.
Fig. 4
Fig. 4. Injected shrink-wrapped bovine μMonolayers integrate into existing monolayers of bovine CE cells and significantly increase the density compared to single bovine CE cells.
a Cell Tracker labeled single cells and shrink-wrapped cells were visible at all time points however, significantly more shrink-wrapped cells were present at all time points and the ECM scaffolds were still visible 14 days after injection. Scale bars = 50 μm. b Heat maps of Cell Tracker positive pixels show that the cells in the shrink-wrapped μMonolayers initially integrate into a tight cluster and then the density equilibrates as the cells spread out slightly (Day 3 n = 33 independent shrink-wrapped clusters, Day 7 n = 37, Day 14 n = 40, scale bar is arbitrary units). c The cell density of the monolayers was calculated and compared on days 3 (n = 4 biologically independent samples for each sample type, each n is an average of 10 images per sample), 7 (control n = 3, single and μMonolayer n = 4, biologically independent samples, each n is an average of 10 images per sample) and 14 (single n = 3, control and μMonolayer n = 4, biologically independent samples, each n is an average of 10 images per sample). Data are represented as mean ± std dev and compared using one-way ANOVA on ranks with Tukey’s test (day 3) or one-way ANOVA with Tukey’s Test (day 7 and 14), where * (p < 0.05) indicates statistically significantly different from control and # (p < 0.05) indicates statistically significantly different from all other samples. d The percentage of the injected single and shrink-wrapped cells that were integrated into the monolayers was calculated on days 3 (n = 4 biologically independent samples for each sample type), 7 (control n = 3, single and μMonolayer n = 4, biologically independent samples) and 14 (single n = 3, control and μMonolayer n = 4, biologically independent samples) (each n is an average of 10 images per sample). Data are represented as mean ± std dev and compared using t test at each time point, where ^ (p <0.05) indicates a statistically significantly different from single cells.
Fig. 5
Fig. 5. Shrink-wrapped μMonolayers begin to integrate into low-density CE monolayers and ex vivo corneas within 3 hours.
a Time-lapse images from live confocal imaging of the integration of shrink-wrapped bovine μMonolayers (Cell Tracker green) into an engineered bovine CE monolayer (Cell Tracker Orange). At 3 hours, the μMonolayers have attached and begun to integrate and by 43 hours the cells are almost completely integrated into the monolayer. b Confocal images show that the shrink-wrapped rabbit μMonolayers had begun to integrate into the ex vivo rabbit CE and the ECM scaffold is observed to be between μMonolayers and the existing rabbit CE. The yellow vertical and horizontal lines indicate the places at which the orthogonal views were obtained.
Fig. 6
Fig. 6. Shrink-wrapped μMonolayers integrate into the existing healthy rabbit CE.
a Rabbit corneas injected with single cells remained clear at 1 week post injection. However, very few DiO-labeled single cells were observed integrated into the rabbit CE. b The rabbit cornea injected with μMonolayers also remained clear 1-week post injection and numerous clusters of μMonolayers were observed in each cornea with the continuous ZO-1 at the borders between DiO-labeled cells and native rabbit CE cells. c Confocal microscopy images showing the integrated DiO-labeled shrink-wrapped μMonolayers at 1, 2-, and 4 weeks post injection. Nuclei = blue, DiO-labeled cells (green), ZO-1 (red), ECM nanoscaffold (purple). d The same images from c with the ZO-1 removed to highlight the nuclei of both the healthy rabbit endothelium and injected cells (blue), DiO-labeled injected rabbit cells (green), and ECM nanoscaffold (purple) from the shrink-wrapping process at 1, 2-, and 4 weeks post injection. e The orthogonal views of the confocal images shown in d showing the integration of the shrink-wrapped μMonolayers into the healthy rabbit endothelium over the 4-week period post injection. Scale bars in a and b are 50 μm, and in ce are 20 μm.
Fig. 7
Fig. 7. Shrink-wrapped μMonolayers exhibit stable integration into the existing healthy rabbit CE.
a Confocal microscopy images showing the integrated shrink-wrapped μMonolayers at 1, 2-, and 4 weeks post injection. The images show that the ECM scaffold is under the cell bodies post integration and that the cell density around the ECM at 1 week post injection is higher and then begins to dissipate into the outer areas by week 4 post injection. The DiO channel has been removed for clarity and a dashed green line was drawn around the cells that were DiO positive for reference. b Graph showing the cell density in the areas of the integrated shrink-wrapped μMonolayers (n = 18 independent green areas, represented by the green bar) compared to native areas within the same image with no DiO-labeled cells (n = 18 independent areas with no green, represented by the blue bar). Data are represented as mean ± standard deviation and were compared using a student t test. It was found that the density in the areas with shrink-wrapped μMonolayers was significantly higher than the native CE cell density (*p < 0.05).

References

    1. World Health Organization. Donation and Transplantation. https://www.who.int/transplantation/donation/taskforce-transplantation/en/ (2020).
    1. Beyar R Challenges in organ transplantation. Rambam Maimonides Med. J 2, e0049 (2011). - PMC - PubMed
    1. Wu R, Hu X & Wang J Concise review: optimized strategies for stem cell-based therapy in myocardial repair: clinical translatability and potential limitation. Stem Cells 36, 482–500 (2018). - PubMed
    1. Hering BJ et al. Phase 3 trial of transplantation of human islets in type 1 diabetes complicated by severe hypoglycemia. Diabetes Care 39, 1230–1240 (2016). - PMC - PubMed
    1. Shapiro AM et al. Islet transplantation in seven patients with type 1 diabetes mellitus using a glucocorticoid-free immunosuppressive regimen. N. Engl. J. Med 343, 230–238 (2000). - PubMed

LinkOut - more resources