

T cell receptor-directed antibody-drug conjugates for the treatment of T cell-derived cancers
- PMID: 39176070
- PMCID: PMC11338945
- DOI: 10.1016/j.omton.2024.200850
T cell receptor-directed antibody-drug conjugates for the treatment of T cell-derived cancers
Abstract
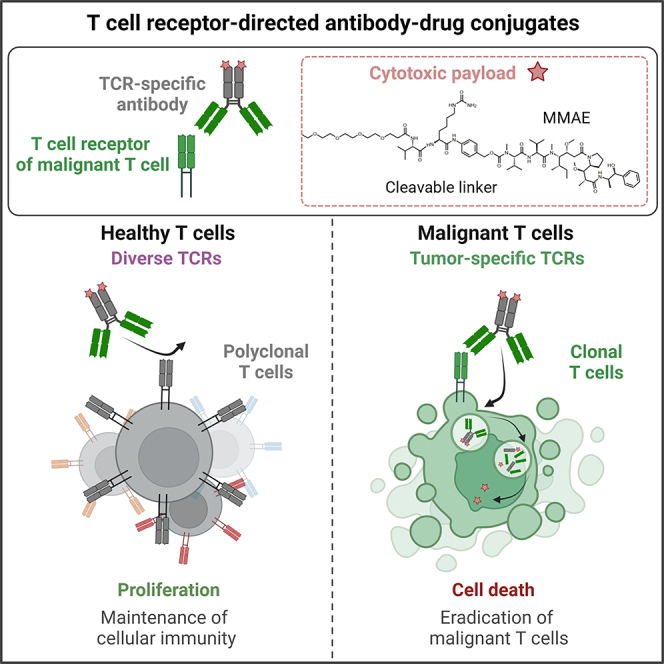
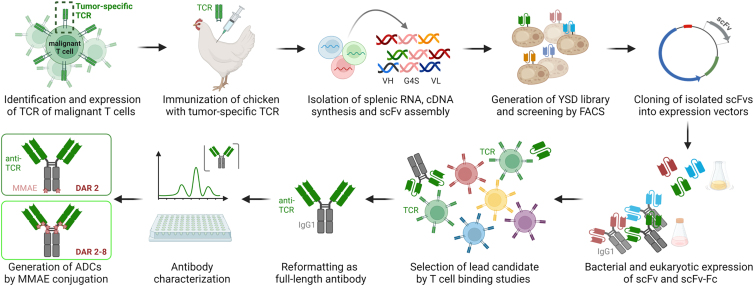
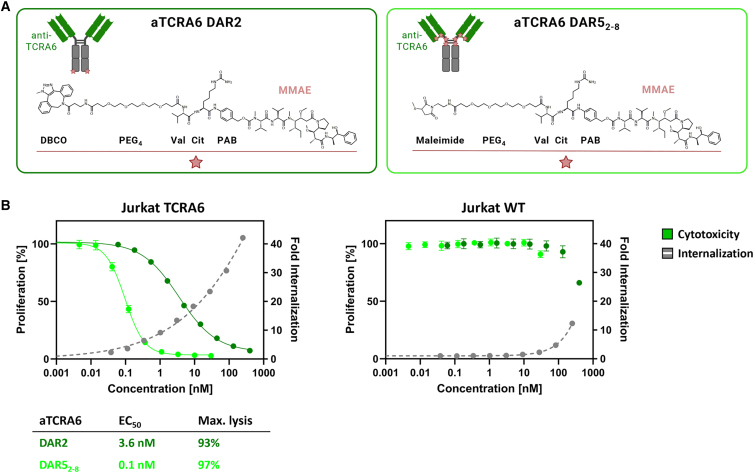
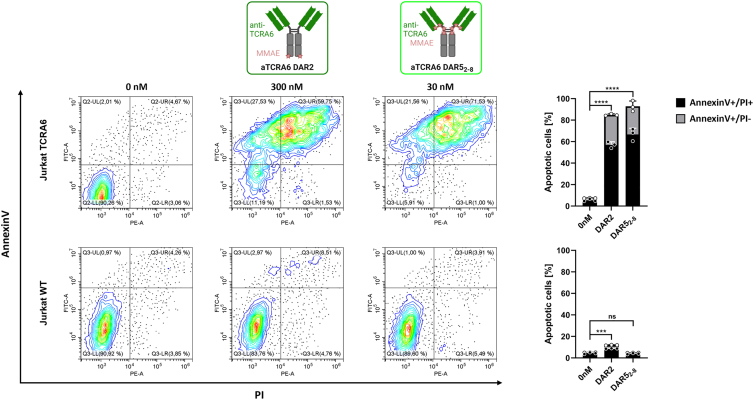
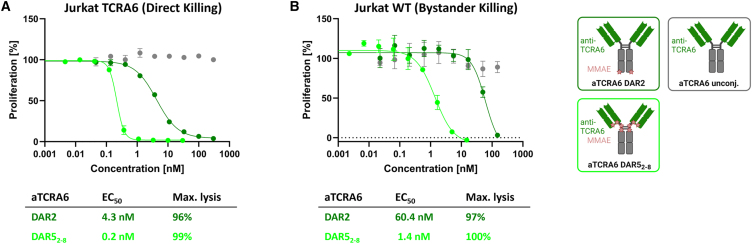
T cell-derived cancers are hallmarked by heterogeneity, aggressiveness, and poor clinical outcomes. Available targeted therapies are severely limited due to a lack of target antigens that allow discrimination of malignant from healthy T cells. Here, we report a novel approach for the treatment of T cell diseases based on targeting the clonally rearranged T cell receptor displayed by the cancerous T cell population. As a proof of concept, we identified an antibody with unique specificity toward a distinct T cell receptor (TCR) and developed antibody-drug conjugates, precisely recognizing and eliminating target T cells while preserving overall T cell repertoire integrity and cellular immunity. Our anti-TCR antibody-drug conjugates demonstrated effective receptor-mediated cell internalization, associated with induction of cancer cell death with strong signs of apoptosis. Furthermore, cell proliferation-inhibiting bystander effects observed on target-negative cells may contribute to the molecules' anti-tumor properties precluding potential tumor escape mechanisms. To our knowledge, this represents the first anti-TCR antibody-drug conjugate designed as custom-tailored immunotherapy for T cell-driven pathologies.
Keywords: T cell leukemia; T cell lymphoma; T cell receptor; antibody-drug conjugate; idiotype; targeted therapy; yeast surface display.
© 2024 The Author(s).
Conflict of interest statement
The authors declare no competing interests.
Figures
Similar articles
-
Specific Targeting of Lymphoma Cells Using Semisynthetic Anti-Idiotype Shark Antibodies.Front Immunol. 2020 Nov 26;11:560244. doi: 10.3389/fimmu.2020.560244. eCollection 2020. Front Immunol. 2020. PMID: 33324393 Free PMC article.
-
Development of a TCR-like antibody and chimeric antigen receptor against NY-ESO-1/HLA-A2 for cancer immunotherapy.J Immunother Cancer. 2022 Mar;10(3):e004035. doi: 10.1136/jitc-2021-004035. J Immunother Cancer. 2022. PMID: 35338087 Free PMC article.
-
The targeting of CD4+ T lymphocytes to a B cell lymphoma. A comparison of anti-CD3-anti-idiotype antibody conjugates and antigen-anti-idiotype antibody conjugates.J Immunol. 1989 Jun 1;142(11):4079-84. J Immunol. 1989. PMID: 2523940
-
Strategies and Advancement in Antibody-Drug Conjugate Optimization for Targeted Cancer Therapeutics.Biomol Ther (Seoul). 2015 Nov;23(6):493-509. doi: 10.4062/biomolther.2015.116. Epub 2015 Nov 1. Biomol Ther (Seoul). 2015. PMID: 26535074 Free PMC article. Review.
-
Systematic review of recent advancements in antibody-drug and bicycle toxin conjugates for the treatment of urothelial cancer.Ther Adv Urol. 2024 May 20;16:17562872241249073. doi: 10.1177/17562872241249073. eCollection 2024 Jan-Dec. Ther Adv Urol. 2024. PMID: 38779496 Free PMC article. Review.
Cited by
-
Recent Advancements in Cell-Based Therapies in Melanoma.Int J Mol Sci. 2024 Sep 12;25(18):9848. doi: 10.3390/ijms25189848. Int J Mol Sci. 2024. PMID: 39337333 Free PMC article. Review.
References
-
- Belver L., Ferrando A. The genetics and mechanisms of T cell acute lymphoblastic leukaemia. Nat. Rev. Cancer. 2016;16:494–507. - PubMed
-
- The Non-Hodgkin's Lymphoma Classification Project; A Clinical Evaluation of the International Lymphoma Study Group Classification of Non-Hodgkin's Lymphoma. Blood. 1997;89:3909–3918. - PubMed
-
- Pui C.-H., Robison L.L., Look A.T. Acute lymphoblastic leukaemia. Lancet (London, England) 2008;371:1030–1043. - PubMed
LinkOut - more resources
Full Text Sources
Research Materials