. 2024 Aug 8:15:1400574.
doi: 10.3389/fimmu.2024.1400574. eCollection 2024.

Citrulline and ADI-PEG20 reduce inflammation in a juvenile porcine model of acute endotoxemia

Affiliations

Citrulline and ADI-PEG20 reduce inflammation in a juvenile porcine model of acute endotoxemia

Caitlin Vonderohe et al. Front Immunol. .

Abstract

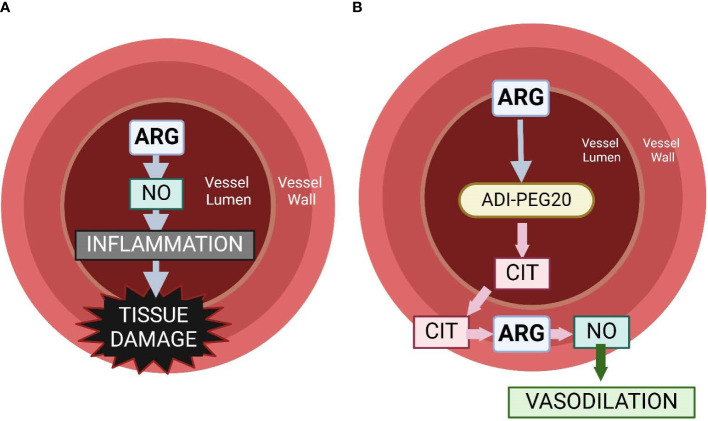
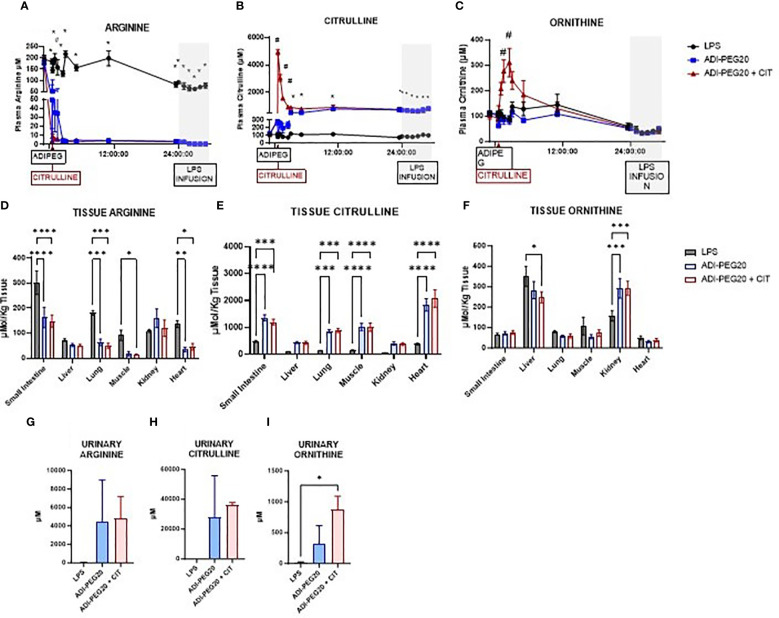
Background: Arginine is a conditionally essential amino acid that is depleted in critically ill or surgical patients. In pediatric and adult patients, sepsis results in an arginine-deficient state, and the depletion of plasma arginine is associated with greater mortality. However, direct supplementation of arginine can result in the excessive production of nitric oxide (NO), which can contribute to the hypotension and macrovascular hypo-reactivity observed in septic shock. Pegylated arginine deiminase (ADI-PEG20, pegargiminase) reduces plasma arginine and generates citrulline that can be transported intracellularly to generate local arginine and NO, without resulting in hypotension, while maintaining microvascular patency. The objective of this study was to assess the efficacy of ADI-PEG20 with and without supplemental intravenous citrulline in mitigating hypovolemic shock, maintaining tissue levels of arginine, and reducing systemic inflammation in an endotoxemic pediatric pig model.

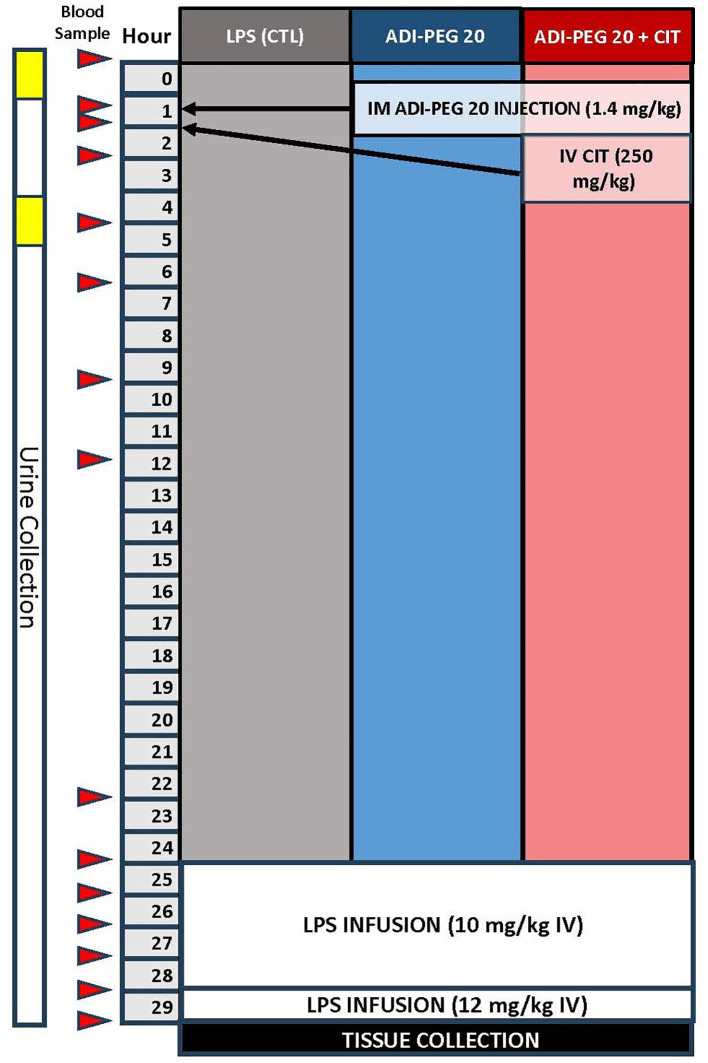
Methods: Twenty 3-week-old crossbred piglets were implanted with jugular and carotid catheters as well as telemetry devices in the femoral artery to measure blood pressure, body temperature, heart rate, and respiration rate. The piglets were assigned to one of three treatments before undergoing a 5 h lipopolysaccharide (LPS) infusion protocol. Twenty-four hours before LPS infusion, control pigs (LPS; n=6) received saline, ADI-PEG20 pigs (n=7) received an injection of ADI-PEG20, and seven pigs (ADI-PEG20 + CIT pigs [n=7]) received ADI-PEG20 and 250 mg/kg citrulline intravenously. Pigs were monitored throughout LPS infusion and tissue was harvested at the end of the protocol.

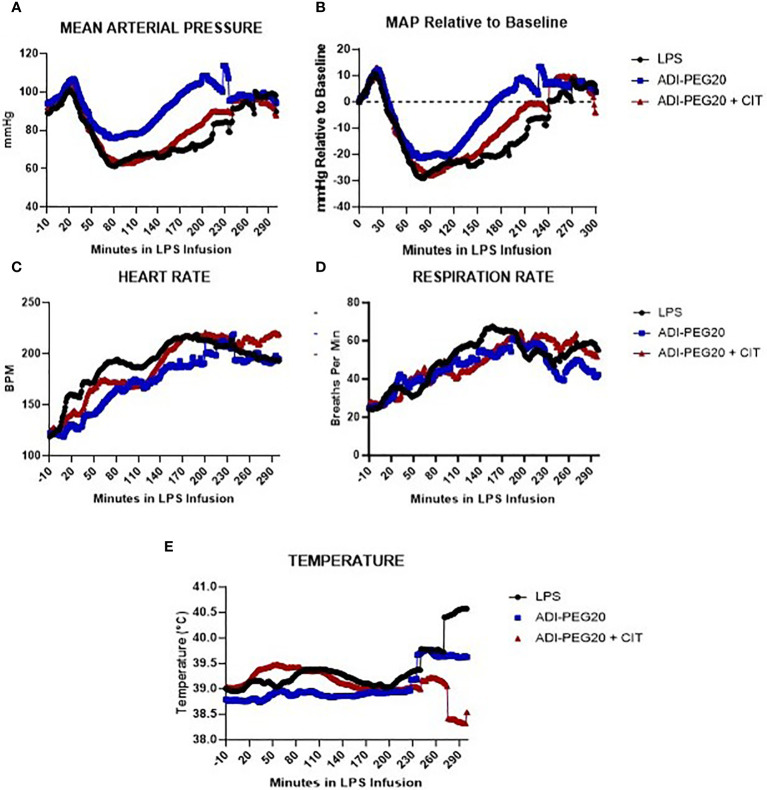
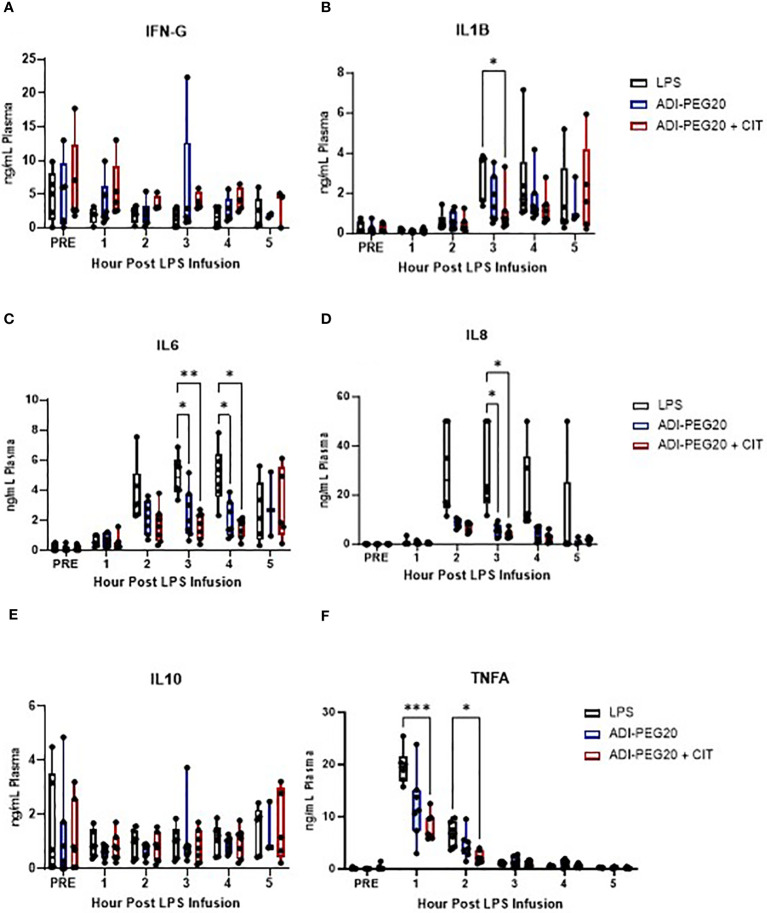
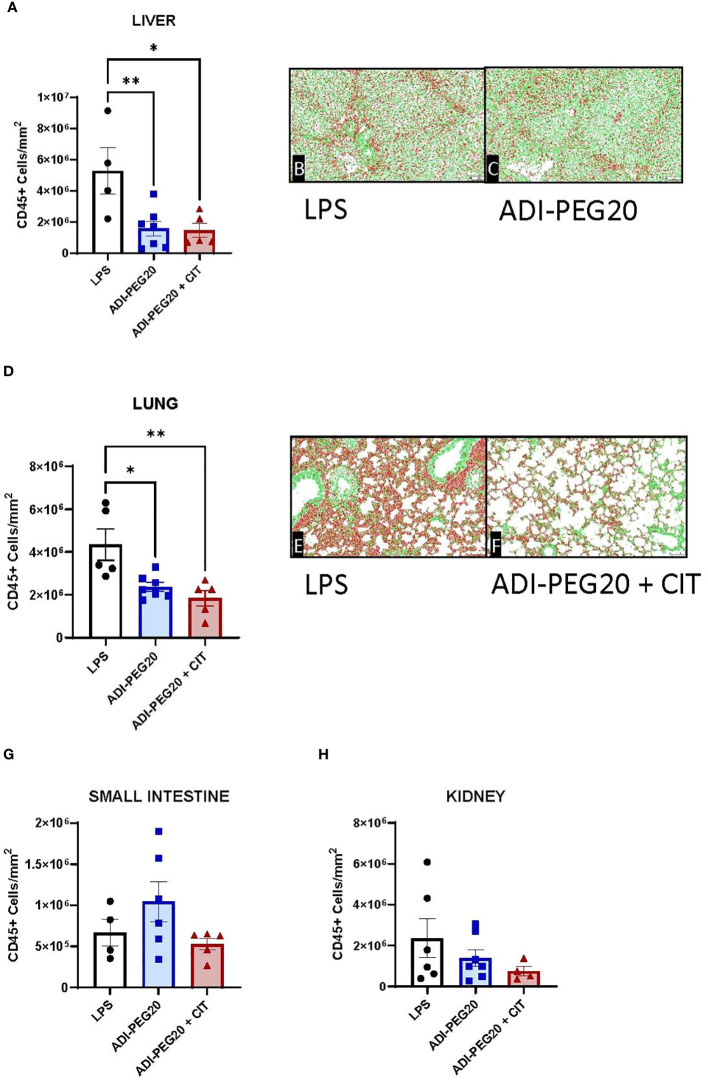
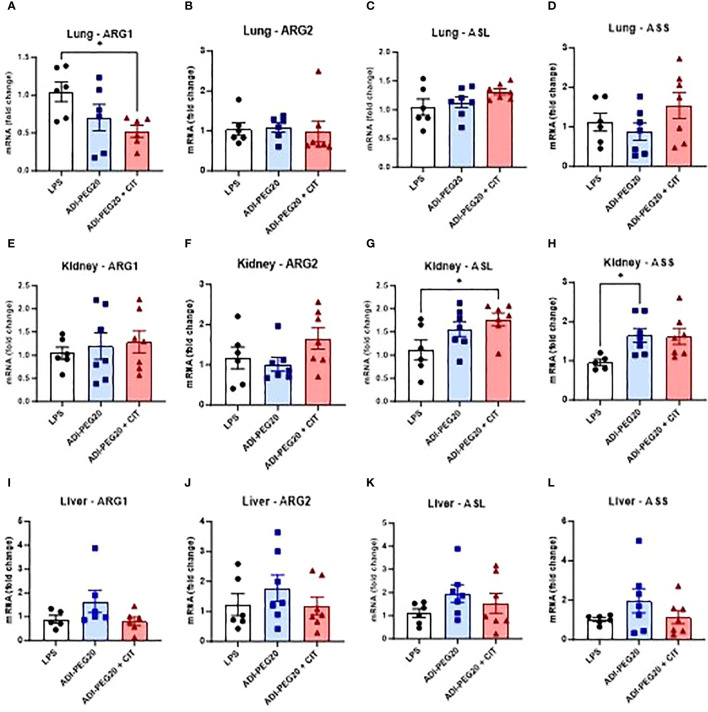
Results: Plasma arginine levels decreased and remained low in ADI-PEG20 + CIT and ADI-PEG20 pigs compared with LPS pigs but tissue arginine levels in the liver and kidney were similar across all treatments. Mean arterial pressure in all groups decreased from 90 mmHg to 60 mmHg within 1 h of LPS infusion but there were no significant differences between treatment groups. ADI-PEG20 and ADI-PEG20 + CIT pigs had less CD45+ infiltrate in the liver and lung and lower levels of pro-inflammatory cytokines in the plasma.

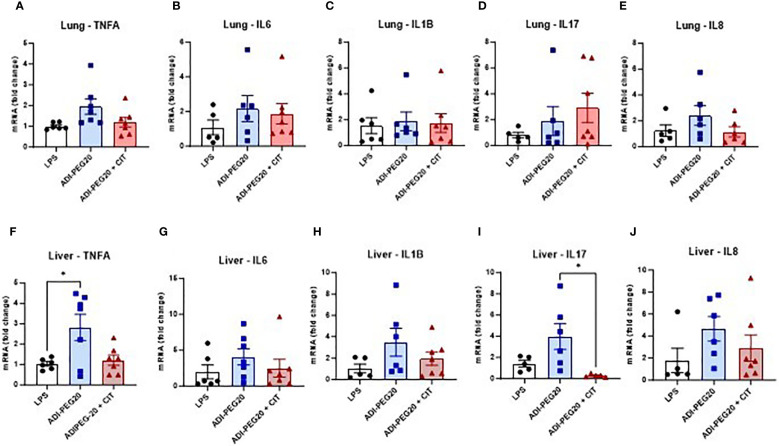
Conclusion: ADI-PEG20 and citrulline supplementation failed to ameliorate the hypotension associated with acute endotoxic sepsis in pigs but reduced systemic and local inflammation in the lung and liver.

Keywords: ADI-PEG20; NO; arginine; citrulline; sepsis.


Conflict of interest statement

The authors declare that the research was conducted in the absence of any commercial or financial relationships that could be construed as a potential conflict of interest.

Figures

Figure 1
Figure 1
Graphical representation of the hypothesis of the physiology associated with intravascular arginine (A) vs. the use of ADI-PEG20 (B). We hypothesize that the use of ADI-PEG20 in an endotoxemia model will effectively remove arginine from the lumen of the vasculature, preventing it from becoming intralumenal NO, which can be a potent pro-inflammatory cytokine. ADI-PEG20 catalyzes the conversion of arginine to citrulline. Citrulline is transported out of the vasculature into the vessel wall or into the tissue where it can be converted into arginine, and then NO acts as a vasodilator, preventing hypoxic injury to tissue.
Figure 2
Figure 2
Schematic of the study design and blood sampling protocol relative to lipopolysaccharide infusion, ADIPEG injection, and citrulline bolus.
Figure 3
Figure 3
Telemetry data generated from pigs undergoing endotoxin infusion were measured using implanted probes, analyzed using repeated measures, and presented as means over time. The variation among pigs was high and is not represented on this graph. (A, B) Mean arterial pressure (MAP), presented as the mean in all treatments (LPS n=6; ADIPEG n=7; ADIPEG + CIT n=7), dropped (P<0.05) after 1 h of infusion but increased to a level similar to that at the beginning of the infusion by the end of the infusion. There were no statistical differences between treatments throughout the infusion (P>0.1). Heart rate (C) and respiration rate (D) were also similar among treatments (P>0.1) (E) and both increased throughout the infusion until hour 3 (P<0.05), at which point they remained similar until the end of the protocol. Mean temperature remained consistent across time and treatment (P>0.10).
Figure 4
Figure 4
IStat clinical chemistries (CHEM8+ cartridges) were measured throughout the endotoxin infusion and are presented as mean and SEM. Blood pH (A) did not differ over time or across treatments (LPS n=6; ADIPEG n=7; ADIPEG + CIT n=7) (P>0.1). Blood glucose (B) was higher in the LPS and ADIPEG pigs than in the ADIPEG+CIT pigs at hour 1 of the endotoxin infusion (P<0.05) but did not differ across treatments at any other time point during the infusion (P>0.10). The partial pressure of carbon dioxide (pCO2; C) was statistically similar across treatments throughout the infusion (P>0.10). The partial pressure of oxygen (pO2; D) was also similar across treatments throughout the infusion (P>0.10). The base excess of the extracellular fluid (BE ECF; E) dropped in all treatments by hour 1 of the infusion and was higher in the LPS pigs at hour 5 than in the ADIPEG and the ADIPEG + CIT pigs (P<0.05). Bicarbonate levels (HCO3; F) were similar across treatments until hour 5 of the infusion, at which point pigs on the LPS treatment had higher HCO3 than ADPIPEG and ADIPEG + CIT pigs (P<0.05). Total carbon dioxide (TCO2; G) was also similar across treatments from hours 1–4 of the infusion (P>0.10), but was greater in the LPS pigs at hour 5 (P<0.05). Finally, blood lactate levels (H) increased similarly (P>0.10) across treatments from pre-infusion levels to hour 1 of the infusion and remained elevated throughout the endotoxin infusion period. *P(TRTxTime) <0.05.
Figure 5
Figure 5
Plasma cytokine levels during the 5-h endotoxin infusion, presented as mean with standard deviation and range, measured using a porcine-specific multiplex ELISA, and analyzed using a two-way ANOVA with fixed effects of treatment and time. Interferon-gamma levels (IFNG; A) were similar across treatments throughout the infusion (LPS n=6; ADIPEG n=7; ADIPEG + CIT n=7). Interleukin 1-beta (IL1B; B) was lower in the ADIPEG + CIT pigs than in the LPS pigs at hour 3 of the infusion. Interleukin-6 (IL-6; C) was higher in the LPS pigs than in the ADIPEG and ADIPEG + CIT pigs at hours 3 and 4 of the infusion (P<0.05). Similarly, interleukin 8 (IL-8, D) was higher in the LPS pigs than in the ADIPEG and ADIPEG + CIT pigs at hour 3 of the infusion. Interleukin-10 (IL10; E) was similar across treatments (P>0.10) throughout the endotoxin infusion. Tumor necrosis factor-alpha (TNFA; F) was greater in the LPS pigs than in the ADIPEG+CIT pigs at hours 1 and 2 of the infusion (P>0.05) but were otherwise similar across treatments. *P(TRTxTime) <0.05; **P(TRTxTime)<0.01; ***P(TRTxTime) <0.001.
Figure 6
Figure 6
Relative expression of tumor necrosis factor-alpha (TNFA), interleukin-6 (IL6), interleukin 1-beta (IL1B), interleukin 17 (IL17), and interkeukin 8 (IL8) in the lung (A–E) and liver (F-J), measured using RT-qPCR and analyzed using one-way ANOVA. Values are represented as mean ± SEM. *P(TRT) <0.05.
Figure 7
Figure 7
Gross and histologic injury scores of tissues after endotoxin infusion (LPS n=6; ADIPEG n=7; ADIPEG + CIT n=7). Data are represented as means +/- SEM. Gross scores (A) were assessed by a licensed veterinarian based on the gross appearance of the small intestine, lung, liver, spleen, and kidney. There were no differences in the mean injury score in any tissue between treatments (P>0.10). Additionally, H&E-stained slides (B) of the small intestine, lung and liver were scored for injury by a boarded veterinary pathologist. No statistical differences were detected between treatments (P>0.10).
Figure 8
Figure 8
Immunohistochemical quantification of CD45+ cells in the liver, lung, small intestine, and kidney measured using a colorimetric algorithm and corrected for the number of nuclei infusion (LPS n=6; ADIPEG n=7; ADIPEG+CIT n=7). Mean CD45+ cell count is represented as ± SEM. Liver and lung CD45+ cells (A, D) were greater in LPS pigs than in ADIPEG and ADIPEG + CIT pigs. Panels (B, C, E, F) are representative images of the stained and scanned liver and lung slides with the overlying algorithm highlighting immunohistochemically stained cells (red) relative to tissue parenchyma (green). There were no statistical differences in CD45+ cell count in the small intestine and kidney (G, H). *P(TRTxTime) <0.05; **P(TRTxTime)<0.01.
Figure 9
Figure 9
Plasma, tissue, and urinary arginine, citrulline, and ornithine are represented as means ± SEM. Plasma arginine (A), citrulline (B), and ornithine (C) were analyzed as repeated measures. *P(TRTxTIME) LPS vs. ADIPEG and ADIPEG + CIT <0.05; #P(TRTxTIME) ADIPEG + CIT vs. LPS and ADIPEG <0.05 (LPS n=6; ADIPEG n=7; ADIPEG+CIT n=7). Tissue levels of arginine (D), citrulline (E), and ornithine (F) were measured in the small intestine, liver, lung, muscle, kidney, and heart and measured as a one-way ANOVA (LPS n=6; ADIPEG n=7; ADIPEG + CIT n=7). *P(TRT) <0.05; **P(TRTxTime)<0.01; ***P(TRTxTime) <0.001 ****P(TRTxTime) <0.0001. Urinary arginine (G), citrulline (H), and ornithine (I) were measured (N=2 per TRT) and compared using Student’s T tests. *P(TRT) <0.05.
Figure 10
Figure 10
Relative mRNA expression of enzymes involved in arginine metabolism: arginase 1 (ARG1), arginase 2 (ARG2), arginosuccinate lyase (ASL), and arginosuccinate synthase (ASS) were measured using RT-qPCR (LPS n=6; ADIPEG n=7; ADIPEG+CIT n=7) in the lung (A-D), kidney (E-H), and liver (I-L). *P(TRT) <0.05.

Similar articles

Cited by

References

    1. Mathias B, Mira JC, Larson SD. Pediatric sepsis. Curr Opin Pediatr. (2016) 28:380–7. doi: 10.1097/MOP.0000000000000337 - DOI - PMC - PubMed
    1. Rudd KE, Kissoon N, Limmathurotsakul D, Bory S, Mutahunga B, Seymour CW, et al. . The global burden of sepsis: barriers and potential solutions. Crit Care. (2018) 22:232. doi: 10.1186/s13054-018-2157-z - DOI - PMC - PubMed
    1. Vincent JL, Marshall JC, Namendys-Silva SA, François B, Martin-Loeches I, Lipman J, et al. . Assessment of the worldwide burden of critical illness: the intensive care over nations (ICON) audit. Lancet Respir Med. (2014) 2:380–6. doi: 10.1016/S2213-2600(14)70061-X - DOI - PubMed
    1. Ruth A, McCracken CE, Fortenberry JD, Hall M, Simon HK, Hebbar KB. Pediatric severe sepsis: current trends and outcomes from the Pediatric Health Information Systems database. Pediatr Crit Care Med. (2014) 15:828–38. doi: 10.1097/PCC.0000000000000254 - DOI - PubMed
    1. Balamuth F, Weiss SL, Neuman MI, Scott H, Brady PW, Paul R, et al. . Pediatric severe sepsis in U.S. children's hospitals. Pediatr Crit Care Med. (2014) 15:798–805. doi: 10.1097/PCC.0000000000000225 - DOI - PMC - PubMed

LinkOut - more resources