. 2024 Aug 15;15(36):14746-14756.
doi: 10.1039/d4sc04306e. Online ahead of print.

Ultrafast photophysics of para-substituted 2,5-bis(arylethynyl) rhodacyclopentadienes: thermally activated intersystem crossing

Affiliations

Ultrafast photophysics of para-substituted 2,5-bis(arylethynyl) rhodacyclopentadienes: thermally activated intersystem crossing

Zilong Guo et al. Chem Sci. .

Abstract

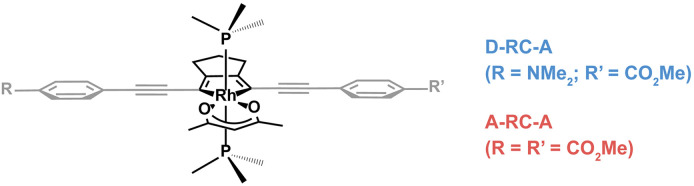
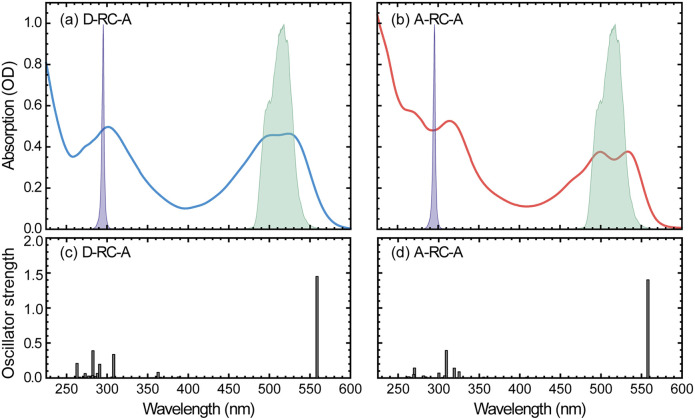
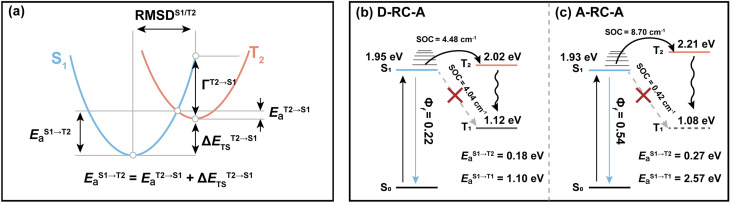
2,5-Bis(phenylethynyl) rhodacyclopentadienes (RCPDs), as a type of Rh(iii) complex, exhibit unusually intense fluorescence and slow intersystem crossing (ISC) due to weak metal-ligand interactions. However, details on their ultrafast photophysics and ISC dynamics are limited. In this work, electronic relaxation upon photoexcitation of two substituted RCPDs with two -CO2Me (A-RC-A) or -NMe2/-CO2Me (D-RC-A) end groups are comprehensively investigated using femtosecond transient absorption spectroscopy and theoretical analysis. Upon ultraviolet and visible excitation, dephasing of vibrational coherence, charge transfer, conformation relaxation, and ISC are observed experimentally. By calculating the spin-orbit coupling, reorganization energy, and adiabatic energy gap of plausible ISC channels, semi-classical Marcus theory revealed the dominance of thermally activated ISC (S1 → T2) for both D-RC-A and A-RC-A, while S1 → T1 channels are largely blocked due to high ISC barriers. With weak spin-orbit coupling, such differences in plausible ISC channels are predominately tuned by energetic parameters. Singlet oxygen sensitization studies of A-RC-A provide additional insight into the excited-state behavior of this complex.


Conflict of interest statement

There are no conflicts to declare.

Figures

Scheme 1
Scheme 1. Chemical structures of investigated D-RC-A and A-RC-A. The Rh(iii)–ligand core is illustrated in black while the peripheral groups are in gray. The phosphine ligand is PMe3.
Fig. 1
Fig. 1. (a and b) Static UV/visible absorption spectra of D-RC-A ((a), blue) and A-RC-A ((b), red) in THF solution (10−5 mol L−1), overlapped with spectra of UV (violet shaded) and visible (green shaded) excitation pulses employed in the fs-TA experiments. (c and d) TD-DFT-calculated vertical excitation energies and oscillator strengths of D-RC-A (c) and A-RC-A (d).
Fig. 2
Fig. 2. Spectro-temporal maps of λex-dependent fs-TA signals of D-RC-A upon UV (a) and visible (b) excitation as well as of A-RC-A upon identical UV (c) and visible (d) excitation. The spectral signatures of ISC-generated triplet states are highlighted by white dashed lines.
Fig. 3
Fig. 3. Target-analysis-extracted species-associated spectra (SAS) of λex-dependent fs-TA signals of D-RC-A upon 295 nm UV (a) and 513 nm visible (b) optical excitation, as well as SAS of A-RC-A upon identical UV (c) and visible (d) excitation. Four or five independent species were employed to reproduce the fs-TA signals.
Fig. 4
Fig. 4. Electronic relaxation of D-RC-A (left two panels) and A-RC-A (right two panels) revealed by λex-dependent fs-TA measurements.
Fig. 5
Fig. 5. (a) Simplified energetic diagram for calculating the ISC barrier of the S1 → T2 transition in the framework of Marcus theory, and energy diagrams for plausible ISC channels of D-RC-A (b) and A-RC-A (c), in which both T1 and T2 states are considered.
Fig. 6
Fig. 6. (a) Integrated intensity of the O2(a1Δg) phosphorescence signal upon irradiation at 417 nm, normalized by the sensitizer absorbance and the O2(a1Δg) lifetime, plotted as a function of laser power and collected over a range of O2 concentrations for both A-RC-A and for the reference standard, phenalenone (PN), in toluene-d8. The O2 concentration is represented as the percent of O2 in the O2/N2 gas mixture bubbled through the solution. The slopes of the linear fits are proportional to the O2(a1Δg) quantum yield. Representative time-resolved O2(a1Δg) phosphorescence traces used to obtain the A-RC-A data are shown in (b and c). (b) The data from 100 μs to 2000 μs were fitted by a single exponential decay function (solid lines) to obtain the lifetime of O2(a1Δg) (i.e., 1/kΔ). (c) Using kΔ as a fixed parameter, eqn (5) was used as a fitting function (solid lines) to obtain values of kT for a time domain where O2(a1Δg) was formed in the photosensitized reaction. (d) Plot of kT, obtained from the fits shown in (c) for the A-RC-A data, against the concentration of dissolved oxygen. The slope, (1.3 ± 0.1) × 109 M−1 s−1, is the bimolecular rate constant for oxygen quenching of the O2(a1Δg) precursor. The intercept yields a value of ∼9 μs for the lifetime of this O2(a1Δg) precursor in the absence of oxygen. Both of these numbers are consistent with expectation for oxygen quenching of a triplet state.

References

    1. Arias-Rotondo D. M. McCusker J. K. Chem. Soc. Rev. 2016;45:5803–5820. doi: 10.1039/C6CS00526H. - DOI - PubMed
    1. Nicewicz D. A. MacMillan D. W. C. Science. 2008;322:77–80. doi: 10.1126/science.1161976. - DOI - PMC - PubMed
    1. Strieth-Kalthoff F. James M. J. Teders M. Pitzer L. Glorius F. Chem. Soc. Rev. 2018;47:7190–7202. doi: 10.1039/C8CS00054A. - DOI - PubMed
    1. Du Y. Pearson R. M. Lim C.-H. Sartor S. M. Ryan M. D. Yang H. Damrauer N. H. Miyake G. M. Chem.–Eur. J. 2017;23:10962–10968. doi: 10.1002/chem.201702926. - DOI - PMC - PubMed
    1. Zhao X. Hou Y. Liu L. Zhao J. Energy Fuels. 2021;35:18942–18956. doi: 10.1021/acs.energyfuels.1c02130. - DOI

LinkOut - more resources