

Diabetes as a risk factor for tuberculosis disease
- PMID: 39177079
- PMCID: PMC11342417
- DOI: 10.1002/14651858.CD016013.pub2
Diabetes as a risk factor for tuberculosis disease
Abstract
Background: Tuberculosis (TB) is amongst the leading causes of death from an infectious disease, with an estimated 1.3 million deaths from TB in 2022. Approximately 25% of the global population is estimated to be infected with the TB bacterium, giving rise to 10.6 million episodes of TB disease in 2022. The prevalence of diabetes influences TB incidence and TB mortality. It is associated not only with an increased risk of TB disease but also death during TB treatment, TB relapse after treatment completion and multidrug-resistant TB. Since 2011, the World Health Organization (WHO) has recommended collaborative TB and diabetes activities as outlined in the Collaborative Framework for Care and Control of TB and Diabetes.
Objectives: To determine the prognostic value of diabetes mellitus (DM) in the general population of adults, adolescents and children for predicting tuberculosis disease.
Search methods: We searched the literature databases MEDLINE (via PubMed) and WHO Global Index Medicus, and the WHO International Clinical Trials Registry Platform (ICTRP) on 3 May 2023 (date of last search for all databases); we placed no restrictions on the language of publication.
Selection criteria: We included retrospective and prospective cohort studies, irrespective of publication status or language. The target population comprised adults, adolescents and children from diverse settings, encompassing outpatient and inpatient cohorts, with varying comorbidities and risk of exposure to tuberculosis.
Data collection and analysis: We used standard Cochrane methodology and the Quality In Prognosis Studies (QUIPS) tool. Prognostic factors assessed at enrolment/baseline included diabetes, as defined by the individual studies, encompassing patient-reported status, abstracted from medical records or claims data, or diagnosed by plasma glucose/glycosylated haemoglobin. The primary outcome was the incidence of tuberculosis disease. The secondary outcome was recurrent TB disease. We performed a random-effects meta-analysis for the adjusted hazard ratios, risk ratios, or odds ratios, employing the restricted maximum likelihood estimation. We rated the certainty of the evidence using the GRADE approach.
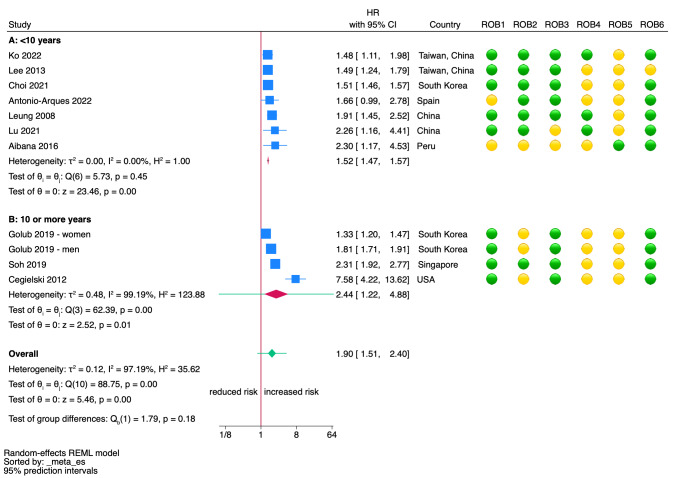
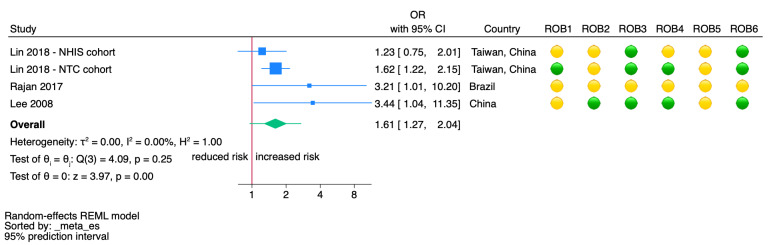
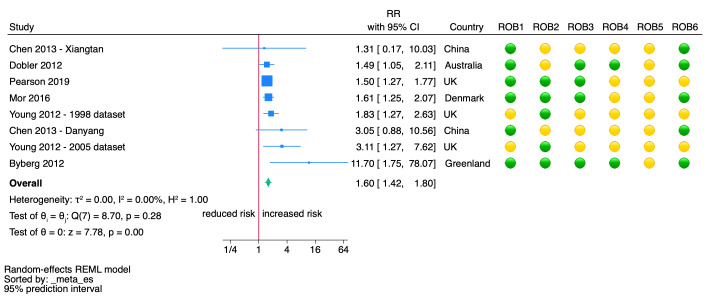
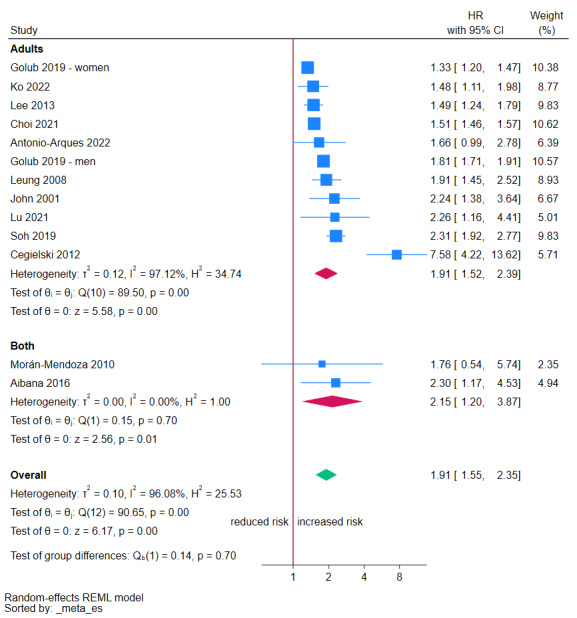
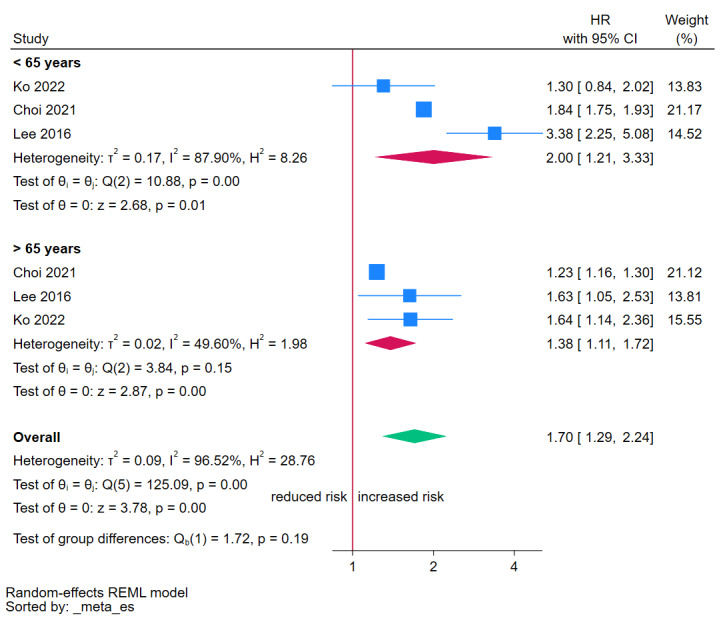
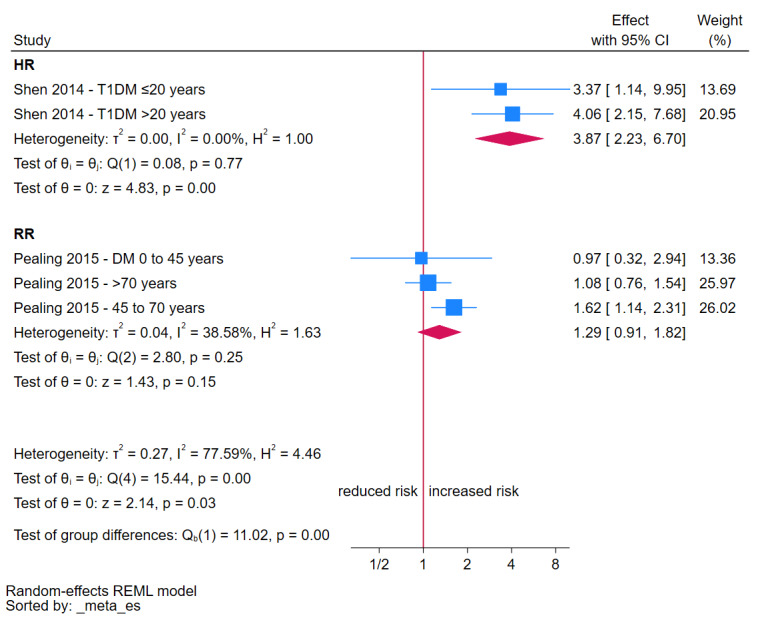
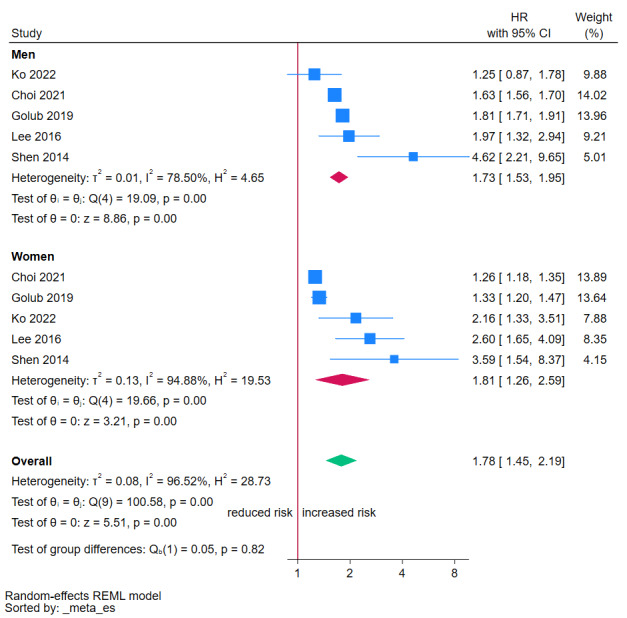
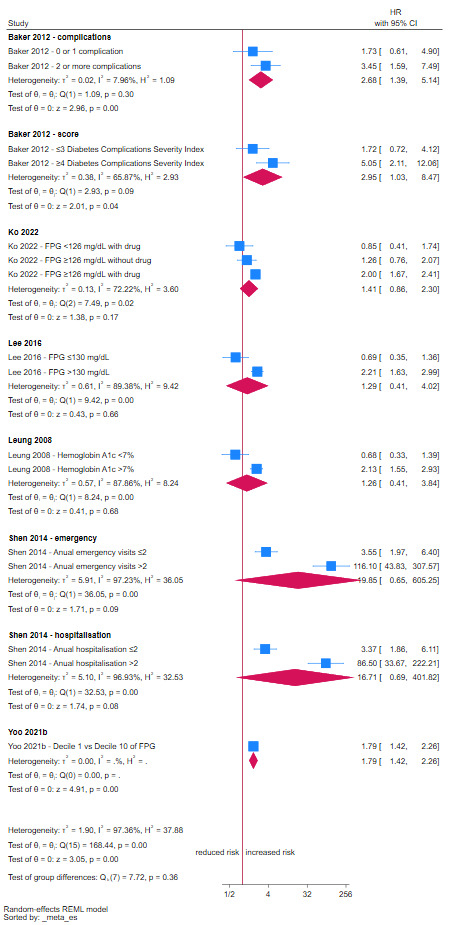
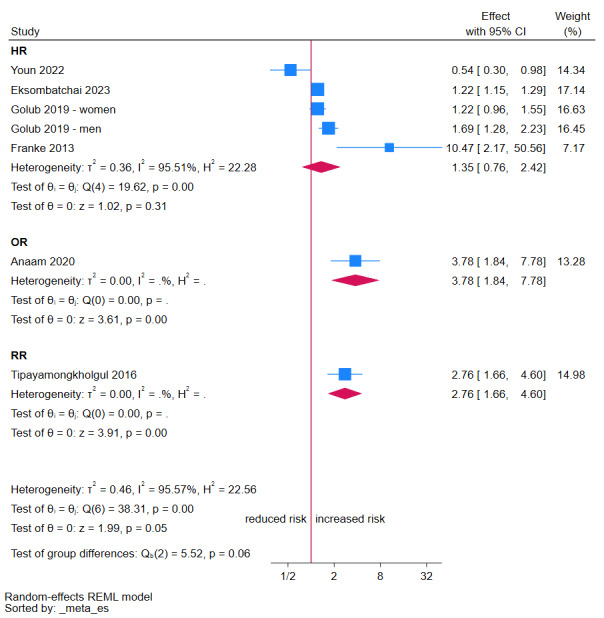
Main results: We included 48 cohort studies with over 61 million participants from the six WHO regions. However, the representation was variable as eight population-based studies were from South Korea and 19 from China, with overlapping study periods, and only one from the African region (Ethiopia). All studies included adults, and nine studies also included children and adolescents. Most studies diagnosed DM based on clinical records, including fasting blood glucose levels or glucose-lowering treatments. The studies did not distinguish between type 1 and type 2 DM; only one study focused on type 1 DM. Diagnosis and exclusion of TB were performed using culture or molecular WHO-recommended rapid diagnostic tests (mWRD) in only 12 studies, which could have biassed the effect estimate. The median follow-up time was five years (interquartile range 1.5 to 10, range 1 to 16.9), and the studies primarily reported an adjusted hazard ratio from a multivariable Cox-proportional hazard model. Hazard Ratios (HR) The HR estimates represent the highest certainty of the evidence, explored through sensitivity analyses and excluding studies at high risk of bias. We present 95% confidence intervals (CI) and prediction intervals, which show between-study heterogeneity represented in measuring the variability of effect sizes (i.e. the interval within which the effect size of a new study would fall considering the same population of studies included in the meta-analysis). DM may increase the risk of tuberculosis disease (HR 1.90, 95% CI 1.51 to 2.40; prediction interval 0.83 to 4.39; 10 studies; 11,713,023 participants). The certainty of the evidence is low, due to a moderate risk of bias across studies and inconsistency. Considering a risk without diabetes of 129 cases per 100,000 population, this represents 102 more (59 to 153 more) cases per 100,000. When stratified by follow-up time, the results are more consistent across < 10 years follow-up (HR 1.52, 95% CI 1.47 to 1.57; prediction interval 1.45 to 1.59; 7 studies; 10,380,872 participants). This results in a moderate certainty of the evidence due to a moderate risk of bias across studies. However, at 10 or more years of follow-up, the estimates yield a wider CI and a higher HR (HR 2.44, 95% CI 1.22 to 4.88; prediction interval 0.09 to 69.12; 3 studies; 1,332,151 participants). The certainty of the evidence is low due to the moderate risk of bias and inconsistency. Odds Ratio (OR) DM may increase the odds of tuberculosis disease (OR 1.61, 95% CI 1.27 to 2.04; prediction interval 0.96 to 2.70; 4 studies; 167,564 participants). Stratification by follow-up time was not possible as all studies had a follow-up < 10 years. The certainty of the evidence is low due to a moderate risk of bias and inconsistency. Risk Ratio (RR) The RR estimates represent the highest certainty of the evidence, explored through sensitivity analyses and excluding studies at high risk of bias. DM probably increases the risk of tuberculosis disease (RR 1.60, 95% CI 1.42 to 1.80; prediction interval 1.38 to 1.85; 6 studies; 44,058,675 participants). Stratification by follow-up time was not possible as all studies had a follow-up < 10 years. The certainty of the evidence is moderate due to a moderate risk of bias.
Authors' conclusions: Diabetes probably increases the risk of developing TB disease in the short term (< 10 years) and may also increase the risk in the long term (≥ 10 years). As glycaemic control and access to care may be potential effect modifiers of the association between diabetes and the risk of TB disease, the overall estimates should be interpreted with caution when applied locally. Policies targeted at reducing the burden of diabetes are needed to contribute to the aims of ending TB. Large population-based cohorts, including those derived from high-quality national registries of exposures (diabetes) and outcomes (TB disease), are needed to provide estimates with a high certainty of evidence of this risk across different settings and populations, including low- and middle-income countries from different WHO regions. Moreover, studies including children and adolescents and currently recommended methods for diagnosing TB would provide more up-to-date information relevant to practice and policy.
Funding: World Health Organization (203256442) REGISTRATION: PROSPERO registration: CRD42023408807.
Copyright © 2024 The Authors. Cochrane Database of Systematic Reviews published by John Wiley & Sons, Ltd. on behalf of The Cochrane Collaboration.
Conflict of interest statement
Juan Victor Ariel Franco: none known.
Brenda Bongaerts: none known.
Maria‐Inti Metzendorf: none known.
Agostina Risso: none known.
Yang Guo: none known.
Laura Peña Silva: none known.
Melanie Boeckmann: none known.
Sabrina Schlesinger: Novo Nordisk (Independent Contractor), Alpro Foundation (Grant/Contract).
Johanna AAG Damen: Universitair Medisch Centrum Utrecht (Employment).
Bernd Richter: consultant for the World Health Organization.
Anna Carlqvist: consultant for the World Health Organization.
Mathieu Bastard: employee of the World Health Organization.
Maria Nieves Garcia‐Casal: employee of the World Health Organization.
Bianca Hemmingsen: employee of the World Health Organization.
Farai Mavhunga: employee of the World Health Organization.
Jennifer Manne‐Goehler: consultant for the World Health Organization and National Institutes of Health (Grant/Contract).
Kerri Viney: employee of the World Health Organization.
Annabel Baddeley: employee of the World Health Organization.
Juan Victor Ariel Franco, Maria‐Inti Metzendorf, Brenda Bongaerts, and Bernd Richter are editors for the Cochrane Metabolic and Endocrine Disorders Group, but they were excluded from the editorial processing of this review.
The authors alone are responsible for the views expressed in this article, and they do not necessarily represent the views, decisions or policies of the institutions with which they are affiliated.
Figures
Update of
References
-
- World Health Organization. Global Tuberculosis Report 2023. https://www.who.int/teams/global-tuberculosis-programme/tb-reports/globa... (accessed 12 April 2024).
-
- CDC. Core Curriculum on Tuberculosis: What the clinician should know. https://www.cdc.gov/tb/education/corecurr/index.htm (accessed 21 April 2023).
-
- Brett K, Dulong C, Severn M; Canadian Agency for Drugs and Technologies in Health. Prevention of Tuberculosis: A Review of Guidelines 2020. pubmed.ncbi.nlm.nih.gov/33048484/ (accessed prior to 3 August 2024). [PMID: ] - PubMed
-
- World Health Organization. Tuberculosis and vulnerable populations. https://www.who.int/europe/news-room/fact-sheets/item/tuberculosis-and-v... (accessed 7 July 2023).
Publication types
MeSH terms
Grants and funding
LinkOut - more resources
Full Text Sources
Medical
Research Materials